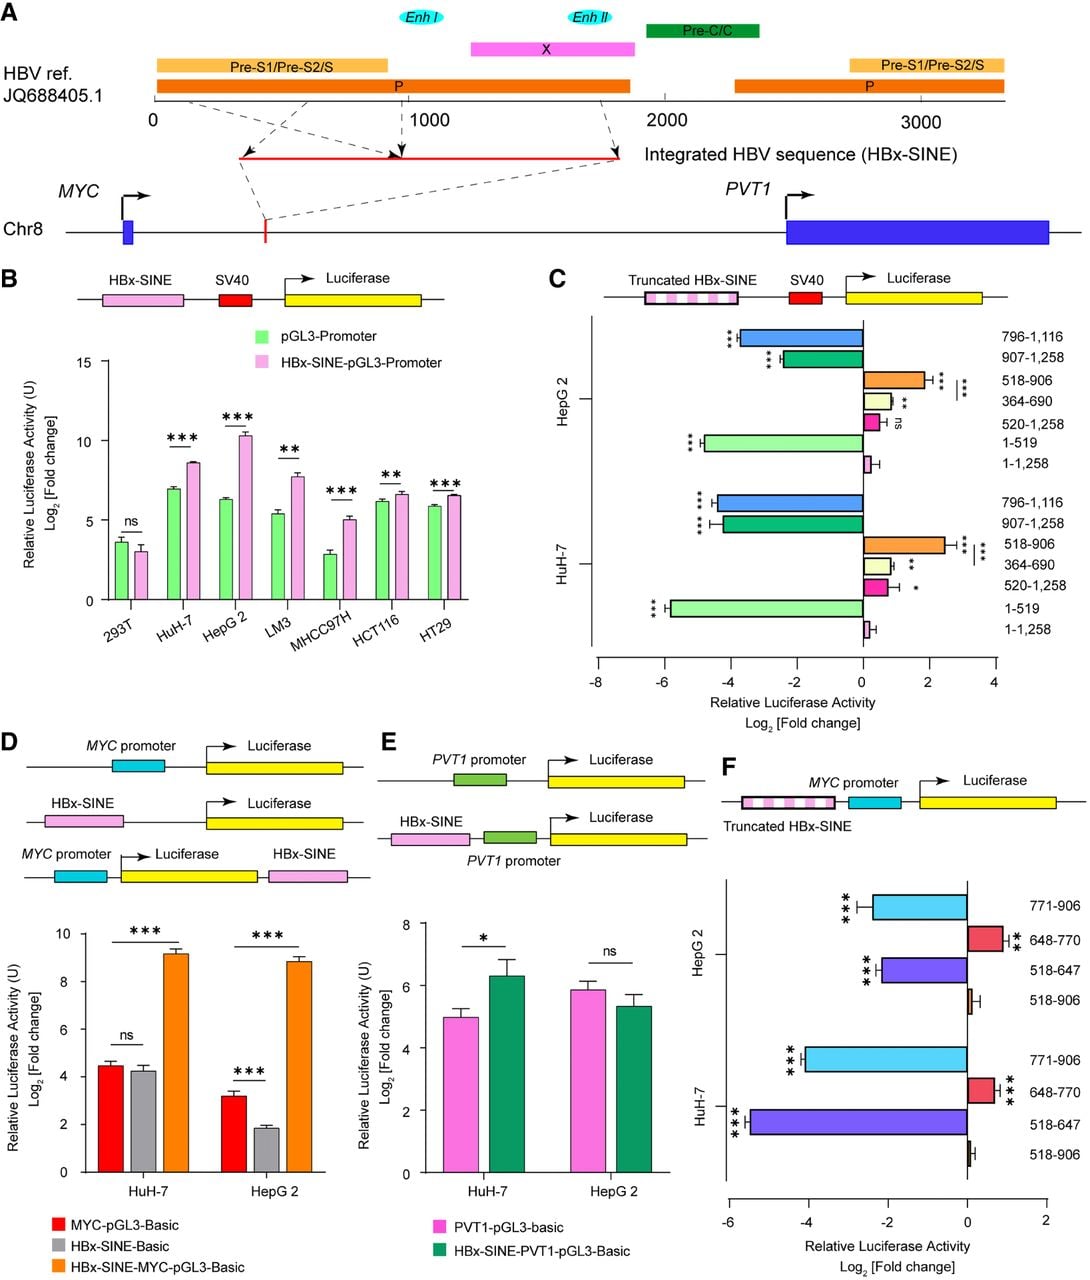
Cis-activation role of HBV-Enh I. (A) Schematic representation of the HBV integration locus and the constitution of the integrated HBV sequence (HBx-SINE). (B) Relative luciferase activity of HBx-SINE-pGL3-promoter constructs in cell lines Hep G2, HuH-7, HCCLM3, MHCC97-H, HT-29, HCT 116, and 293T. (C) Relative luciferase activity of truncated HBx-SINE-pGL3-promoter constructs in cell lines HuH-7 and Hep G2. (D,E) Schematic of pGL3 plasmids harboring the MYC promoter or PVT1 promoter (top) and the relative luciferase activities of the constructed plasmids in the HuH-7 and Hep G2 cell lines (bottom). (F) Schematic of pGL3 plasmids harboring truncated HBx-SINE sequences and the MYC promoter (top) and the relative luciferase activity of the constructed plasmids in the HuH-7 and Hep G2 cell lines (bottom). The error bars correspond to the SDs of three independent transfections for each plasmid. The data are presented as the mean ± SEM (n = 3). (*) P < 0.05, (**) P < 0.005, (***) P < 0.001; one-way ANOVA.