
Mutation Detection by Ligation to Complete n-mer DNA Arrays
Abstract
A new approach to comparative nucleic acid sequence analysis is described that uses the ligation of DNA targets to high-density arrays containing complete sets of covalently attached oligonucleotides of length eight and nine. The combination of enzymatic or chemical ligation with a directed comparative analysis avoids many of the intrinsic difficulties associated with hybridization-based de novo sequence reconstruction methods described previously. Double-stranded DNA targets were fragmented and labeled to produce quasirandom populations of 5′ termini suitable for ligation and detection on the arrays. Kilobase-size DNA targets were used to demonstrate that complete n-mer arrays can correctly verify known sequences and can determine the presence of sequence differences relative to a reference. By use of 9-mer arrays, sequences of 1.2-kb targets were verified with >99.9% accuracy. Mutations in target sequences were detected by directly comparing the intensity pattern obtained for an unknown with that obtained for a known reference sequence. For targets of moderate length (1.2 kb), 100% of the mutations in the queried sequences were detected with 9-mer arrays. For higher complexity targets (2.5 and 16.6 kb), a relatively high percentage of mutations (90% and 66%, respectively) were correctly identified with a low false-positive rate of <0.03 percent. The methods described provide a general approach to analyzing nucleic acid samples on the basis of the interpretation of sequence-specific patterns of hybridization and ligation on complete n-mer oligonucleotide arrays.
The goal of genome sequencing projects is to obtain the complete sequence of a reference genome. The next, and perhaps more difficult, step is to analyze sequence variation and relate this information to important phenotypes. High-density oligonucleotide arrays (Fodor et al. 1993; Pease et al. 1994) offer a highly parallel and scalable approach to large-scale nucleic acid sequence analysis (Lipshutz 1993). The utility of DNA arrays for genetic analysis has been demonstrated previously in numerous applications including mutation detection, genotyping, physical mapping, and gene-expression monitoring (Chee et al. 1996; Cronin et al. 1996; Kozal et al. 1996;Lockhart et al. 1996; Wodicka et al. 1997).
Most of the oligonucleotide arrays used successfully to date have employed sets of oligonucleotide probes specifically chosen on the basis of predefined reference sequences. A more general approach to array-based sequence analysis is to use complete sets of oligonucleotides of a given length so that, in principle, any target sequence can be queried. Various theoretical proposals have been put forth describing DNA sequence reconstruction on the basis of hybridization to complete sets of n-mer probes (Bains and Smith 1988; Lysov Iu et al. 1988; Drmanac et al. 1989). However, none of these de novo sequencing approaches have been successfully implemented in large part because of the following factors: (1) unrealistic assumptions about the thermodynamics of hybridization to short oligonucleotides; (2) reconstruction ambiguities resulting from sequence repeats and a lack of n-mer uniqueness in a complex DNA sample; (3) a general lack of experimental data on which to base practical methods of sequence reconstruction; and (4) a shortage of computational and analysis methods that can handle inevitably imperfect hybridization data.
To avoid some of the inherent difficulties of sequencing by hybridization methods while retaining the advantages of completen-mer arrays, we have focused on mutation and polymorphism (sequence difference) detection rather than de novo sequence reconstruction. Furthermore, to increase probe-target affinity, signal intensity, and mismatch discrimination, we have used a step in which target DNA molecules are ligated to arrayed duplex probes rather than relying on hybridization alone (Broude et al. 1994). Following ligation of fluorescently labeled DNA fragments to the arrays, the complex patterns are not analyzed de novo, but rather in the context of an appropriate reference sequence. The use of a reference sequence provides a framework for choosing the appropriate probes for querying an unknown sample for minor sequence variations (e.g., substitutions, insertions, and deletions). The ligation patterns are then analyzed in the context of a series of query probe sets analytically extracted from the complete n-mer set. These sets are referred to as virtual tilings, and are conceptually similar to the physical tilings present on sequence-specific arrays (Chee et al. 1996). Sensitive and accurate sequence difference detection was accomplished by a direct comparison of the virtual tilings generated from the ligation patterns of an unknown and a reference sample applied to separate arrays.
RESULTS
Design of a Duplex-Probe n-mer DNA Array
The length and complexity of a DNA fragment that can be successfully interrogated on an array of n-mer probes is expected to scale linearly with the length of the probes (Belyi and Pevzner 1997), whereas the number of probes comprising a complete n-mer set increases exponentially with probe length (4n). For practical reasons, the total number of probes that can fit on an array is limited, necessitating the use of relatively short probes. At present, arrays containing all 49 9-mer probes can be routinely synthesized on a glass surface in an area of 1.28 × 1.28 cm.
The hybridization limitations imposed by short probes were overcome by designing duplex probes with 5′-n-mer overhangs capable of ligating to target DNA molecules (Fig. 1A). The orientation of the duplex probes is such that only the 5′-phosphoryl termini of the DNA molecules will ligate to the recessed 3′-hydroxyl moieties of the probes (3′ phosphoryl in chemical ligation). With this approach, only the n bases at the extreme 5′ terminus of each DNA fragment are interrogated by the array.
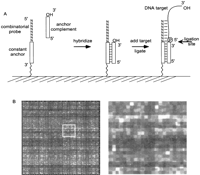
Design and synthesis of complete n-mer arrays. (A)N-mer arrays containing duplex probes suitable for ligation to target DNA molecules were created as follows: The array-based probes contained a 20-base constant anchor sequence and an n-base combinatorial sequence. A 20-mer complementary oligonucleotide was hybridized to the constant anchor sequence of the probes generating duplex probes with 5′ n-mer overhangs. The duplex probe acts as a template to direct the ligation of 5′-phosphoryl DNA molecules. (B) One quadrant of an 8-mer array showing the probe intensity pattern generated by chemical ligation of a 1.2-kb HIV DNA target. An expanded view is also shown to better illustrate the individual probe features.
Preparation and Ligation of dsDNA Targets to n-mer Arrays
Target DNA was fragmented with DNase I to create a quasirandom population of 5′ phosphoryl terminal subsequences representative of the entire target sequence. The 3′-hydroxyl termini of these fragments were end labeled with terminal dideoxynucleotidyl transferase (TdT) and ddATP-N6-biotin. Fragmented and labeled targets were ligated to 8- or 9-mer arrays with enzymatic (T4 DNA ligase,Escherichia coli DNA ligase, or Taq DNA ligase) or chemical ligation. In all cases, the presence of DNA ligase or chemical ligation reagents was found to be essential for generating sufficient levels of fluorescent signal on the array. An example of probe intensity patterns after chemical ligation on an 8-mer array is depicted in Figure 1B. The ligation step also obviated the need to carefully monitor wash conditions because the ligated duplex structures were extremely stable even under stringent wash conditions.
Method for Sequence Verification by Virtual Tiling Analysis
A set of probes complementary to a given reference sequence along with sets of related query probes can be used to interrogate a DNA target for sequence differences. This principle has been used to design sequence-specific mutation detection or resequencing arrays in which sets of four probes (referred to as a base-call set) are used to query each position within the sample target (Chee et al. 1996). The four probes are identical except at a single position, termed the substitution position, where each probe has a different base, A, C, G, or T. For targets containing only single-base substitutions, one of the four probes will be a perfect match to the target sequence, whereas the other three will have a single-base mismatch. The base-call set can also be expanded to include insertion and deletion probes. By this approach, the entire target can be resequenced by stepping through and querying the target bases with a series of overlapping base-call sets (called a tiling) derived from the reference sequence.
This tiling principle can be used to detect mutations in a target of almost any sequence composition by use of an appropriate reference sequence to electronically extract and analyze tiling probe subsets of the complete n-mer set. This is illustrated in Figure2A, in which a single position (77) within a 535-bp PCR product from the cystic fibrosis transmembrane conductance regulator (cftr) gene (Gunderson and Kopito 1995) is interrogated by a set of eight overlapping base-call sets, each employing a different substitution position (1–8).
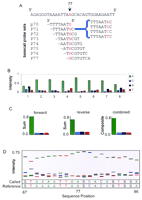
Construction of base-call sets from 8-mer array data by use of a reference sequence. (A) A portion of a 535-bp cftrreference sequence (forward strand) is shown along with the sequences of overlapping probe sets interrogating position 77 within this sequence. A set of four probes differing by a single-base substitution (indicated by red letter N) constitute a base-call set (an example is bracketed). (B) The intensities of the probes within each base-call set are extracted from the array data and plotted. The probes are enumerated such that an A probe actually contains the complementary T base substitution for forward strand interrogations and an A base for reverse strand interrogations. (C) Summation of the interrogation probes (A, C, G, T) across all eight base-call sets yields a summed base-call set for both the forward and reverse strands. A final composite base-call set is derived from these summed sets, from which a final base call is made. (D) A sequence trace is constructed by plotting the normalized intensity values for each composite base-call set as a function of sequence position. Positions 67–86 are plotted for the 535-bp cftr target. The Called bases were generated by our base-calling algorithm using array data, whereas the Reference bases are from the actual sequence of the reference sample.
Base-Calling Accuracy
The called base at any position is determined from an analysis of the signal intensities of the probes within a base-call set. The existence of n different base-call sets for each position allows n-independent base calls to be made for each target site. This redundancy can be reduced to a single consensus base call either by a majority vote or by computing a composite base-call set by summing the intensities across the n base-call sets such that the A substitution probes are summed, as are those for the C, G, and T probes. Selecting the highest summed intensity from among the A, C, G, and T composite intensities creates a final base call. In practice, the intensities are normalized prior to summation (see Methods) to prevent a given base-call set from overly biasing the composite sum. For position 77 of the cftr sequence, the highest intensity values within each base-call set are from A-interrogation probes and generate an A base call for that position (Fig. 2B,C). Furthermore, summation of these eight base-call sets for each strand generates a composite base-call set also yielding a final A base call (Fig. 2C). A second degree of redundancy is achieved by analyzing both the forward and reverse strands of double-stranded DNA targets and combining the results into a final base-call determination (Fig. 2C).
The above example illustrates a target site concordant in all its redundant base calls, however, this is not always the case. As seen in the analysis of a 1.2-kb PCR fragment of the HIV-1 pol gene (Kozal et al. 1996), the first two base-call sets interrogating position 435 generate calls discordant with the other six (reference panel in Fig. 4B, below). Nonetheless, the correct base call is deduced by a simple majority vote or from the composite base-call set (Fig 4C, below). This integration of redundant probe information contributes greatly to the overall base-calling accuracy through its averaging effect. It should be noted that the reason the first two base-call sets (shown in the reference panel of Fig. 4B, below) miscall the interrogated target base is that the C-query probes (mismatch) are perfect match probes to the target at another location. In general, as target complexity increases, the probability that a given probe interacts with multiple target sites increases, leading to a decrease in base-calling accuracy.
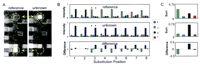
Mutation detection by comparing base-call sets. Two 1.2-kb HIV amplicons differing by eleven single-base substitutions were used as targets. Standard T4 DNA ligation conditions and 8-mer arrays were used for the assay. (A) A small portion of the array images for the reference target (left) and unknown (right) target are shown. The circled probes (interrogating position 435) on each array differ by a single-base substitution at position 3. These probes are indicated by asterisks in B. (B) The normalized intensities of the eight base-call sets interrogating position 435 are shown for both the reference and the unknown target. The intensity differences between these base-call sets are also shown. Note the discordance of the first two base-call sets with the other six sets for the reference target. (C) The composite base-call sets (both strands combined) for the reference and unknown targets and their arithmetic difference (I unknown–I reference) is shown. An A → G substitution at position 435 can be inferred from these data.
As a convenient way to display base-calling information, we formed a sequence trace by plotting the composite base-call set intensities as a function of sequence position (Fig. 2D). This format resembles the familiar sequence trace generated by conventional gel-based dye-terminator sequencing. In addition to providing base-calling information, the quality of a base call can be readily appreciated by examining such a trace. An example of a target region exhibiting low quality base calls (inadequate separation between intensity values) is demonstrated by the sequence trace for an AT-rich region within the HIV target sequence (Fig. 3A).
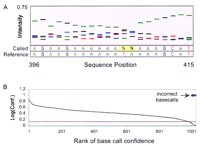
Base-call quality and confidence thresholds. (A) A sequence trace from an AT-rich region of a 1.2-kb HIV target is shown. Ann base represents a no call (1.15 threshold). The data were generated by standard T4 DNA ligation conditions on an 8-mer array. (B) The base calls for a 1041-bp stretch of the HIV target were ranked and sorted by their confidence score. Incorrect base calls are indicated by a diamond symbol arbitrarily assigned a value of one for pictorial purposes. The red line indicates the confidence threshold of 1.15. The incorrect calls cluster at the lowest confidence scores.
A quantitative measure of base-calling quality can be achieved by calculating a confidence score defined as the ratio of the largest intensity probe to the next largest intensity probe within a composite base-call set. By use of this measure, most incorrect calls were characterized by low confidence scores (Fig. 3B). This observation allowed a cutoff threshold to be defined such that base calls with confidence scores below this threshold were labeled as no calls (N) (see Fig. 3A). We determined empirically that calls made with a confidence score above 1.15 were typically 100% correct for targets up to 1.2 kb in length (Fig. 3B; Table 1). Therefore, all subsequent base-call analyses used this confidence threshold.
Base-Call Accuracy as a Function of Target Complexity, Probe Length, and Ligation Method
The ability of n-mer arrays to accurately resequence targets was assessed by analyzing DNA samples with their known sequence as the reference. It is expected that as the length of the DNA target increases, the corresponding base-calling accuracy should decrease, and as the probe length increases, the accuracy should increase as well. To investigate these issues, we examined DNA sequences of different lengths applied to both 8- and 9-mer probe arrays using enzymatic and chemical ligation. A variety of sequences were analyzed, including a 535-bp PCR product from the human cftr gene; a 1.2-kb PCR product from HIV-1 pol gene; a 2.5-kb PCR fragment spanning the mitochondrial cytochrome b gene and control region (Chee et al. 1996); and the 5.4-kb genome of the bacteriophage φX174.
As expected, target length and probe length significantly affected the base-calling accuracy. However, the mode of ligation had only a modest effect, with enzymatic ligation producing a slightly higher base-calling accuracy than chemical ligation (Table 1). Our results show that as target length increased, base-calling accuracy decreased from 100% (with 9-mers) at 535 bp to 89% at 5.4 kb (Table1). By use of a confidence threshold, the number of incorrect base calls was kept to a minimum. In the case of the 5.4-kb target called at 89% accuracy, the remaining 11% of the base calls consisted of 10.6% no calls and only 0.4% incorrect calls (false-positives). Moreover, for the 89.4% (89.0% + 0.4%) of the bases actually called, the correct call rate is 99.4% (100% × 89.0/89.4). Thus, the classification of base calls into call/no call categories greatly increased the usefulness of this base-call information. In general, the decrease in base-calling accuracy with increasing target length is primarily due to no calls resulting from a lack of probe uniqueness. Increasing the probe length drastically reduces the number of no calls and leads to a much higher base-calling accuracy (Table 1, cf. 8- vs. 9-mer data).
Comparison Analysis for Mutation Detection
A more robust approach to mutation detection on n-mer arrays is to perform a direct comparison of sequence traces derived from a reference target ligated to one array and an unknown sample target ligated to a second array. This comparison process subtracts out potentially confusing signals resulting from systematic and reproducible cross-hybridization and multiple probe-target interactions. To test this approach, we compared the sequence traces generated from two different 1.2-kb HIV targets (a reference and an unknown) ligated to separate 8-mer arrays. The comparison was accomplished by computing the arithmetic difference between composite base-call sets for each reference base (see Fig. 4). An analysis example is shown for the eight base-call sets interrogating position 435 within the reference sequence. The intensities of the G-query probes increased and the A-query probes decreased (unknown relative to reference) indicating an A → G base substitution (Fig. 4B,C). Moreover, the success of this difference analysis is seen by the removal of systematic base-calling error generated by the first two base-call sets.
The presence of a mutation in a target is easily visualized as a broad (10- to 14-base) footprint encompassing the mutation site (Fig. 5, cf. A and B with C). This footprint results from a single base change affecting overlapping probes upstream and downstream of the mutation site (when both strands are used). A further visual simplification can be realized by plotting just the positive and negative envelopes of the difference trace and noting the corresponding bases with the maximum positive score and maximum negative score (Fig.5D). This type of plot is referred to as a substitution mutation scan. In the HIV example shown (Fig. 5D), 11/11 mutations were correctly identified by the mutation scan with no false-positives. A potential false-positive mutation was observed as a narrow footprint at position 770 (denoted by an asterisk), however this footprint fell below the preselected threshold, and more importantly, the footprint did not exhibit the broad profile characteristic of an actual mutation.
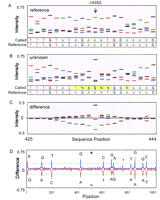
Mutation scanning. A sequence trace (positions 425–444) is displayed for both the (A) reference and the (B) unknown HIV targets described in Fig. 4. The positions highlighted in yellow indicate a base call that is different from the reference sequence (an N base denotes a no call). (C) The arithmetic difference between the traces displayed in A and B. The A435G single-base substitution in the unknown target is identified by the footprint in the difference trace. (D) The positive and negative envelope curves of the difference trace are plotted for 1041 bases of the HIV sequence. Eleven single-base substitutions were correctly identified by their footprint (G14A, A128G, C206T, A435G, T614C, A679G, G693A, A832T, A865G, A927G, T955C). The asterisk denotes a potential mutation, but it is ignored because its footprint is less than the call threshold (broken green line) and its footprint width is narrow.
Next, we examined whether sequence differences between a more diverse set of targets could be detected. A mutation scan of a second 1.2-kb HIV variant sample containing 27 single base substitutions was performed. On an 8-mer array, 96.3% (26/27, 1 false-positive) of the mutations were detected, and on a 9-mer array, 100% (27/27, 1 false-positive) of the mutations were detected. It should be noted that as the interrogated target sequence diverges from the reference sequence, the probability of a false-positive increases because of the greater number of probes affected by the base changes. These results indicate that kilobase-sized targets differing by as many as 1 in 40 bases can be accurately resequenced with this approach.
Next, we examined the sensitivity of mutation detection for longer DNA targets. We screened eight different 2.5-kb human mitochondrial cytochrome b amplicons for 176 known sequence differences. By use of 8-mer arrays, >90% (160/176) of the sequence differences were correctly identified, with a low false-positive rate of <1 per 3900 bases (<0.02%). Without the comparative approach, the false-positive rate was considerably higher (∼1%–2%). As expected, false-negatives (undetected mutations) usually occurred in target regions generating low probe signal intensities (e.g., AT-rich regions) or in regions containing repeat sequences. The maximum target length that can be effectively screened with this approach depends on a tradeoff between the number of tolerated false-positives (incorrectly identified as a mutation) and false-negatives (undetected mutations). For purposes of mutation discovery, an 8-mer array can be used to scan targets 2.5 kb in length with high sensitivity (typically >90%) and a minimal number of false-positives (fewer than one per 3900 bases).
The possibility of screening even longer pieces of DNA was explored by use of the entire 16.6-kb human mitochondrial genome. Two 16.6-kb targets consisting of three overlapping PCR amplicons from two different individuals were used. To improve sequence resolution, the prepared targets were ligated to 9-mer arrays. The mutational screen identified >66% (16/24) of the known sequence differences with a low false-positive rate of 4 per 16,600 bases (0.024%). These results suggest that comparative resequencing on complete n-mer DNA arrays can be used to rapidly screen very complex DNA samples for mutations.
Detection of Insertions/Deletions and Heterozygous Mutations
Complete n-mer arrays, in principal, can be used to detect almost any type of mutation because a perfect match probe is present for every conceivable sequence variation. To explore this idea, we expanded the set of queried mutations by forming base-call sets of insertion and deletion tiling probes. The difference analysis was performed for insertions and deletions similar to the analysis of substitutions. We screened an unknown homozygous p53 (11 exons) sample (applied to one array) by comparing it with a wild-type p53 reference sample (applied to a second array). In addition to searching for novel mutations, this experiment also demonstrates the feasibility of screening multiple amplicons in a single array assay. Mutation scans were performed for substitution, deletion and insertion probe sets. These scans readily identified a G → C substitution in exon 4 and a C insertion in exon 5 (Fig. 6A,B). The presence of footprints in both the substitution scan and the insertion scan of exon 5 led to difficulty in deciding which type of mutation was present. However, previous analysis of HIV samples containing single-base substitutions indicated that authentic substitution mutations typically did not display footprints in insertion or deletion scans. Thus, the observation of an insertion footprint in the exon 5 scan strongly supports the insertion call, which was confirmed by conventional sequencing.
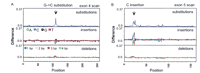
Detection of an insertion in the p53 gene. Eleven exons of the p53 gene were simultaneously scanned (∼1700 bases including primers) byTaq DNA ligation to 8-mer arrays. Two individual samples (11 exons each) were applied to separate arrays with one sample used as a wild-type reference and the other the unknown. Mutation scans searched for substitutions, single-base insertions (A, C, G, T) and multiple-base deletions (1, 2, 3, and 4 bp). (A) A substitution scan (positive envelope) of exon 4 revealed a mutation footprint that correctly identified a G → C base change. The other scans have no appreciable footprints. (B) Mutation scans of exon 5 exhibit footprints in both the substitution (positive envelope) and insertion scans. The insertion scan identified the mutation as a C insertion (increase in the complementary G insertion probes) in the unknown target, whereas the substitution scan provided an ambiguous identification. This insertion was confirmed by conventional sequencing. Normalization of the insertion (A, C, G, T) and deletion probes (1, 2, 3, and 4 bp) was accomplished as for the substitution probes by setting the sum of the four probe intensities to unity.
Next, we investigated the ability of 8-mer arrays to detect homozygous and heterozygous mutations in cftr amplicons (∼1.1 kb) containing a known ΔF508 deletion (3 bp). A wild-typecftr sample was used as the reference. The ΔF508 deletion was readily detected in the homozygous sample by the presence of a footprint in the perfect match (PM) reference probe scan (a scan of the difference in perfect match reference probes), substitution scan and deletion scan (Fig. 7A). As expected, detection of the heterozygous deletion was more difficult. In this case, no footprint was seen in the PM reference probe scan because DNA with the reference sequence is present in both samples that are being compared (Fig. 7B). However, the deletion scan still exhibited a well resolved footprint, because target containing deleted sequence is present in the heterozygous sample but completely absent from the reference sample.
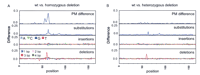
Detection of the ΔF508 deletion in the cftr gene. Wild-type and mutant samples of a 1029-bp region (encompassing F508) of the cftr gene were applied to 8-mer arrays by standard T4 DNA ligation conditions. (A) Mutation scans of a 170-bp region comparing a wild-type cftr target to a target containing a 3-bp ΔF508 (TTT) homozygous deletion. Mutation scans are shown for perfect match (PM) reference, substitution (positive envelope only), insertion, and deletion probes. The PM reference probes (a subset of the substitution probe set) consist of a tiling probe set complementary to the reference sequence. A 3-bp deletion (identified as TTT by the analysis software) was readily detected by the deletion scan. Note that the substitution scan also exhibited a footprint. (B) Mutation scans comparing a wild-type cftr target to a 3-bp ΔF508 artificial heterozygous deletion mutant (mixture of 50% wild-type and 50% homozygous mutant). No footprint was detectable in the PM reference probe scan because DNA with the wild-type reference sequence was present in both samples. However, the deletion scan correctly identified a 3-bp TTT deletion in the heterozygous sample.
Sequence-Specific 5′ End Sampling
Fragmentation of DNA targets with a site-specific DNA nuclease, rather than DNase I, produces a population of fragments representing only a small subset of all possible 5′-terminal subsequences. We examined whether this limited number of newly created 5′-termini subsequences could be detected on an 8-mer array. To test this approach, we digested φX174 (∼5.4 kb) with the restriction endonucleases, PalI (GG ↓ CC) and NlaIII (CATG↓), and ligated this fragment population to an 8-mer array. Our results indicated that 32 of 33 restriction sites were detected (data not shown), indicating that n-mer arrays can be used to identify 5′ termini in a complex sample. Potential applications include the analysis of DNA fragments generated by random or directed genomic sampling strategies such as DNA fingerprinting or differential display (Liang and Pardee 1992; Southern 1995).
DISCUSSION
The results presented demonstrate the feasibility of scanning complex DNA targets for mutations by use of ligation to completen-mer oligonucleotide arrays. We found that ligation was necessary for both the generation and stabilization of signals on the array. Our approach to mutation detection used a reference sequence as a basis to choose the appropriate perfect match, substitution, insertion, and deletion probes for interrogating an unknown sample (usually a minor sequence variant of the reference sequence). However, unlike sequence-specific DNA resequencing arrays described previously, in which interrogation probes are prechosen prior to synthesis on the array (Chee et al. 1996), mutation detection with completen-mer arrays is accomplished by electronically assembling the appropriate interrogation probes from the complete n-mer probe set. This design creates multiple probe interrogations for every target base, generating redundant base-call sets that can be integrated through a simple normalized summation (averaging) process. This information is conveniently displayed in a sequence trace from which a base call can be made and call quality assessed. If the base-call quality score is below a defined confidence threshold, the base call is assigned a no call status (N). In this way, only highly confident base calls appear in the final called sequence. The end result of this averaging and scoring process was that complex DNA targets were verified with a high degree of accuracy despite less than perfect ligation discrimination.
A direct comparison of sequence traces between samples provided a more sensitive and accurate method of mutation detection. This comparative approach substantially reduced the false-positive rate (number of incorrect calls), increased the sensitivity of heterozygous mutation detection, and allowed complex DNA targets to be screened. Unanticipated insertions and deletions were readily detected, and an approach for identifying heterozygous mutations by their base-calling trace was presented.
We have found that mutation scanning on complete n-mer arrays offers the following advantages: (1) complex DNA targets (up to 2.5 kb on 8-mers) can be screened with high accuracy (>90% mutation detection), (2) mutations can be located and identified, (3) multiple target amplicons can be simultaneously screened (e.g., multiple exons of a gene), and (4) the technique is rapid and robust. With respect to “gold standard” Sanger sequencing, resequencing on 9-mer arrays offers longer read lengths (1.2 kb) with high accuracy (99.5%–99.9%) and allows the possibility of analyzing multiplexed reactions. Moreover, by comparing the hybridization patterns between two arrays, even longer targets can be analyzed for mutations. With specifically designed DNA arrays with longer probes, as much as 50 kb of sequence can be scanned on a single array (Chee et al. 1996; J.-B. Fan, unpubl.); the drawback, however, is the requirement for a specialized photolithographic mask for each set of sequences analyzed.N-mer arrays are limited to much shorter target lengths but offer the flexibility of using a single chip design for almost all sequences. In addition to sequence checking and mutation detection, a number of other applications can be envisioned in which nucleic acid targets are queried by use of ligation to n-mer arrays. The fact that arrays of duplex probes with recessed 3′ termini selectively interrogate only 5′-phosphoryl-containing terminal subsequences may allow interrogative approaches to be devised on the basis of the ability of the n-mer array to separate or identify fragments by their 5′-terminal subsequence. Such an approach may be applied to analyzing the products generated by DNA fingerprinting, nucleic acid scanning (AFLP, RAPD, AP-PCR, DAF, etc.), enzymatic and chemical mismatch cleavage, and differential gene expression assays (e.g., differential display, SAGE, etc.) (Southern 1995; Caetano-Anolles 1996).
Future improvements in probe synthesis technology and target preparation should increase the performance of n-mer arrays. Several obvious areas of improvement include synthesizing arrays with longer probes (e.g., 10-mers and longer), increasing mismatch discrimination, and increasing weak probe intensities. Factors that contribute to low probe intensities include nonuniform target fragmentation, probe–probe interactions, and low probe-target hybrid stability. Nonuniform target fragmentation by DNase I has been observed with a 10- to 20-fold difference in sequence-dependent cleavage rates (Herrera and Chaires 1994). This suggests that certain 5′ subsequences will be under-represented in the target fragment population, and that using a cocktail of different nucleases might improve results. Interactions between surface-bound probes are suggested by the fact that self-complementary and G-rich probes exhibit unusually low intensities (Sen and Gilbert 1992; Chee et al. 1996;Lockhart et al. 1996). Decreasing surface probe density or incorporation of novel base analogs could help reduce these effects. Finally, the most important factor contributing to low probe intensities is the sequence-dependent instability of certain probe-target duplexes, particularly evident in AT-rich target regions. Incorporation of base analogs into both the target and the probes may also help ameliorate this problem.
We have shown that complete n-mer arrays provide a rapid, sensitive, and robust method of detecting sequence differences, and as such should help contribute to the growing field of genome variation studies. Additionally, the technique of ligating DNA samples ton-mer arrays provides a general framework for the development of alternative methods to the traditional gel-based analysis of complex nucleic acid samples.
METHODS
Synthesis of Duplex-Probe n-mer DNA Arrays
Complete n-mer DNA oligonucleotides were synthesized on derivitized glass substrates by light-directed photochemistry as described previously (Pease et al. 1994); 8-mer arrays were synthesized with 50 × 50-μm probe feature sizes, and 9-mers with 25 × 25 μm probe feature sizes. Prior to photochemical synthesis, a DMT-hexaethyleneglycol-(2-cyanoethyl-N,N-diisopropyl) phosphoramidite linker (ChemGenes, 25 mm in acetonitrile) and 19 bases of a constant anchor oligonucleotide (3′-ATACGTAGACACTGCTGGAC-5′) were synthesized on the array using conventional DMT PAC phosphoramidites (25 mm in acetonitrile): T b-cyanoethyl, IBU dC b-cyanoethyl, PAC dA b-cyanoethyl, and iPr-PAC dG b-cyanoethyl phosphoramidites (Pharmacia Biotech). The last base of the anchor oligonucleotide and the subsequent n (n = 8 or 9) combinatorial bases were synthesized by light-directed photochemistry (Pease et al. 1994). Following synthesis of these n bases, 2 bases of inosine (2′-deoxyinosine, Glen Research, Sterling, VA) were added to the 5′ terminus by use of conventional DMT phosphoramidite chemistry. The addition of two inosines was found to improve overall array signal intensities without greatly affecting discrimination. Postsynthesis, the DNA molecules on the arrays were deprotected in a 50% ethylenediamine (EDA)/50% ethanol bath for ∼10 hr.
A 20-mer anchor oligonucleotide (5′-psoralen-TATGCATCTGTGACGACCTG-3′) complementary to the constant anchor sequence of the probe was synthesized with a standard oligonucleotide synthesizer. Two versions of the oligonucleotide were synthesized for the different modalities of ligation: a 3′ hydroxyl version for enzymatic ligation and a 3′ phosphoryl version for chemical ligation. The anchor oligonucleotide also contained a AT dinucleotide pair and a psoralen C6 (Glen Research) moiety at the 5′ end for use in an optional cross-linking protocol. The oligonucleotide was cartridge purified via the hydrophobic 5′ psoralen moiety. Since completion of the studies in this paper, anchor oligonucleotides with different 3′-terminal bases (the corresponding probe anchor sequence was also modified) were tested for their ability to improve signal and discrimination. In general, anchor oligonucleotides with A and G (purines) 3′ bases generated higher signal intensities than oligonucleotides with C and T (pyrimidines) 3′ bases. Anchor oligonucleotides with terminal G 3′ bases were used for all experiments in this paper.
The actual array-based duplex probes were created by hybridizing the complementary 20-mer anchor oligonucleotide (500 nm) to the constant portion of the array-bound probes. The hybridization conditions were as follows: 6× SSPE buffer (pH 7.4) at 40°C for 1–2 hr followed by washing on a GeneChip fluidics station (Affymetrix, Inc.) with 6× SSPE at 22°C. Under the ligation conditions used in this paper (30°C–40°C), psoralen cross-linking was unnecessary for maintenance of duplex stability. However, for other applications, cross-linking can be accomplished by exposing the duplex-probe array (1× SSPE buffer present, array sitting on ice) to long wavelength UV light, wherein the intercalated psoralen moiety cross-links the two thymidine bases located on opposing DNA strands (Bornet et al. 1995). The optimal UV exposure was 6 J/cm2 of 365 nm (long UV) applied to the outer glass surface of the DNA array.
Preparation of Fragmented DNA Samples
Double-stranded DNA targets (∼50–100 fmoles, ∼80–160 ng of a 2.5-kb target) were randomly fragmented with DNase I (0.5 units per 20 μl) in 1× One-Phor-All Buffer Plus (Pharmacia, 10× buffer contains 100 mm Tris-acetate (pH 7.5), 100 mmmagnesium acetate, 500 mm potassium acetate) for 15 min at 37°C. DNase I was heat inactivated and the sample denatured by incubation at 95°C for 15 min. The sample was cooled on ice, and 3′-end labeled with TdT (5 units per 20 μl) (GIBCO-BRL, Gaithersburg, MD) and ddATP-N6-biotin (25 μm) (NEN Life Sciences, Boston, MA) at 37°C for 60 min. TdT was heat inactivated and the DNA denatured by incubating at 95°C for 10 min. The denatured DNA was cooled on ice, added to the ligation mix (total volume of 200 μl, final DNA target concentration of ∼500 pm), spun at 14,000g in a microcentrifuge for 3 min to pellet any precipitate present, and applied to the DNA array. The ligation solution was continuously mixed across the surface of the array by rotation (40–50 rpm) on a rotisserie located in an incubator set to the desired temperature.
Preparation of Restriction-Digested DNA Samples
The PalI–NlaIII restriction digestion of φX174 was performed on DNase I fragmented (high Mn2+) φX174 to decrease the average fragment size (increases hybridization kinetics). We used the following protocol: 500 ng of φX174 was digested for 10 min at 37°C by 0.010 units of DNase I in 10 μl of Mn digestion buffer [20 mm Tris-Cl (pH 8.0), 2.5 mm MnCl2, 100 μmCaCl2]. The DNase I was removed by addition of 1 μl of Advamax protein removal beads (Advanced Genetics Technologies Corp.). The sample was then spun for 1 min at 14,000g, and the supernatant collected. Next, the fragmented DNA sample (in 10 μl) was dephosphorylated by addition of 1 μl of One-For-All buffer and treatment with 5 units of shrimp alkaline phosphatase (U.S. Biochemical) for 30 min at 30°C. The phosphatase was removed by protein removal beads as described. The DNA sample was next digested with 5 units of PalI and 5 units of NlaIII (in 10 μl) by incubation at 37°C for 30 min. The sample was heat denatured at 98°C for 10 min, cooled on ice, and labeled with TdT as described above.
Ligation Conditions
In general, we found that both enzymatic and chemical ligation produced satisfactory results when used according to the specified protocols. The enzymatic ligation conditions are given for the following enzymes: T4 DNA ligase, E. coli (NAD dependent) DNA ligase, and Taq DNA ligase. The standard T4 DNA ligation buffer consisted of the following: 50 mm Tris-HCl (pH 7.8), 10 mm MgCl2, 10 mm DTT, 1 mmATP, 50 μg/ml BSA, 100 mm NaCl, 0.1% TX-100 and 2.0 U/μl T4 DNA ligase (New England Biolabs). E. coli DNA ligase buffer consisted of 40 mm Tris-HCl (pH 8.0), 10 mm MgCl2, 5 mm DTT, 0.5 mmNADH, 50 μg/ml BSA, 0.1% TX-100, and 0.025 U/μl E. coli DNA ligase (Amersham). Taq DNA ligation buffer consisted of the following: 20 mm Tris-HCl (pH 7.6), 25 mm potassium acetate, 10 mm magnesium acetate, 10 mm DTT, 1 mm NADH, 50 μg/ml BSA, 0.1% Triton X-100, 10% PEG, 100 mm NaCl, and 1.0 U/μl TaqDNA ligase (New England Biolabs). For both 8-mer and 9-mers, T4 andE. coli DNA ligase reactions were performed at 30°C, andTaq DNA ligase reactions were performed at 37°C–40°C (due to the low activity of Taq at 30°C). The ligation reactions were typically incubated overnight (14–16 hr), but incubations as short as 2 hr also gave satisfactory results.
Chemical Ligation
Chemical ligation allowed the use of 3–4 mtetramethylammonium chloride (TMACl) in the ligation buffer to help normalize the intensities of A/T-rich and G/C-rich probes (Wood et al. 1985). The chemical ligation reaction used freshly dissolved 1-ethyl-3-(3-dimethylaminopropyl)carbodiimide hydrochloride (EDC, Pierce Biochemicals) (2 m in H2O for 10× stock) to generate a pyrophosphate bond between a 5′-phosphoryl moiety of the target and a 3′-phosphoryl moiety on the complementary anchor oligonucleotide (Kuznetsova et al. 1994; Hermanson 1996; Shabarova 1988). The chemical ligation conditions were as follows: 50 mm 2-[N-morpholino]ethanesulfonic acid (MES) (pH 6.0 with KOH), 10 mm MgCl2, 0.001% SDS, 200 mm EDC, 50 mm imidazole (pH 6.0 with HCl) and 3.0–4.0 m TMACl (Sigma) for 14 hr at 30°C.
Array Washing and Staining
Following ligation, arrays were washed 5–10 times with 1× SSPE (pH 7.4, 22°C) on a GeneChip fluidics station, stained for 5 min with streptavidin-phycoerythrin conjugate (Molecular Probes, 2 ng/μl in 1× SSPE, 50 μg/ml BSA) on a rotating rotisserie at 22°C and washed another 5–10 times with 1× SSPE.
Imaging and Data Analysis
The fluorescent signal from the array was detected by specially designed confocal scanners (Affymetrix; Chee et al. 1996) which imaged the 8-mer arrays at 6.8–7.5 μm resolution, and imaged 9-mer arrays at 3.5 μm resolution. Images were processed with GeneChip software (Affymetrix), and the resultant intensity data were transformed into text files containing alphabetized lists of probe sequences and corresponding intensities. These data were then analyzed by custom resequencing software written in Visual Basic (v. 4.0, Microsoft).
Data Normalization
The fluorescent intensities were background subtracted and then normalized by dividing the intensity of each probe (all 4n probes) by the sum of the intensities of all related single-base mismatch (MM) probes (24 MM probes for every probe on an 8-mer array) and the intensity of the probe itself. The formula isI norm = I/(ΣI MM + I). This normalization algorithm greatly improved base-calling accuracy by moderating the sequence dependent intensity variation of the probes. Normalization was also performed at the level of the base-call sets such that the sum of the four probes within a base-call set was unity. This prevented any one base-call set from dominating the composite average.
Base Calling, Confidence Scores, and Composite Differences
A base call was performed by comparing the intensities of the four probes (A, C, G, T) within a base-call set, selecting the most intense probe, and calculating the quality score of this base call. The confidence score (quality) of the base call is defined as follows:I most-intense/I next-most-intensefor probes within a base-call set. If this score was below a threshold of 1.15, the base was classified as a no call.
Mutations were typically identified by comparing composite base-call sets from two separate arrays by computing the intensity difference (I unknown,norm–I reference, norm). A mutation scan was created by plotting the envelope curves of the differences in the sequencing or base-call traces. A mutation was identified by detecting a well-defined footprint in this scan. This footprint had to pass two criteria: (1) The magnitude of the footprint had to be greater than a defined threshold typically calculated as five times the mean signal-to-noise ratio of the entire mutation scan, and (2) the width of the footprint had to be greater than at least one probe length (8 or 9 bases).
Acknowledgments
Funding for this work was provided by the National Human Genome Research Institute (grant no. 5 P01 HG01323). We thank Huu Tran for providing the HIV-1 pol gene constructs, Hajime Matsuzaki for the p53 gene amplicons, Naiping Shen for assistance with the human mitochondrial samples. We also thank Steve Fodor for helpful comments on the manuscript, Erik Gentalen for assistance in synthesis of DNA arrays, and Marty Goldberg, Lisa Kajisa, Steve Woodman, David Bayan, and John Nugent for synthesis of DNA wafers.
The publication costs of this article were defrayed in part by payment of page charges. This article must therefore be hereby marked “advertisement” in accordance with 18 USC section 1734 solely to indicate this fact.


