
Abstract
Ligand–receptor interactions mediate intercellular communication, inducing transcriptional changes that regulate physiological and pathological processes. Ligand-induced transcriptomic signatures can be used to infer ligand activity; however, the absence of a comprehensive set of ligand-response signatures has limited their practical application in predicting ligand–receptor interactions. To bridge this gap, we develop Lignature, a curated database encompassing intracellular transcriptomic signatures for 362 human ligands, significantly expanding the repertoire of ligands with available intracellular response signatures such as CytoSig and ImmuneDictionary. Lignature compiles signatures from published transcriptomic data sets, generating both gene- and pathway-based signatures for each ligand. We apply Lignature to prioritize ligand-associated transcriptional activity in controlled in vitro experiments and real-world single-cell sequencing data sets. Across these settings, Lignature consistently improves the prioritization of experimentally supported ligands compared with existing approaches. We additionally develop a regression-based framework to model combinatorial regulation by multiple ligands. These results establish Lignature as a robust platform for ligand signaling inference, providing a powerful tool to explore ligand–receptor interactions across diverse experimental and physiological contexts.
Cell–cell communication is essential for coordinating biological processes in multicellular organisms, with ligand–receptor (LR) interactions serving as a primary mechanism in this process (Armingol et al. 2021, 2024; Su et al. 2024). The rapid advancement of sequencing technologies has enabled the development of numerous computational methods for predicting potential LR interactions from transcriptomic data.
Current methods for predicting cell–cell communication, particularly LR interactions, fall into three major categories. The first category identifies LR interactions based on the coexpression of ligand genes in sender cells and receptor genes in receiver cells. Tools such as CellPhoneDB (Efremova et al. 2020), CellChat (Jin et al. 2021), SingleCellSignalR (Cabello-Aguilar et al. 2020), NATMI (Hou et al. 2020), and ICELLNET (Massenet-Regad et al. 2021) exemplify this approach. Although these methods are effective, they often generate a high number of false positives by relying solely on ligand and receptor gene expression levels.
To enhance accuracy, a second type of approach integrates intracellular networks to model the impact of ligands on target genes in receiver cells. Tools like CCCExplorer (Yeung et al. 2019), NicheNet (Browaeys et al. 2020), SoptSC (Wang et al. 2019), and LRLoop (Xin et al. 2022; Qian et al. 2024) predict LR interactions by comparing observed transcriptional changes with predicted target genes associated with each ligand. However, the incomplete and potentially noisy nature of current signaling and regulatory networks leads to inaccuracies in target gene prediction. Additionally, these methods fail to model the direction and magnitude of target gene expression changes in response to specific ligands.
A third group of methods, including SpaOTsc (Cang and Nie 2020) and COMMOT (Cang et al. 2023), incorporates spatial information to better account for potential signaling between cells, further refining predictions of cell–cell communication. However, these methods rely on spatial transcriptomics data and do not resolve the inherent challenges of expression-based prediction.
In this work, we propose a new approach to predict the specific ligands responsible for the transcriptomic changes within the receiver cells. Instead of merely modeling the target genes of ligands, our method will identify the signatures of ligands by measuring the transcriptomic changes derived from actual gene expression data. When cells are treated with a given ligand and their gene expression is measured before and after treatment, we can then create a distinct signature unique to that particular ligand. It is worth noting that the concept of ligand signatures is widely accepted in the field. Many researchers have identified the “responsive genes” of the ligands (Sanda et al. 2006; Dölken et al. 2008; Qin et al. 2009; Sohn et al. 2010; Cecchi et al. 2015). Previous works such as CytoSig (Jiang et al. 2021) and ImmuneDictionary (Cui et al. 2024) indeed collect the signatures of ligands, whereas PROGENy leverages publicly perturbation experiments for modeling oncogenic and tumor suppressor signaling footprints (Schubert et al. 2018). However, they focus exclusively either on cytokines or on tumor-related pathways, limiting the practical applications of their data sets to the prediction of cell–cell communication. Here we provide a comprehensive ligand signature database, Lignature, which contains the signatures for 362 ligands across diverse categories. Multiple signatures are retained for individual ligands to capture potential cell type–specific transcriptional responses induced by the same ligand. Additionally, we constructed gene- and pathway-based signatures for these ligands. We validated these signatures using in vitro experiments and single-cell sequencing data sets, demonstrating their reliability. The accompanying R (R Core Team 2023)-based computational tool further enables the signature-based ligand–transcriptional program association and corresponding LR interaction predictions.
Results
Overall design
The transcriptomic changes induced by a specific ligand are referred to as the ligand's signatures. By comparing observed gene expression changes to a comprehensive library of ligand signatures, it is possible to predict which ligands are likely to induce observed gene expression changes. To achieve this, we collected transcriptomic data sets in which gene expression profiles were measured before and after treatment with specific ligands. These data sets were used to construct a library of ligand signatures based on the resulting transcriptomic changes.
Recognizing that ligand-induced signatures can vary depending on cell types and experimental conditions, we included multiple signatures for a given ligand when such data sets were available. Additionally, we developed a companion software tool designed to predict and visualize transcriptional program–associated ligands by leveraging this curated collection of ligand signatures.
Generation of the Lignature database
We developed an automatic pipeline to search the NCBI Gene Expression Omnibus (GEO; https://www.ncbi.nlm.nih.gov/geo/) (Edgar et al. 2002) for data sets with an experimental design that would potentially contain transcriptomic responses to these ligands. Starting with the metadata of all 25,868 platform identifiers downloaded from GEO, we collected metadata for 72,738 data series corresponding to Homo sapiens platforms and molecule types “total RNA,” “poly(A) RNA,” or “nuclear RNA,” in which each data series could include multiple data sets. The curated metadata of the GEO data series were then queried with a predefined set of 859 ligands based on our previous work LRLoop (Xin et al. 2022). We searched the metadata with ligand genes’ full names, symbols, and aliases, together with a set of 105 experiment keywords such as “ligand,” “receptor,” “treatment,” “stimulate,” “overexpress,” “block,” “knockdown,” and “silence,” which resulted in a list of 9187 data series for manual curation. Finally, after carefully examining the collected data series in GEO, we removed those that were not relevant to our purpose or that exhibited technical issues such as the use of non-genome-wide platforms, an ambiguous data description, or the lack of accessible raw/processed data. This curation yielded a list of 460 data series, containing transcriptomic response data for 213 ligands that were not included in the databases CytoSig (Jiang et al. 2021) and ImmuneDictionary (Fig. 1A; Cui et al. 2024).
Curation and overview of Lignature. (A) Flowchart of generating the Lignature database. (B) Number of the ligands collected in the Lignature database from different data sources. (C) HUGO Gene Nomenclature Committee (HGNC) categories of the ligands curated in the Lignature database. (D) Schematic diagram of application of Lignature in predicting and visualizing LR interactions based on ligand signatures and LR expression. (E) Distribution of the number of signatures of each ligand in Lignature.
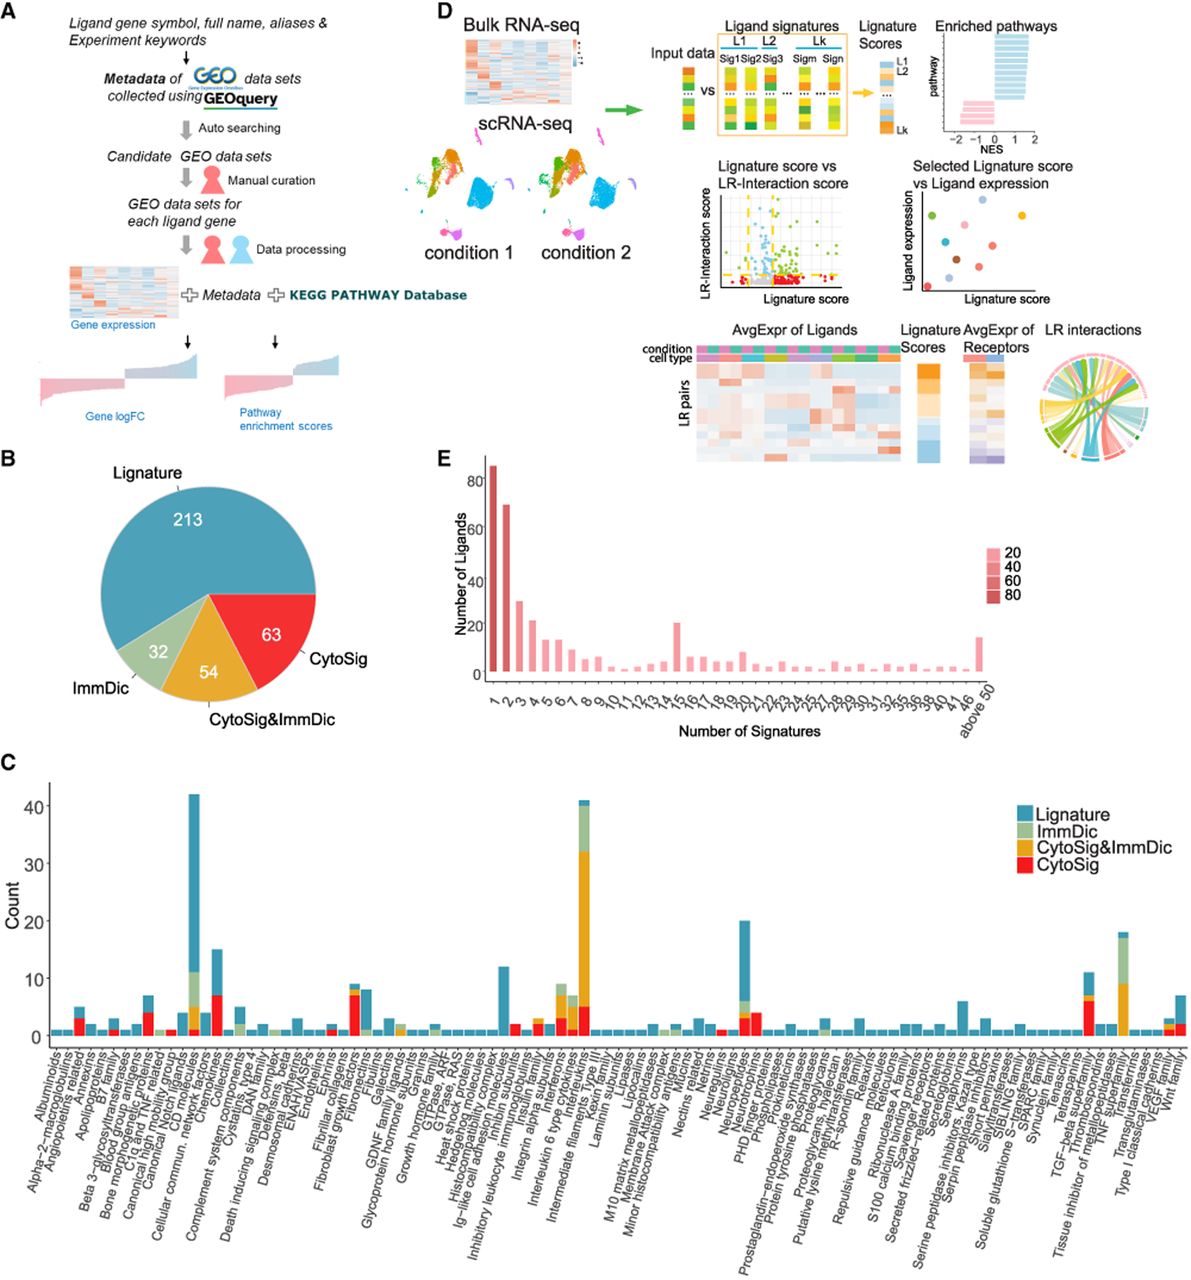
The transcriptomic data sets, including gene expression array and RNA-seq data sets, were then processed for differential expression analysis (for details, see Methods), vectors of log2fold-change (FC) values for expressed genes were collected as gene-level ligand signatures. For data sets with multiple treatment conditions (e.g., durations or doses), a separate signature was created for each different condition. After combining the data of 149 ligands from CytoSig (Jiang et al. 2021) and ImmuneDictionary (Cui et al. 2024), we obtained the data sets for 362 ligands (Fig. 1B). In addition to the gene-level response signatures, we also calculated KEGG (Kanehisa and Goto 2000; Kanehisa 2019; Kanehisa et al. 2025) pathway signatures for each ligand. Specifically, we performed gene set enrichment analysis across 302 KEGG pathways (each containing 10–500 genes) and calculated the normalized enrichment score (NES) for each pathway. The resulting NES vectors were compiled as the pathway-level signatures. (Fig. 1A). For each signature, we comprehensively summarized information on cell types, organisms, sources of the cell type or tissue, and conditions pertaining to the ligand treatment dose and duration (Supplemental Table S1).
The 362 ligands with signatures in Lignature are classified into 100 groups based on the HUGO Gene Nomenclature Committee (HGNC; https://www.genenames.org) categories (Seal et al. 2023), including a group labeled “other” consisting of 64 ligands that either have no gene groups or have only very generalized (such as “receptor ligands”) or biochemical structure–focused (such as “WAP four-disulfide core domain containing”) gene groups specified in the HGNC. The largest ligand groups include CD molecules, interleukins (ILs), neuropeptides, the TNF superfamily, and chemokine ligands (Fig. 1C; Supplemental Table S2). This classification also highlights data source biases; CytoSig and ImmuneDictionary primarily focus on ILs, the TNF superfamily, interferons (IFNs), and fibroblast growth factors, whereas our newly curated data cover a broader range, including most CD molecules, neuropeptides, Ig-like cell adhesion molecules, and semaphorins.
Using the Lignature database as a reference, we provided a companion computational tool that infers the ligands or ligand combinations responsible for transcriptomic changes within receiver cells, as well as the corresponding cell–cell interaction networks between multiple cell types or clusters. The tool provides multiple options for calculating expression-based LR interaction strength, providing an intuitive summary of the predicted LR activities across different conditions (Fig. 1D).
Overall properties of the ligand signatures
A single ligand may have multiple signatures, as it may produce different responses in various cell types with diverse treatment durations and concentrations. In fact, across the total of 4215 signatures corresponding to 362 ligands, the number of signatures per ligand ranges from one to 271, with TGFB1 having the largest number of signatures (Fig. 1E). We systematically compared the similarity of signatures of the same ligand with those from different ligands by calculating Pearson correlation coefficients for all signature pairs (Fig. 2A). The mean correlation coefficients between signatures of the same ligand are 0.174, 0.161, and 0.064 in Lignature, CytoSig, and ImmuneDictionary, respectively. In contrast, the mean correlation coefficients between signatures of different ligands are 0.003, 0.022, and 0.058 for Lignature, CytoSig, and ImmuneDictionary, respectively. This analysis indicates that signatures derived from the same ligand tend to exhibit higher similarity than those from different ligands. Correlation analysis of five representative ligands, TNF, TGFB1, SHH, IFNA (family), and IFNG, further supports this observation (Supplemental Fig. S1A).
Properties of ligand signatures in Lignature. (A) Distributions of Pearson correlation coefficients of gene-level signatures of the same ligand and signatures from different ligands. P-values were calculated using a KS test. (B) Heatmaps of sample gene-level signatures of TGFB1 and SHH (x-axis represents genes in the signatures) exhibit diversity in signatures for individual ligands. (C) Examples of enriched upregulated and downregulated KEGG pathways in sample ligand signatures (LEP and TNFSF13).
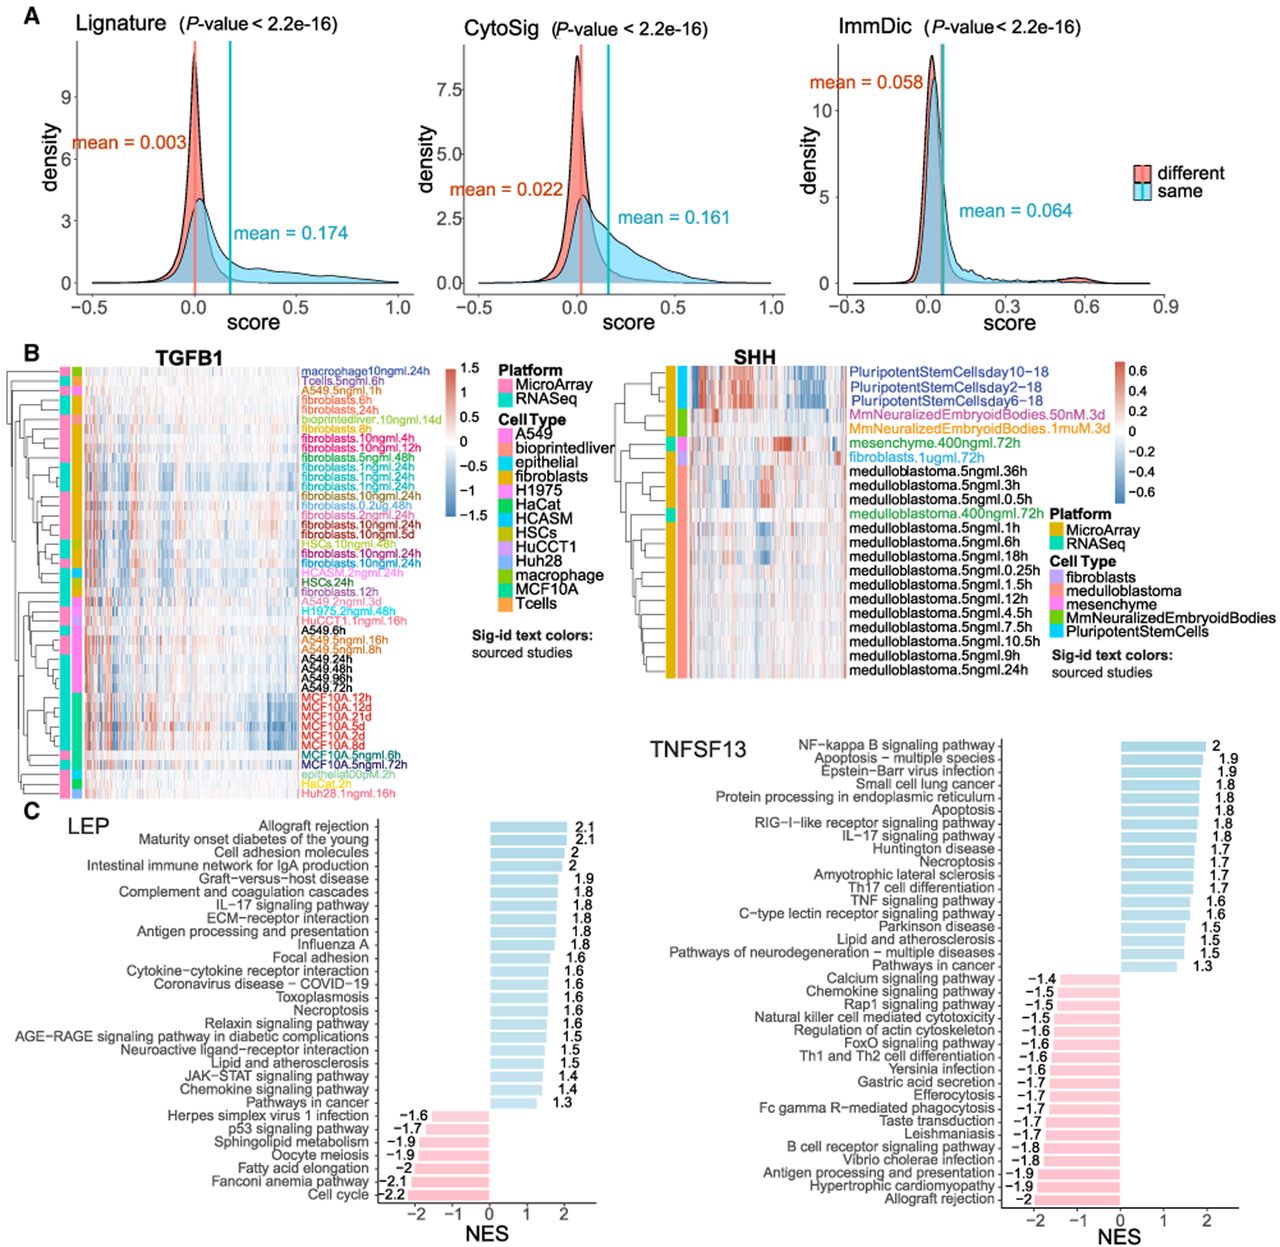
Although signatures generated by the same ligand exhibit higher similarity than those from different ligands, the same ligand can still induce diverse responses across cell types, treatment conditions, and other biological contexts. To further investigate the sources of this diversity, we analyzed signature variation within individual ligands. For example, TGFB1 signatures show that profiles derived from the same cell types or cell lines (e.g., fibroblasts, A549, MCF10), whether from the same or different studies, tend to cluster together, whereas signatures from different cell types display substantial variation (Fig. 2B). Similarly, SHH has more than 20 signatures from data sets across different organisms, cell types, treatment modalities, doses, durations, and platforms. Signatures derived from the same cell types, such as mouse neuralized embryoid bodies or medulloblastoma cells, consistently cluster together, whereas signatures across distinct cell types show context-dependent variation (Fig. 2B). Together, these analyses indicate that cell type is a major source of signature diversity for a given ligand.
To confirm the biological relevance of the ligand signatures, we calculated the enrichment of upregulated and downregulated genes of ligand signatures in KEGG pathways. For instance, the enriched pathways for the signature genes of ligand LEP (which encodes leptin) include allograft rejection, intestinal immune network for IgA production, graft-versus-host disease, and complement and coagulation cascades. These pathways are related to LEP's involvement in inflammatory processes (Molinero et al. 2016; Cui et al. 2017; Scheja and Heeren 2019). Conversely, the TP53 pathway is enriched in downregulated genes, consistent with leptin's inhibitory effect on cell cycle processes by decreasing the key TP53 proliferation regulator (Fig. 2C; Toro et al. 2014). Similarly, the signature genes of ligand TNFSF13 shows enrichment of upregulated genes in NF-kB signaling, apoptosis, the TNF signaling pathway, and other pathways that are highly consistent with the known cellular functions of TNFSF13 (Baert et al. 2018). It is worth noting that TNFSF13 is also closely associated with allograft rejection in organ transplantation (Fig. 2C; for more examples, see Supplemental Fig. S1B; Jo et al. 2019). These enriched pathways underscore the biological significance of the ligand signatures and can be used to construct pathway-based signatures and predict the active ligands.
Finally, we examined whether ligands from the same family or with similar biological functions tend to induce similar transcriptional responses. To do this, we generated a merged signature for each ligand and performed hierarchical clustering based on the similarity of these merged signatures. This analysis revealed several coherent groups corresponding to well-established ligand families (Supplemental Fig. S1C). For example, members of the TGF-beta family, including TGFB1, TGFB2, and TGFB3 and BMP2, BMP4, and BMP6, clustered tightly, consistent with their convergent downstream signaling pathways (Miyazono et al. 2001; Elsafadi et al. 2019; Wu et al. 2024). Likewise, most IFNs clustered together, and many ILs showed relatively close similarity. In addition, TNF, IL1B, and CD40LG, which all regulate NF-kB signaling, grouped together (Lawrence 2009; Hostager and Bishop 2013; Jiang et al. 2021). In contrast, clusters of differentiation (CD) molecules, whose nomenclature is based on structural or localization features rather than shared functions, were dispersed across the clustering, reflecting their broad functional diversity.
Assessment of signaling inference with bulk in vitro data sets
We assessed the ability of Lignature to predict active ligands using ligand signatures. To this end, we collected and processed additional transcriptomic data sets as test cases, in which known ligands were used to treat cell lines, and transcriptomic changes were measured before and after treatment. The goal was to predict the treatment ligands based on these observed transcriptomic changes. A total of 90 test data sets were used, including 24 human and 66 mouse data sets, representing 27 unique treatment ligands (Fig. 3A). Note that the test data sets were not included in the initial Lignature database used to generate ligand signatures, and the same test data sets were used when comparing Lignature with other existing methods.
Comparison of Lignature to other methods in signaling inference with bulk in vitro data sets. (A) A total of 90 transcriptomic data sets of ligand-treated cell lines were used as test data sets, including 24 human and 66 mouse data sets representing 27 unique treatment ligands. (B) Top-ranked ligands (among all ligands included in Lignature) and the corresponding ligand scores of an example test data set treated with IFNG, predicted from gene-level signatures, pathway-level signatures, and three other methods. (C) Ranks of the actual treatment ligands among all ligands included in Lignature of 90 test data sets predicted by each method. (D) AUC values of the ROC curves for predictions of the 90 test data sets from each method. (E) ROC curves and the corresponding AUC values for combined predictions of all the 90 test data sets from each method. In this in vitro setting, true positives are defined as the experimentally added ligands, whereas false positives correspond to all other ligands.
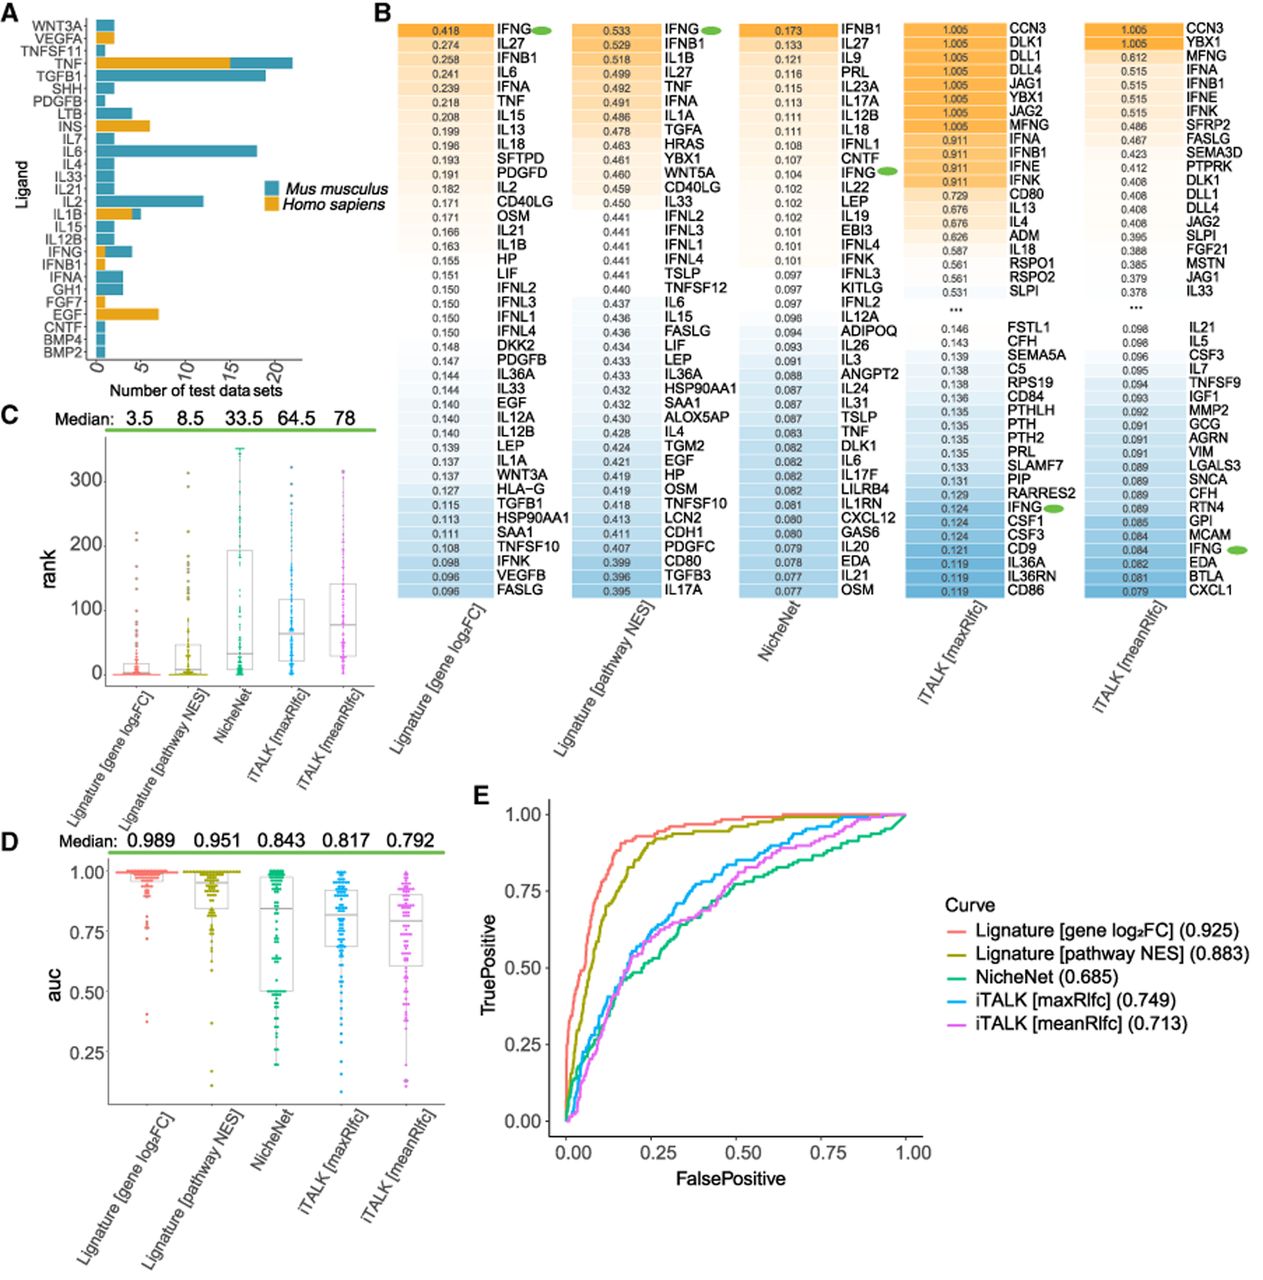
For each test data set, we measured the similarity between the observed transcriptomic changes and signatures in the Lignature library by the Pearson correlation coefficients. The signatures were ranked based on these similarities, and the ranked position of the treatment ligand was examined. For example, in a data set treated with ligand IFNG, the transcriptomic changes were compared against the signatures of the ligands in Lignature. Both the gene-level and pathway-level signatures for ligand IFNG exhibit high correlation coefficients with the test data, accurately identifying it as an acting ligand responsible for the observed transcriptomic changes (ranked number 1) (Fig. 3B). Three other methods for ligand activity prediction based on receiver-cell responses were compared with Lignature. NicheNet ranked IFNG number 11, lower than the prediction from Lignature, yet a reasonably high rank for identifying IFNG as a treatment ligand. Another method, iTALK, that predicts LR interactions based on differential expression of receptor genes alone ranked IFNG much lower at number 279 and 306 when scoring each ligand by the maximum or mean absolute log2FC values, respectively, of its cognate receptors (denoted by maxRlfc and meanRlfc) (Fig. 3B).
Across all 90 test data sets, the median rank of treatment ligands was 3.5 and 8.5 for predictions from Lignature gene- and pathway-level signatures (Fig. 3C), the median AUC values of the corresponding receiver operating characteristic (ROC) curves are 0.989 and 0.951 (Fig. 3D), and the AUC values of the combined ROC curves from predictions for all 90 test data sets are 0.925 and 0.883, respectively (Fig. 3E). Applying NicheNet, iTALK(maxRlfc), and iTALK(meanRlfc) to the same data sets yielded median ranks of 33.5, 64.5, and 78 for the treatment ligands (Fig. 3C); median AUC values of the corresponding ROC curves 0.843, 0.817, and 0.792 (Fig. 3D); and AUC values of combined ROC curves 0.685, 0.749, and 0.713 (Fig. 3E). In this well-controlled in vitro setting, Lignature shows significantly enhanced ability to prioritize experimentally supported ligand–transcriptional program associations relative to existing methods.
We next asked whether the signatures from one species can be applied to another. Because Lignature contains mostly signatures from human data sets, we compared its performance on 24 human and 66 mouse test data sets to assess cross-species applicability (Supplemental Fig. S2A,B). In human test data sets, the median rank of the treatment ligands was two for both gene- and pathway-level signatures. In mouse test data sets, the corresponding median ranks were four and 13, respectively. These comparable performances indicate that transcriptional responses to homologous ligands are largely conserved across species, enabling effective cross-species inference of transcriptional program–associated ligands.
We next examined whether the number of available signatures for a ligand influenced prediction performance. Our analysis revealed a weak-to-moderate negative correlation (–0.39) between signature library size and prediction rank, indicating that ligands with more signatures tend to achieve better prediction performance. However, this trend was not absolute: Ligands with only a few signatures often ranked highly, whereas some ligands with large signature libraries performed only moderately (Supplemental Fig. S2C).
Combinatorial regulation
We next evaluated whether ligand signatures could predict combinatorial ligand effects. Our analysis used 38 data sets in which cells were treated with pairs of ligands drawn from 13 distinct factors, across varying doses and treatment durations. When each ligand was considered independently, the signatures frequently identified either both treatment ligands or one of them, with the latter likely reflecting cases in which a single ligand dominated the transcriptional response (Supplemental Fig. S3A,B).
To more directly address the challenge of deconvoluting combinatorial signaling, we developed a dedicated feature that applies regularized linear regression (Ridge, LASSO, or Elastic Net) to model a differential expression profile as a weighted combination of multiple ligand activities. Using LASSO regression on the 38 dual-ligand data sets, this combinatorial approach improved the ranking of the true treatment ligands relative to individual signature matching at both the gene and pathway levels (Supplemental Fig. S3A,B). These results indicate that ligand signatures can be extended to predict more complex combinatorial signaling interactions.
Application and assessment of Lignature with scRNA-seq data sets
We then applied Lignature to two published scRNA-seq data sets that preserved more natural in vivo conditions involving multiple cell types.
Example 1: SHH-induced thalamic differentiation
To investigate SHH-mediated thalamic differentiation, organoids were treated with recombinant SHH, and scRNA-seq was performed on samples collected on day 70 with or without SHH treatment (Kiral et al. 2023). Major cell clusters were identified, including excitatory neurons (ExNs), inhibitory neurons (INs), astrocytes (ASs), endothelial cells (ECs), and ependymal cells (Epn) (Fig. 4A,B). Because SHH activation promotes the generation of INs, we focused on the IN cluster from the SHH day 14–22 treatment sample compared with the untreated sample.
Application and assessment of Lignature on the SHH-induced thalamic differentiation scRNA-seq data set. (A,B) UMAP dimensionality reductions, example feature plots, and DotPlot of selected marker genes of major cell clusters of the SHH-induced thalamic differentiation scRNA-seq data set. (C) The top predicted ligand scores obtained for the IN cells. The transcriptomes from the SHH day 14–22 treatment samples were compared with untreated samples, and transcriptional program–associated ligands were predicted using Lignature alongside three other methods. The first column shows the detection rates of the ligands across all cells, and the second column shows the maximum detection rate of their cognate receptors in IN cells.
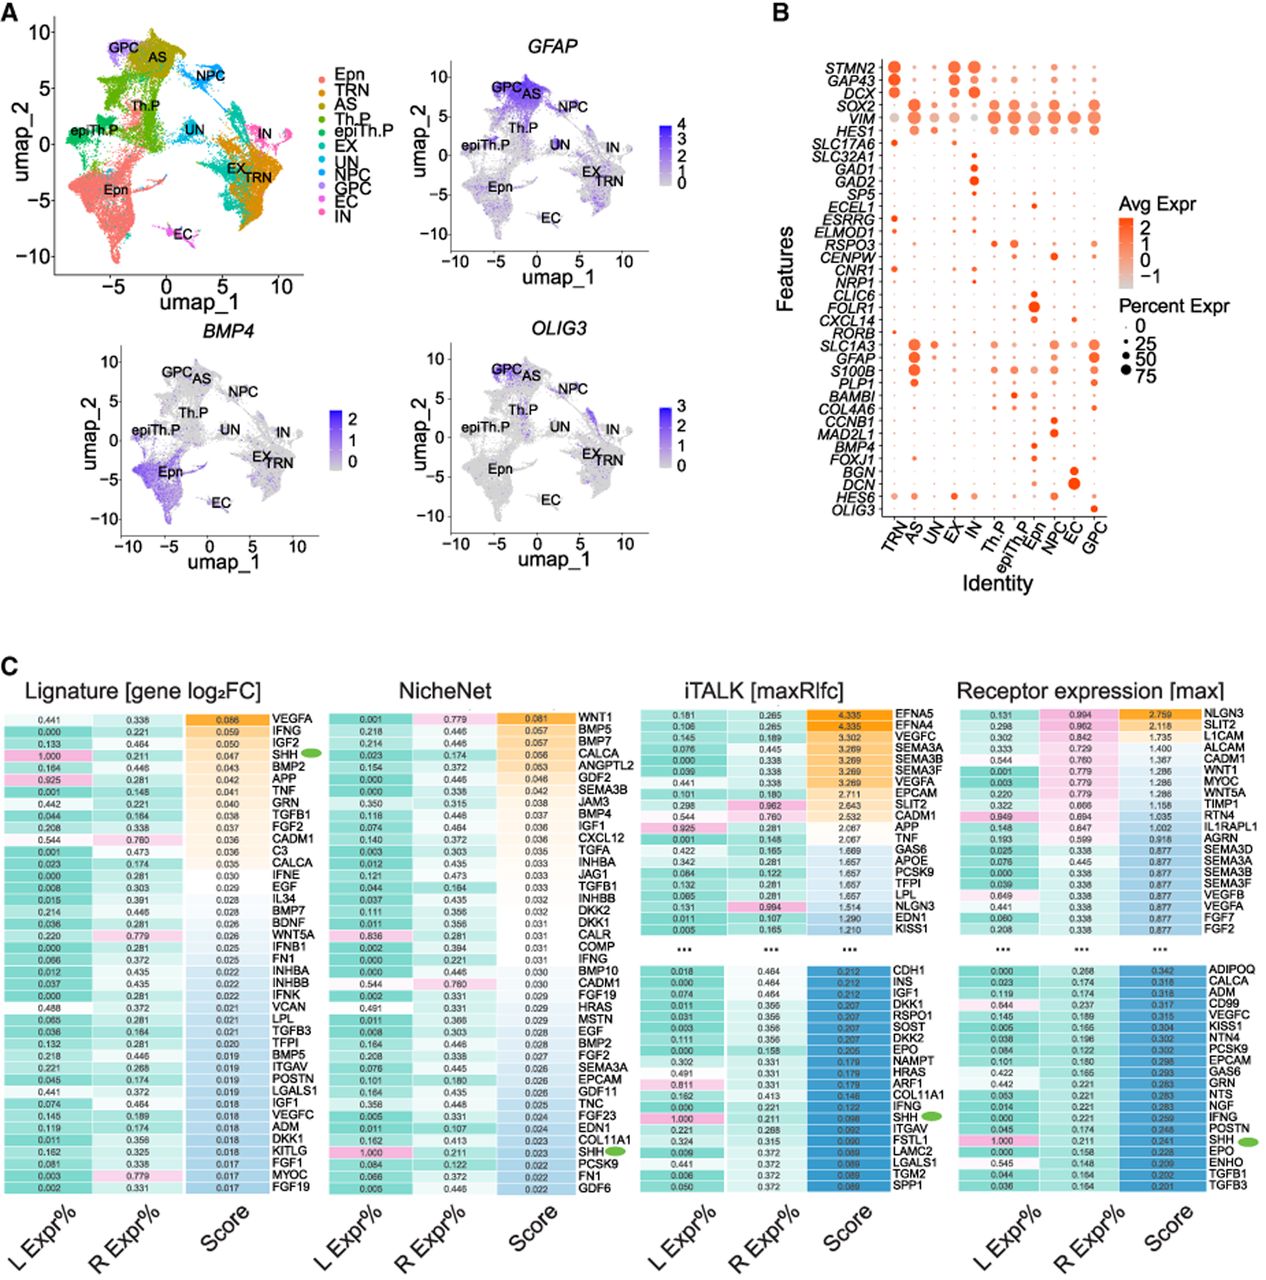
Candidate ligands in Lignature were first filtered based on the detection rate of their receptors, retaining ligands with at least one receptor detected at a rate above 0.1. Using Lignature (gene-level signatures), SHH was ranked as one of the top ligands (number four) predicted to be transcriptional program associated, inducing the observed transcriptomic changes (Fig. 4C, green dots; Supplemental Fig. S4A). Three ligands, VEGFA, IFNG, and IGF2, ranked higher than SHH. Among them, IFNG can be reasonably excluded, because the expression level of IFNG in all cells are zero (Fig. 4C). VEGFA and IGF2 are known to be the downstream regulators of SHH, which play a role in neurogenesis, neuroprotection, and the processes of synaptic formation throughout neural development (Lawson et al. 2002; Rosenstein et al. 2010; Mackenzie and Ruhrberg 2012; Alberini 2023; Pandey et al. 2023). This result suggests that Lignature captures the transcriptomic response from the signaling cascade initiated by SHH. In contrast, with the same set of candidate ligands and filtering criteria, NicheNet, iTALK (maxRlfc), and a receptor expression–based method (maximum expression of the cognate receptors) ranked SHH much lower at number 37, 114, and 126, respectively. In summary, Lignature successfully prioritized SHH, an exogenously introduced ligand, as one of the active ligands associated with transcriptomic changes between treated and untreated samples, demonstrating improved performance relative to other methods in linking ligand activity to transcriptional programs during induced IN generation.
Example 2: microglia and Müller glia regeneration
Microglia cells have been implicated in suppressing Müller glia (MG) regeneration capacity, as microglia ablation improved retinal neurogenesis from MG (Todd et al. 2020). Furthermore, treatment with TNF in microglia-ablated mice suppressed the enhanced neurogenesis observed in the absence of microglia (Todd et al. 2020), suggesting that microglia-originated TNF might inhibit MG regeneration. scRNA-seq was performed on microglia and MG before and after microglia ablation (Fig. 5A,B; Todd et al. 2020), and we aimed to predict the ligands responsible for the transcriptomic changes in MG.
Application and assessment of Lignature on microglia and Müller glia (MG) regeneration scRNA-seq data set. (A,B) UMAP dimensionality reductions of the scRNA-seq data on microglia and MG before and after microglia ablation. (C) Heatmaps of the top predicted ligand scores from Lignature and three other methods, together with detection rate of the ligands in microglia and the maximum detection rate of their cognate receptors in MG before microglia ablation. (D) LR interaction strengths were calculated by CellPhoneDB and NATMI based on the expression of ligand genes in microglia and the expression of the receptors in MG, and each ligand was scored by the maximum interaction strength among the LR pairs between the ligand and its receptors. CellPhoneDB- and NATMI-induced ligand scores, as well as gene-level Lignature-predicted ligand scores, zeroed out by detection rates of the ligands and their receptors at 0.3, were plotted in scatter plots against the detection rates of the ligands in microglia.
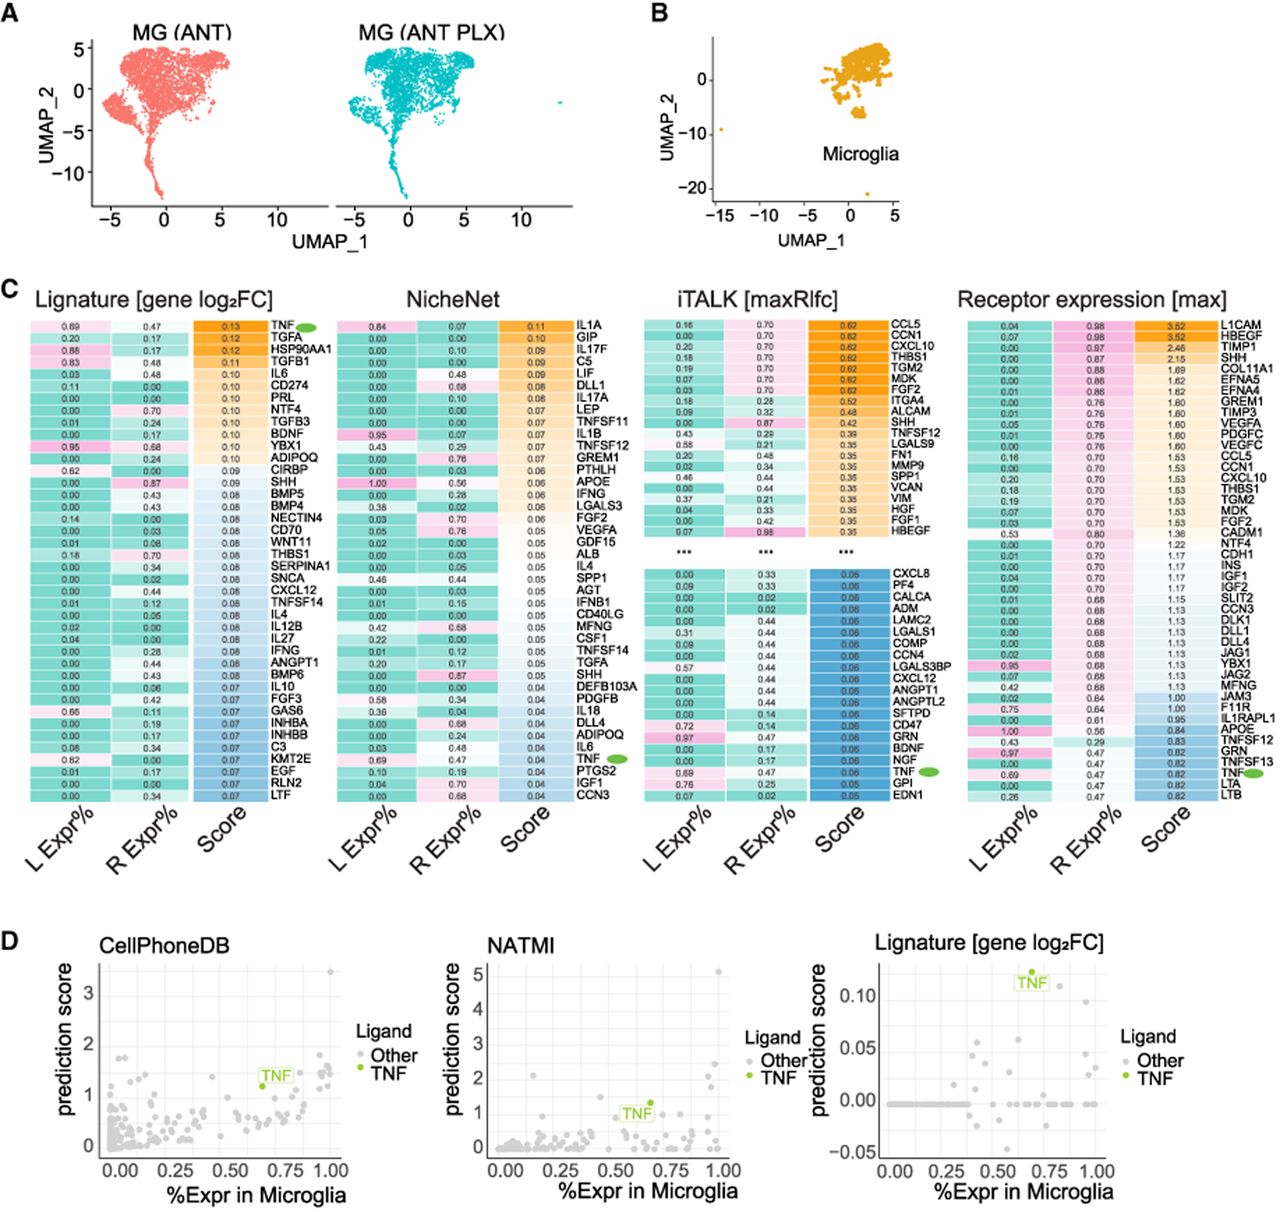
Application of Lignature to the scRNA data in MG predicted TNF as the top-ranked ligand (Fig. 5C, green dots; Supplemental Fig. S4B). In contrast, when we used NicheNet to assess the activities of the same ligands, TNF was positioned number 37. Several ligands highly ranked by NicheNet, such as IL1A, GIP, IL17F, C5, and LIF, were assigned lower rankings by Lignature. Upon examining the expression levels of these ligands in the sender cells (microglia) and their receptor's expression in MG before microglia ablation, we found that either the ligands or their receptors were undetectable or detected in a very limited portion of the cells, indicating they are unlikely to be the major contributors to the transcriptomic changes in MG. Moreover, iTALK and a receptor expression–based method ranked TNF number 148 and 42, failed in ranking TNF highly as a transcriptional program–associated ligand for the transcriptomic changes in MG.
We next used CellPhoneDB, NATMI, SingleCellSignalR, and CellChat, four well-established gene expression–based methods for predicting LR interactions, to identify active ligands responsible for the transcriptomic changes in MG. The ligands were ranked based on their maximum interaction strength with corresponding receptors. TNF was ranked 17th, seventh, seventh, and sixth by CellPhoneDB, NATMI, SingleCellSignalR, and CellChat, respectively (Fig. 5D; Supplemental Fig. S4C). This analysis suggests that gene expression alone might not be sufficient for the identification of transcriptional program–associated ligands, whereas in practice, filtering the candidate ligands by the gene expression levels would help reduce noises (Fig. 5D).
Usage of Lignature
We demonstrate the usage of Lignature by applying a scRNA-seq data set of immune cell populations in checkpoint blockade–associated colitis and control samples (Luoma et al. 2020). Our program takes the Seurat object, specified receiver and sender cell types, and a pair of sample conditions as input. In this case study, we focused on the transcriptomic changes between samples from checkpoint inhibitor–treated melanoma patients with and without histologically colitis, labeled “colitis” and “NC,” in myeloid, with all cell types in the data set as potential ligand sending cells (Fig. 6A,B).
Application of Lignature on checkpoint blockade–associated colitis scRNA-seq data set. (A) UMAP dimensionality reductions show cell types identified in the scRNA-seq data of immune cell populations in checkpoint blockade–associated colitis and control samples. (B) Enriched upregulated and downregulated KEGG pathways in myeloid cells between colitis and normal colonic mucosa endoscopically and histologically (NC) samples. (C) Scatter plot of ligand signature similarity scores predicted by Lignature (x-axis) and the maximum LR interaction strengths calculated by the method NATMI across all sender cells and conditions (y-axis) for all LR pairs. (D) Scatter plot of similarity scores predicted by Lignature (x-axis) and the maximum average expression across all sender cells and conditions (y-axis) of the ligands for identified LR interactions (detection rate of the ligand genes above 0.25 in any cell type, detection rate of the receptor genes above 0.25 in myeloid, and ligand signature similarity scores above 0.1). (E) Heatmaps of ligand signature similarity scores predicted by Lignature (middle), the average expression of the ligands in all cell types identified in the colitis and NC samples (left), and the average expression of their receptors in myeloid cells in the colitis and NC samples (right) for LR interactions identified by the same criteria as in D. (F) Circular plot (generated using R package circlize) (Gu et al. 2014) of maximum interaction strengths calculated by NATMI across the colitis and NC samples, of the LR pairs from all cell types to myeloid, with detection rates of both the ligand and receptor genes above 0.25, ligand signature similarity scores above 0.1, and ligand expression in sender cells >75% of all cell types.
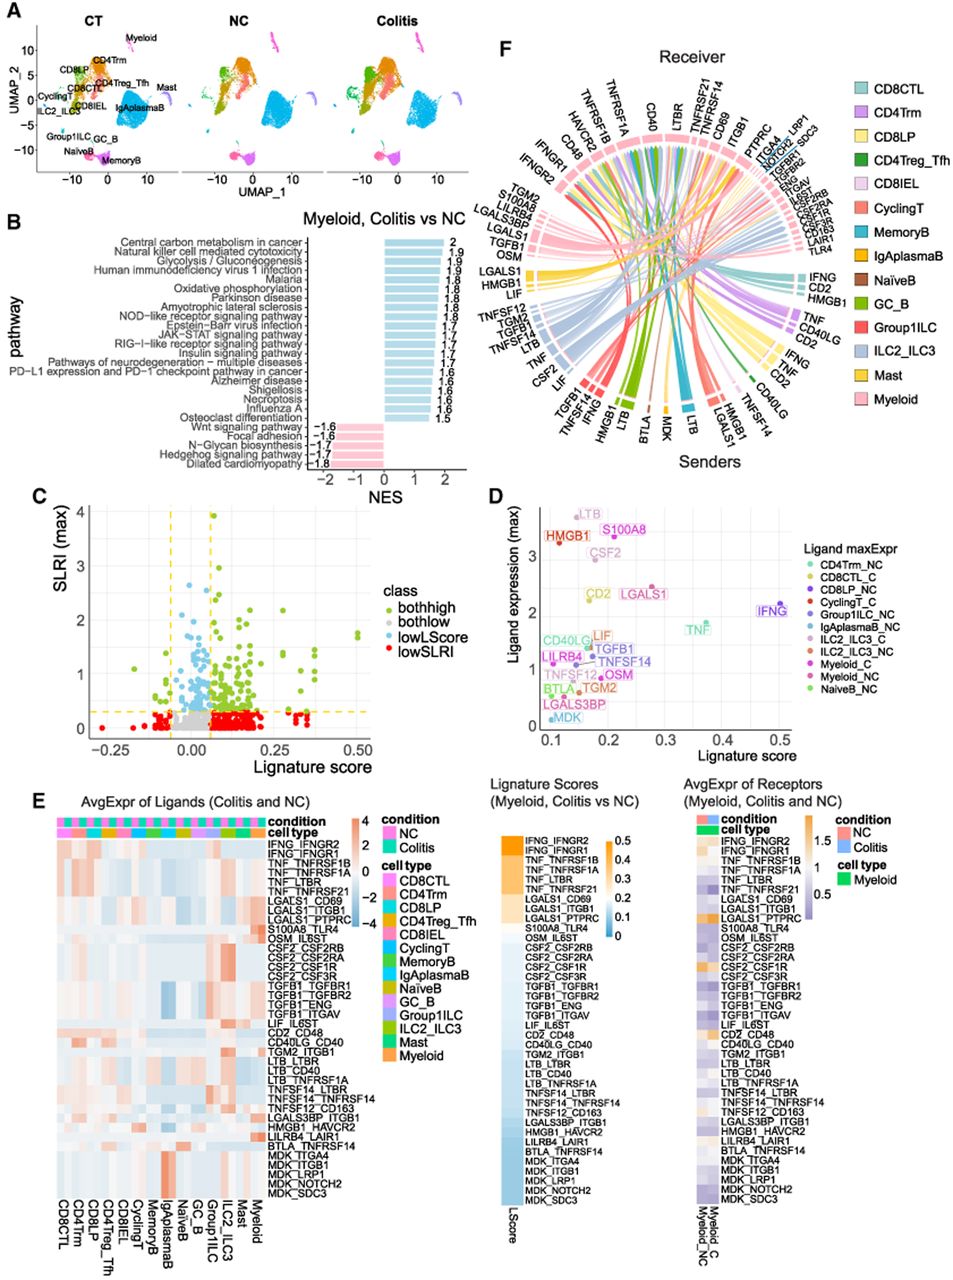
Lignature scores the candidate ligands based on users’ choice of the similarity measurement metric (e.g., Pearson correlation coefficient, Spearman's correlation coefficient, cosine similarity, Euclidean distance) or signature weights from combinatorial analysis by regularized linear regression (Ridge, LASSO, or Elastic Net). Here we used the Pearson correlation coefficient, which was set as default in Lignature. In parallel, Lignature calculates the LR interaction strengths using specified methods such as CellPhoneDB, SingleCellSignalR, or NATMI, which was used in this case. Transcriptional program–associated ligands can be then predicted based on both Lignature score and LR interaction strength (Fig. 6C). Lignature also provides options for filtering the list of LR pairs by gene expression, differential expression, Lignature score, confidence score, interaction strength, and specificity. Finally, Lignature produces various plots displaying enriched pathways, inferred ligands, and the associated LR interactions, providing intuitive visualizations for the analysis (Fig. 6B–F; Supplemental Fig. S5). Through this analysis, Lignature successfully identified transcriptional program–associated ligand signaling to myeloid cells such as IFNG and TNF from T cells, as well as potential therapeutic targets for checkpoint inhibitor–induced colitis such as TNF.
Discussion
Understanding cell–cell communication is fundamental in decoding complex biological processes, and LR interactions play a pivotal role in mediating these signals. In this study, we introduced Lignature, a comprehensive database of ligand signatures derived from experimental data, coupled with a predictive framework for prioritizing transcriptional program–associated ligands based on observed transcriptomic changes. By leveraging this resource, we address several limitations of existing computational methods, such as the challenge of ligand–transcriptional program association prioritization from gene expression–based approaches and biases introduced by incomplete signaling network models.
Compared with network-based methods such as NicheNet, Lignature captures not only the target genes of the ligands but also the direction (i.e., up- and downregulation) and the magnitude of the expression changes of the target genes. Furthermore, it also captures cell type–specific and condition-specific transcriptomic changes. Our findings demonstrate that Lignature consistently outperforms existing methods, including NicheNet and iTALK, in prioritizing experimentally supported ligand–transcriptional program association. For example, in both controlled in vitro data sets and more complex in vivo scRNA-seq data sets, Lignature was able to rank the actual treatment ligands or experimentally validated biologically relevant ligands at the top.
Ligand–receptor redundancy, in which different ligands can interact with the same receptor and in which a single ligand can bind to multiple receptors and activate distinct pathways, is prevalent in biological systems. This redundancy enables both convergent functional synergies and divergent, context-specific responses. For example, lymphotoxin proteins in the TNF superfamily, such as LTA and LTB, can bind TNF receptors and trigger intracellular signaling cascades similar to other TNF superfamily ligands (Seleznik et al. 2014). Likewise, certain ILs share convergent signaling pathways with specific IFNs; for instance, IL2, IL3, and IL6 and IFNE and IFNK all activate the JAK-STAT signaling pathway (O'Shea et al. 2015; Philips et al. 2022). Consistent with these known relationships, our clustering analysis positioned LTA/B, several other TNF superfamily members, ILs, and IFNs in close proximity (Supplemental Fig. S1C). Conversely, some ligands, such as growth factors like EGF, can activate multiple signaling pathways or pathway branches, including PI3K/AKT/mTOR, JAK-STAT, and MAPK/ERK. Such versatility allows ligands to induce divergent functions depending on tissue-specific and cell type–specific contexts and supports our decision to retain multiple signatures for a single ligand.
Despite the strong performance of Lignature across our analyses, several limitations remain. First, a fundamental challenge in benchmarking LR inference methods is the lack of a definitive ground truth and the biological complexity arising from multiple ligands acting simultaneously within tissues. Accordingly, although Lignature can prioritize experimentally supported ligands, other highly ranked ligands predicted by alternative methods cannot be simply classified as false positives, particularly in single-cell contexts in which concurrent signaling is common. Second, because Lignature infers activity from downstream transcriptional programs, it may prioritize ligands with convergent signaling effects, even in the absence of detectable ligand expression. For example, in the SHH data set, Lignature ranked IFNG among the top predicted ligands, despite IFNG expression being undetectable across cells. Therefore, Lignature is not intended to function as a standalone method for definitive ligand attribution. Instead, we recommend interpreting Lignature-derived activity scores in conjunction with ligand-based and receptor expression–based methods, which can help refine and validate candidate ligands, particularly in settings in which specificity is critical. Third, the current version of Lignature depends on condition-based comparisons to extract ligand-induced transcriptional signatures and is therefore not directly applicable when matched conditions are unavailable, such as in many human tissue data sets. In these cases, users can still apply Lignature by defining biologically meaningful contrasts within a single data set, for example, leveraging cell type labels, clinical groupings, or positions along a developmental trajectory to construct pseudoconditions for comparison.
Several future directions could further strengthen Lignature's coverage and usability. First, although Lignature retains predictive capability even for unseen cell types, expanding the library as additional transcriptomic data sets become available across diverse tissues/cell types and pathological conditions will improve the overall predictive power of the database. Second, extending signatures to more species will enhance cross-species generalizability. Although Lignature achieved comparable performance on human and mouse data sets in benchmarking analyses, its performance was more robust on human data sets, likely owing to the predominance of human-derived signatures in the current database. Third, incorporating nonpeptide ligands, such as neurotransmitters, will broaden the range of signaling activities that can be accurately inferred (Xin et al. 2025). Finally, although we provide companion software with Lignature to predict ligand–transcriptional program associations, Lignature can also function as a standalone database; both integrate easily with other analytical tools. For example, Lignature can be combined with existing spatial transcriptomics workflows. Lignature infers ligand–transcriptional program associations from transcriptional changes in receiver cells, whereas spatial analyses can evaluate the physical plausibility of inferred interactions based on colocalization patterns.
In summary, Lignature represents a significant advancement in the field of cell–cell communication, providing a robust, experimentally validated resource for inferring ligand–transcriptional program association. Its ability to address the limitations of existing computational methods while offering mechanistic insights underscores its potential as a valuable tool for both basic and translational research.
Methods
Data set collection
We collected 859 human ligands based on our previous work LRLoop (Xin et al. 2022). We then developed an automatic pipeline to search the GEO (Edgar et al. 2002) for data sets with an experimental design that would potentially contain transcriptomic responses to each ligand.
Specifically, our collection of the relevant data sets includes the following three steps. We started with the list of all 25,868 platform accession identifiers downloaded from GEO and collected the metadata for each of them using the R package “GEOquery” (Davis and Meltzer 2007), filtered the list by restricting the organism to “Homo sapiens,” and collected the list of 97,693 data series identifiers corresponding to the 6278 filtered platforms, in which each data series could include multiple data sets. Then again using GEOquery, we curated metadata for the collected data series including data “type,” “organism,” “molecule,” “platform id,” “cell line,” “cell type,” “tissue,” as well as data “title,” “abstract,” “url,” “geo accession,” “overall design,” “sample taxid,” “summary,” etc. The list of data series was then filtered by requiring the “molecule” entry of the corresponding metadata to include the strings “total RNA,” “polyA RNA” (for poly(A) RNA), or “nuclear RNA,” resulting in a list of 72,738 data series identifiers for further systematic searching of ligand and experiment keywords.
To search the curated metadata of the GEO series systematically for potential ligand signatures, we collected a set of “ligand keywords” including the gene full names, symbols, and aliases for each ligand, as well as a set of 105 experiment keywords such as “ligand,” “receptor,” “treatment,” “stimulate,” “activate,” “expose,” “block,” “overexpress,” “knockout,” “knockdown,” “silence,” “inhibit,” and “in the presence of.” The curated metadata of the GEO series list were then queried with the ligand keywords and experiment keywords. This automatic searching process reduced the number of candidate data series in the list to 9187 for manual curation.
Finally, through careful manual review of the GEO data series, we excluded entries that were irrelevant to our aims or that presented technical limitations, such as the use of non-genome-wide platforms, unclear experimental descriptions, or missing raw or processed data. This curation resulted in 460 high-quality data series, providing transcriptomic response profiles for 213 ligands not represented in CytoSig (Jiang et al. 2021) and ImmuneDictionary (Fig. 1A; Cui et al. 2024).
In addition, to create a comprehensive ligand signaling signature database, we took advantage of CytoSig (Jiang et al. 2021) and ImmuneDictionary (Cui et al. 2024) by including the cytokine signatures from these sources into Lignature, and we included the signatures of the 90 test bulk data sets after method assessment by these test data sets.
Data processing
We have two major data types: gene expression array and RNA-seq data sets. For the Affymetrix array data with raw data CEL files provided, we adopted the “maEndtoEnd” (Klaus and Reisenauer 2016) workflow, which generates and preprocesses expression data using the R package “Oligo” (Carvalho and Irizarry 2010) and performed differential expression analysis using the “limma” (Ritchie et al. 2015) package. For other forms of array data, we used processed data and performed differential expression analysis using “limma.” Briefly, after RMA calibration using the “oligo::rma” function, an intensity-based filtering was performed by removing transcripts without intensities higher than a threshold of two in at least the number of arrays of the smallest experimental group, followed by annotation of the transcript clusters with gene symbols and removal of multiple mappings. Subsequently, a contrast matrix was constructed using functions “model.matrix” and “makeContrasts”, which was then used as input of a standard differential expression analysis pipeline in limma, namely, “lmFit,” “contrasts.fit,” and “eBayes.” Then for each gene, the most significant ProbeSet corresponding to it with the lowest adjusted P-value was identified and used as the representative of that gene.
RNA-seq data sets were processed with a combination of “edgeR” (Robinson et al. 2010) and “limma.” In brief, a DGEList object was created using the function “DGEList” with the expression count matrix; genes were annotated by gene symbols; and lowly expressed genes were identified for removal by the “filterByExpr” function with default settings. Following gene expression normalization through “calcNormFactors” with the “TMM” method, the standard limma-voom pipeline was applied for differential expression analysis.
After the differential expression analysis, different types of gene identifiers were converted to gene symbols, and the vectors of log2FC values of expressed genes were collected as the gene-level ligand signature. For data sets with multiple treatment conditions, for example, durations or doses, a separate signature was created for each different treatment condition.
In addition to the gene-level signatures, we also calculated KEGG pathway-level signatures for each ligand. Specifically, we collected gene sets of 302 KEGG pathways with ten to 500 genes with the R package “graphite” (Sales et al. 2012). Then for each gene-level signature, we presorted the log2FC vector in descending order and performed Gene Set Enrichment Analysis using the R package “FGSEA” (Korotkevich et al. 2021) and calculated the NES for the KEGG pathways. The vectors of NES were collected as the pathway-level signature (Fig. 1A).
Prediction of active ligands based on ligand signatures
Using the Lignature database as a reference for ligand signaling responses, we provided a companion R-based (R Core Team 2023) computational tool that infers the ligands responsible for observed transcriptomic changes within receiver cells, as well as the corresponding cell–cell interaction networks between multiple cell types or clusters. For a data set of interest, taking matrices resulting from differential expression analysis or the Seurat (Hao et al. 2024) object of single cell RNA-seq data sets as input, Lignature scores each signature in the database by the similarity compared to the input data. Options of the similarity measurement metrics include Pearson correlation coefficient (default), Spearman's correlation coefficient, cosine similarity, Euclidean distance, Manhattan distance, and the Euclidean or Manhattan distance normalized by vector lengths. In addition, Lignature features the option to perform combinatorial analysis by regularized linear regression (Ridge, LASSO, or Elastic Net) using the R packages “caret” (Kuhn 2008) and “glmnet” (Friedman et al. 2010; Tay et al. 2023).
Although potential active ligands are ranked using the similarity scores between observed gene expression changes and ligand signatures, we also provide two measures of statistical significance. First, permutation-based P values are calculated, allowing users to define a threshold for ligand scoring. Second, users may generate a confidence score for each ligand, defined as the proportion of similarity scores in a null distribution, which is constructed from comparisons between signatures of different ligands, that fall below the ligand's observed score. For example, a ligand score of 0.1 with a confidence score of 0.95 indicates that the score exceeds 95% of the null distribution.
When we perform cross-species prediction, genes from mouse data sets were converted to human gene symbols using their human homologs. Furthermore, Lignature provides multiple options for calculating expression-based LR interaction strength such as CellPhoneDB, NATMI, and SingleCellSignalR. In addition, users are provided the choices of filtering the LR interactions by the ligand scores, confidence scores, expression or differential expression of the ligands and their receptors, interaction strength, and the interaction specificities. Lastly, Lignature features the options to visualize predicted ligand scores, expression of the ligands and their receptors, and inferred strengths of LR interactions leveraging the R packages “ggplot2” (Wickham 2016), “pheatmap” (https://github.com/raivokolde/pheatmap), and circlize (Gu et al. 2014), providing an intuitive summary of the predicted LR activities across different conditions (Fig. 1D).
Comparison with other methods
Five other different methods of ligand activity prediction were compared with Lignature. Specifically, for each test data set, “NicheNet” ligand activities were calculated by the R package “nichenetr” according to its recommended parameter settings; that is, expressed genes with |log2FC| ≥ 1 and adjusted P-value < 0.1 were used as differentially expressed genes. The method “iTALK [maxRlfc]” scored each ligand by the maximum absolute log2FC value of the cognate receptors; “iTALK [meanRlfc]” scored each ligand by the arithmetic mean of its receptors’ absolute log2FC values; “receptor expression [max]” scored each ligand by the maximum expression value of the cognate receptors; and “receptor expression [mean]” scored each ligand by the mean expression value of the cognate receptors. On the other hand, with Lignature, “Lignature [gene log2FC]” scored each ligand by the signature similarity scores with the gene-level signatures, whereas “Lignature [pathway NES]” scored each ligand by the signature similarity scores using the pathway-level signatures, with the similarities measured by the Pearson correlation coefficients.
All methods were evaluated using the same test data set, which consists of 90 ligand treatment data sets. These data sets were originally collected and used in NicheNet and were not included in the initial Lignature database. Known treatment ligands were labeled “TRUE” and other candidate ligands were labeled “FALSE.” Ranks of the true treatment ligands were plotted in Figure 3C. In Figure 3D, we present the AUC values calculated from the ROC curves of the methods under comparison for each test data set separately. The ROC curves of the methods under comparison from combined test results of all 90 test data sets are presented in Figure 3E.
Code availability
The Lignature database and the companion R package are available at GitHub (https://github.com/yingxinac/LignatureData and https://github.com/yingxinac/Lignature, respectively) and as Supplemental Code.
Competing interest statement
The authors declare no competing interests.
Acknowledgments
This study was supported by National Eye Institute (NEI) grant R01EY031779 (J.Q.).
Author contributions: Conceptualization was by Y.X. and J.Q. Methodology was by Y.X. and J.Q. Data collection was by Y.X. Data processing was by Y.X., M.A., and C.Q. Software development and bioinformatics analysis were by Y.X., with the help of C.Z. Data interpretation was by C.Q. Writing of the original draft was by Y.X., C.Q., and J.Q. Reviewing and editing were by Y.X., M.A., C.Q., C.Z., and J.Q. All authors read and approved the final manuscript.
Notes
[1] Supplementary material [Supplemental material is available for this article.]
[2] Article published online before print. Article, supplemental material, and publication date are at https://www.genome.org/cgi/doi/10.1101/gr.281287.125.
[3] Freely available online through the Genome Research Open Access option.
References
- ↵Alberini CM. 2023. IGF2 in memory, neurodevelopmental disorders, and neurodegenerative diseases. Trends Neurosci 46: 488–502. 10.1016/j.tins.2023.03.007
- ↵Armingol E, Officer A, Harismendy O, Lewis NE. 2021. Deciphering cell–cell interactions and communication from gene expression. Nat Rev Genet 22: 71–88. 10.1038/s41576-020-00292-x
- ↵Armingol E, Baghdassarian HM, Lewis NE. 2024. The diversification of methods for studying cell–cell interactions and communication. Nat Rev Genet 25: 381–400. 10.1038/s41576-023-00685-8
- ↵Baert L, Manfroi B, Casez O, Sturm N, Huard B. 2018. The role of APRIL—a proliferation inducing ligand—in autoimmune diseases and expectations from its targeting. J Autoimmun 95: 179–190. 10.1016/j.jaut.2018.10.016
- ↵Browaeys R, Saelens W, Saeys Y. 2020. NicheNet: modeling intercellular communication by linking ligands to target genes. Nat Methods 17: 159–162. 10.1038/s41592-019-0667-5
- ↵Cabello-Aguilar S, Alame M, Kon-Sun-Tack F, Fau C, Lacroix M, Colinge J. 2020. SingleCellSignalR: inference of intercellular networks from single-cell transcriptomics. Nucleic Acids Res 48: e55. 10.1093/nar/gkaa183
- ↵Cang Z, Nie Q. 2020. Inferring spatial and signaling relationships between cells from single cell transcriptomic data. Nat Commun 11: 2084. 10.1038/s41467-020-15968-5
- ↵Cang Z, Zhao Y, Almet AA, Stabell A, Ramos R, Plikus MV, Atwood SX, Nie Q. 2023. Screening cell–cell communication in spatial transcriptomics via collective optimal transport. Nat Methods 20: 218–228. 10.1038/s41592-022-01728-4
- ↵Carvalho BS, Irizarry RA. 2010. A framework for oligonucleotide microarray preprocessing. Bioinformatics 26: 2363–2367. 10.1093/bioinformatics/btq431
- ↵Cecchi F, Lih CJ, Lee YH, Walsh W, Rabe DC, Williams PM, Bottaro DP. 2015. Expression array analysis of the hepatocyte growth factor invasive program. Clin Exp Metastasis 32: 659–676. 10.1007/s10585-015-9735-0
- ↵Cui H, López M, Rahmouni K. 2017. The cellular and molecular bases of leptin and ghrelin resistance in obesity. Nat Rev Endocrinol 13: 338–351. 10.1038/nrendo.2016.222
- ↵Cui A, Huang T, Li S, Ma A, Pérez JL, Sander C, Keskin DB, Wu CJ, Fraenkel E, Hacohen N. 2024. Dictionary of immune responses to cytokines at single-cell resolution. Nature 625: 377–384. 10.1038/s41586-023-06816-9
- ↵Davis S, Meltzer PS. 2007. GEOquery: a bridge between the Gene Expression Omnibus (GEO) and BioConductor. Bioinformatics 23: 1846–1847. 10.1093/bioinformatics/btm254
- ↵Dölken L, Ruzsics Z, Rädle B, Friedel CC, Zimmer R, Mages J, Hoffmann R, Dickinson P, Forster T, Ghazal P, 2008. High-resolution gene expression profiling for simultaneous kinetic parameter analysis of RNA synthesis and decay. RNA 14: 1959–1972. 10.1261/rna.1136108
- ↵Edgar R, Domrachev M, Lash AE. 2002. Gene Expression Omnibus: NCBI gene expression and hybridization array data repository. Nucleic Acids Res 30: 207–210. 10.1093/nar/30.1.207
- ↵Efremova M, Vento-Tormo M, Teichmann SA, Vento-Tormo R. 2020. CellPhoneDB: inferring cell–cell communication from combined expression of multi-subunit ligand–receptor complexes. Nat Protoc 15: 1484–1506. 10.1038/s41596-020-0292-x
- ↵Elsafadi M, Shinwari T, Al-Malki S, Manikandan M, Mahmood A, Aldahmash A, Alfayez M, Kassem M, Alajez NM. 2019. Convergence of TGFβ and BMP signaling in regulating human bone marrow stromal cell differentiation. Sci Rep 9: 4977. 10.1038/s41598-019-41543-0
- ↵Friedman JH, Hastie T, Tibshirani R. 2010. Regularization paths for generalized linear models via coordinate descent. J Stat Softw 33: 1–22. 10.18637/jss.v033.i01
- ↵Gu Z, Gu L, Eils R, Schlesner M, Brors B. 2014. circlize implements and enhances circular visualization in R. Bioinformatics 30: 2811–2812. 10.1093/bioinformatics/btu393
- ↵Hao Y, Stuart T, Kowalski MH, Choudhary S, Hoffman P, Hartman A, Srivastava A, Molla G, Madad S, Fernandez-Granda C, 2024. Dictionary learning for integrative, multimodal and scalable single-cell analysis. Nat Biotechnol 42: 293–304. 10.1038/s41587-023-01767-y
- ↵Hostager BS, Bishop GA. 2013. CD40-mediated activation of the NF-κB2 pathway. Front Immunol 4: 376. 10.3389/fimmu.2013.00376
- ↵Hou R, Denisenko E, Ong HT, Ramilowski JA, Forrest ARR. 2020. Predicting cell-to-cell communication networks using NATMI. Nat Commun 11: 5011. 10.1038/s41467-020-18873-z
- ↵Jiang P, Zhang Y, Ru B, Yang Y, Vu T, Paul R, Mirza A, Altan-Bonnet G, Liu L, Ruppin E, 2021. Systematic investigation of cytokine signaling activity at the tissue and single-cell levels. Nat Methods 18: 1181–1191. 10.1038/s41592-021-01274-5
- ↵Jin S, Guerrero-Juarez CF, Zhang L, Chang I, Ramos R, Kuan CH, Myung P, Plikus MV, Nie Q. 2021. Inference and analysis of cell-cell communication using CellChat. Nat Commun 12: 1088. 10.1038/s41467-021-21246-9
- ↵Jo HA, Han SS, Lee S, Kim JY, Yang SH, Lee H, Yang JS, Lee JP, Joo KW, Lim CS, 2019. The association of tumor necrosis factor superfamily 13 with recurrence of immunoglobulin A nephropathy in living related kidney transplantation. BMC Nephrol 20: 33. 10.1186/s12882-019-1222-4
- ↵Kanehisa M. 2019. Toward understanding the origin and evolution of cellular organisms. Protein Sci 28: 1947–1951. 10.1002/pro.3715
- ↵Kanehisa M, Goto S. 2000. KEGG: Kyoto Encyclopedia of Genes and Genomes. Nucleic Acids Res 28: 27–30. 10.1093/nar/28.1.27
- ↵Kanehisa M, Furumichi M, Sato Y, Matsuura Y, Ishiguro-Watanabe M. 2025. KEGG: biological systems database as a model of the real world. Nucleic Acids Res 53: D672–D677. 10.1093/nar/gkae909
- ↵Kiral FR, Cakir B, Tanaka Y, Kim J, Yang WS, Wehbe F, Kang YJ, Zhong M, Sancer G, Lee SH, 2023. Generation of ventralized human thalamic organoids with thalamic reticular nucleus. Cell Stem Cell 30: 677–688.e5. 10.1016/j.stem.2023.03.007
- ↵Klaus B, Reisenauer S. 2016. An end to end workflow for differential gene expression using Affymetrix microarrays. F1000Res 5: 1384. 10.12688/f1000research.8967.1
- ↵Korotkevich G, Sukhov V, Budin N, Shpak B, Artyomov MN, Sergushichev A. 2021. Fast gene set enrichment analysis. bioRxiv 10.1101/060012:060012
- ↵Kuhn M. 2008. Building predictive models in R using the caret package. J Stat Softw 28: 1–26. 10.18637/jss.v028.i05
- ↵Lawrence T. 2009. The nuclear factor NF-κB pathway in inflammation. Cold Spring Harb Perspect Biol 1: a001651. 10.1101/cshperspect.a001651
- ↵Lawson ND, Vogel AM, Weinstein BM. 2002. Sonic hedgehog and vascular endothelial growth factor act upstream of the notch pathway during arterial endothelial differentiation. Dev Cell 3: 127–136. 10.1016/S1534-5807(02)00198-3
- ↵Luoma AM, Suo S, Williams HL, Sharova T, Sullivan K, Manos M, Bowling P, Hodi FS, Rahma O, Sullivan RJ, 2020. Molecular pathways of colon inflammation induced by cancer immunotherapy. Cell 182: 655–671.e22. 10.1016/j.cell.2020.06.001
- ↵Mackenzie F, Ruhrberg C. 2012. Diverse roles for VEGF-A in the nervous system. Development 139: 1371–1380. 10.1242/dev.072348
- ↵Massenet-Regad L, Noël F, Soumelis V. 2021. [In silico study of cell to cell communication with ICELLNET]. Med Sci (Paris) 37: 981–983. 10.1051/medsci/2021137
- ↵Miyazono K, Kusanagi K, Inoue H. 2001. Divergence and convergence of TGF-beta/BMP signaling. J Cell Physiol 187: 265–276. 10.1002/jcp.1080
- ↵Molinero LL, Yin D, Lei YM, Chen L, Wang Y, Chong AS, Alegre ML. 2016. High-fat diet-induced obesity enhances allograft rejection. Transplantation 100: 1015–1021. 10.1097/TP.0000000000001141
- ↵O'Shea JJ, Schwartz DM, Villarino AV, Gadina M, McInnes IB, Laurence A. 2015. The JAK-STAT pathway: impact on human disease and therapeutic intervention. Annu Rev Med 66: 311–328. 10.1146/annurev-med-051113-024537
- ↵Pandey K, Bessières B, Sheng SL, Taranda J, Osten P, Sandovici I, Constancia M, Alberini CM. 2023. Neuronal activity drives IGF2 expression from pericytes to form long-term memory. Neuron 111: 3819–3836.e8. 10.1016/j.neuron.2023.08.030
- ↵Philips RL, Wang Y, Cheon H, Kanno Y, Gadina M, Sartorelli V, Horvath CM, Darnell JEJr, Stark GR, O'Shea JJ. 2022. The JAK-STAT pathway at 30: much learned, much more to do. Cell 185: 3857–3876. 10.1016/j.cell.2022.09.023
- ↵Qian C, Xin Y, Qi C, Wang H, Dong BC, Zack DJ, Blackshaw S, Hattar S, Zhou FQ, Qian J. 2024. Intercellular communication atlas reveals Oprm1 as a neuroprotective factor for retinal ganglion cells. Nat Commun 15: 2206. 10.1038/s41467-024-46428-z
- ↵Qin H, Chan MW, Liyanarachchi S, Balch C, Potter D, Souriraj IJ, Cheng AS, Agosto-Perez FJ, Nikonova EV, Yan PS, 2009. An integrative ChIP-chip and gene expression profiling to model SMAD regulatory modules. BMC Syst Biol 3: 73. 10.1186/1752-0509-3-73
- ↵R Core Team. 2023. R: a language and environment for statistical computing. R Foundation for Statistical Computing, Vienna. https://www.R-project.org/.
- ↵Ritchie ME, Phipson B, Wu D, Hu Y, Law CW, Shi W, Smyth GK. 2015. limma powers differential expression analyses for RNA-sequencing and microarray studies. Nucleic Acids Res 43: e47. 10.1093/nar/gkv007
- ↵Robinson MD, McCarthy DJ, Smyth GK. 2010. edgeR: a Bioconductor package for differential expression analysis of digital gene expression data. Bioinformatics 26: 139–140. 10.1093/bioinformatics/btp616
- ↵Rosenstein JM, Krum JM, Ruhrberg C. 2010. VEGF in the nervous system. Organogenesis 6: 107–114. 10.4161/org.6.2.11687
- ↵Sales G, Calura E, Cavalieri D, Romualdi C. 2012. Graphite: a Bioconductor package to convert pathway topology to gene network. BMC Bioinformatics 13: 20. 10.1186/1471-2105-13-20
- ↵Sanda C, Weitzel P, Tsukahara T, Schaley J, Edenberg HJ, Stephens MA, McClintick JN, Blatt LM, Li L, Brodsky L, 2006. Differential gene induction by type I and type II interferons and their combination. J Interferon Cytokine Res 26: 462–472. 10.1089/jir.2006.26.462
- ↵Scheja L, Heeren J. 2019. The endocrine function of adipose tissues in health and cardiometabolic disease. Nat Rev Endocrinol 15: 507–524. 10.1038/s41574-019-0230-6
- ↵Schubert M, Klinger B, Klünemann M, Sieber A, Uhlitz F, Sauer S, Garnett MJ, Blüthgen N, Saez-Rodriguez J. 2018. Perturbation-response genes reveal signaling footprints in cancer gene expression. Nat Commun 9: 20. 10.1038/s41467-017-02391-6
- ↵Seal RL, Braschi B, Gray K, Jones TEM, Tweedie S, Haim-Vilmovsky L, Bruford EA. 2023. Genenames.org: the HGNC resources in 2023. Nucleic Acids Res 51: D1003–D1009. 10.1093/nar/gkac888
- ↵Seleznik GM, Zoller J, O'Connor T, Graf R, Heikenwalder M. 2014. The role of lymphotoxin signaling in the development of autoimmune pancreatitis and associated secondary extra-pancreatic pathologies. Cytokine Growth Factor Rev 25: 125–137. 10.1016/j.cytogfr.2014.01.003
- ↵Sohn P, Cox M, Chen D, Serra R. 2010. Molecular profiling of the developing mouse axial skeleton: a role for Tgfbr2 in the development of the intervertebral disc. BMC Dev Biol 10: 29. 10.1186/1471-213X-10-29
- ↵Su J, Song Y, Zhu Z, Huang X, Fan J, Qiao J, Mao F. 2024. Cell–cell communication: new insights and clinical implications. Signal Transduct Target Ther 9: 196. 10.1038/s41392-024-01888-z
- ↵Tay JK, Narasimhan B, Hastie T. 2023. Elastic net regularization paths for all generalized linear models. J Stat Softw 106: 1–31. 10.18637/jss.v106.i01
- ↵Todd L, Finkbeiner C, Wong CK, Hooper MJ, Reh TA. 2020. Microglia suppress Ascl1-induced retinal regeneration in mice. Cell Rep 33: 108507. 10.1016/j.celrep.2020.108507
- ↵Toro AR, Maymó JL, Ibarbalz FM, Pérez-Pérez A, Maskin B, Faletti AG, Sánchez-Margalet V, Varone CL. 2014. Leptin is an anti-apoptotic effector in placental cells involving p53 downregulation. PLoS One 9: e99187. 10.1371/journal.pone.0099187
- ↵Wang S, Karikomi M, MacLean AL, Nie Q. 2019. Cell lineage and communication network inference via optimization for single-cell transcriptomics. Nucleic Acids Res 47: e66. 10.1093/nar/gkz204
- ↵Wickham H. 2016. ggplot2: elegant graphics for data analysis. Springer-Verlag, New York.
- ↵Wu M, Wu S, Chen W, Li YP. 2024. The roles and regulatory mechanisms of TGF-β and BMP signaling in bone and cartilage development, homeostasis and disease. Cell Res 34: 101–123. 10.1038/s41422-023-00918-9
- ↵Xin Y, Lyu P, Jiang J, Zhou F, Wang J, Blackshaw S, Qian J. 2022. LRLoop: a method to predict feedback loops in cell-cell communication. Bioinformatics 38: 4117–4126. 10.1093/bioinformatics/btac447
- ↵Xin Y, Jin Y, Qian C, Blackshaw S, Qian J. 2025. MetaLigand provides a prior-knowledge-guided framework for predicting non-peptide ligand mediated cell-cell communication. Cell Rep Methods 5: 101217. 10.1016/j.crmeth.2025.101217
- ↵Yeung TL, Sheng J, Leung CS, Li F, Kim J, Ho SY, Matzuk MM, Lu KH, Wong STC, Mok SC. 2019. Systematic identification of druggable epithelial-stromal crosstalk signaling networks in ovarian cancer. J Natl Cancer Inst 111: 272–282. 10.1093/jnci/djy097