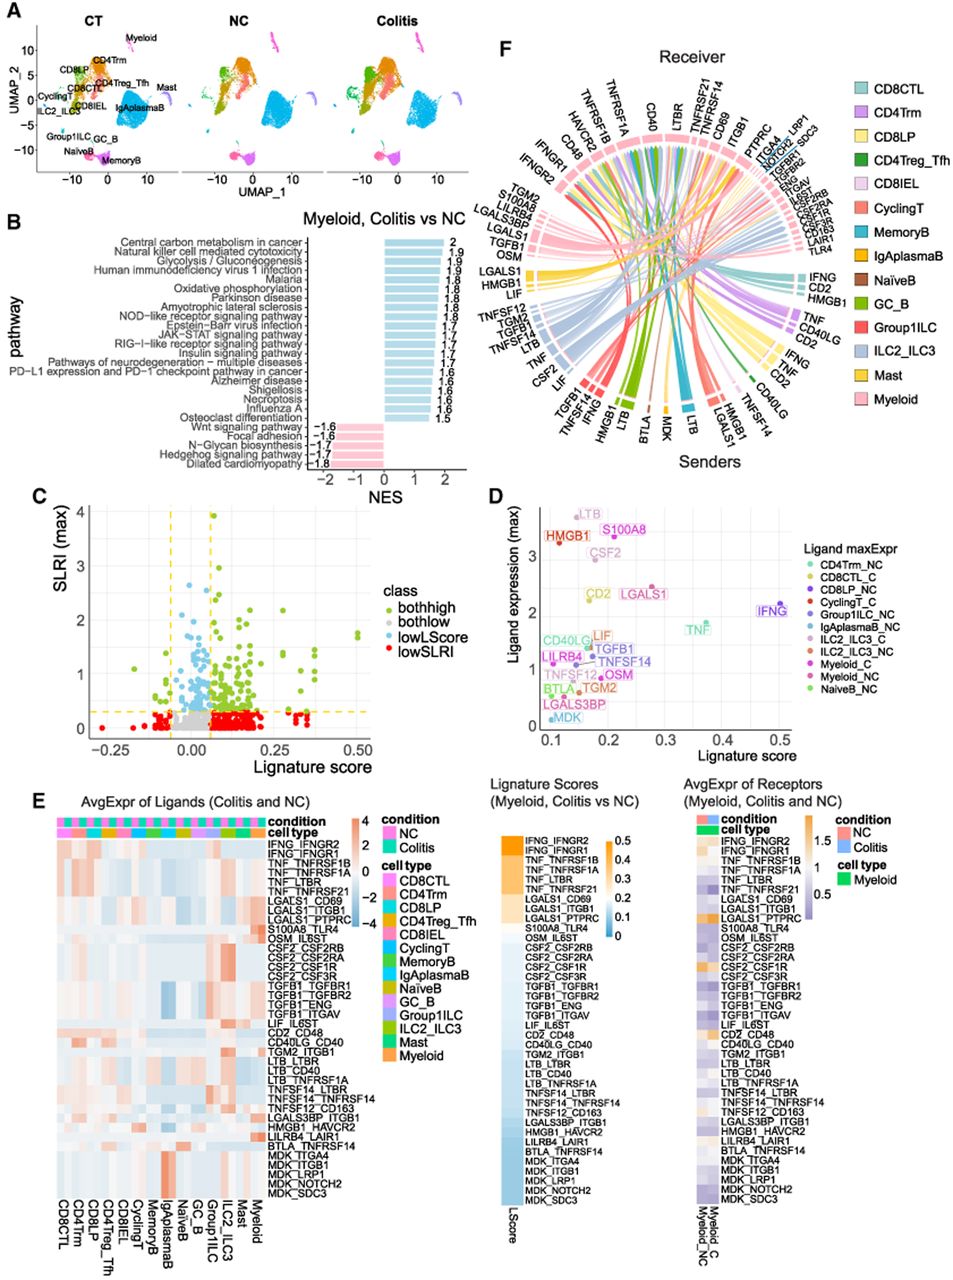
Application of Lignature on checkpoint blockade–associated colitis scRNA-seq data set. (A) UMAP dimensionality reductions show cell types identified in the scRNA-seq data of immune cell populations in checkpoint blockade–associated colitis and control samples. (B) Enriched upregulated and downregulated KEGG pathways in myeloid cells between colitis and normal colonic mucosa endoscopically and histologically (NC) samples. (C) Scatter plot of ligand signature similarity scores predicted by Lignature (x-axis) and the maximum LR interaction strengths calculated by the method NATMI across all sender cells and conditions (y-axis) for all LR pairs. (D) Scatter plot of similarity scores predicted by Lignature (x-axis) and the maximum average expression across all sender cells and conditions (y-axis) of the ligands for identified LR interactions (detection rate of the ligand genes above 0.25 in any cell type, detection rate of the receptor genes above 0.25 in myeloid, and ligand signature similarity scores above 0.1). (E) Heatmaps of ligand signature similarity scores predicted by Lignature (middle), the average expression of the ligands in all cell types identified in the colitis and NC samples (left), and the average expression of their receptors in myeloid cells in the colitis and NC samples (right) for LR interactions identified by the same criteria as in D. (F) Circular plot (generated using R package circlize) (Gu et al. 2014) of maximum interaction strengths calculated by NATMI across the colitis and NC samples, of the LR pairs from all cell types to myeloid, with detection rates of both the ligand and receptor genes above 0.25, ligand signature similarity scores above 0.1, and ligand expression in sender cells >75% of all cell types.