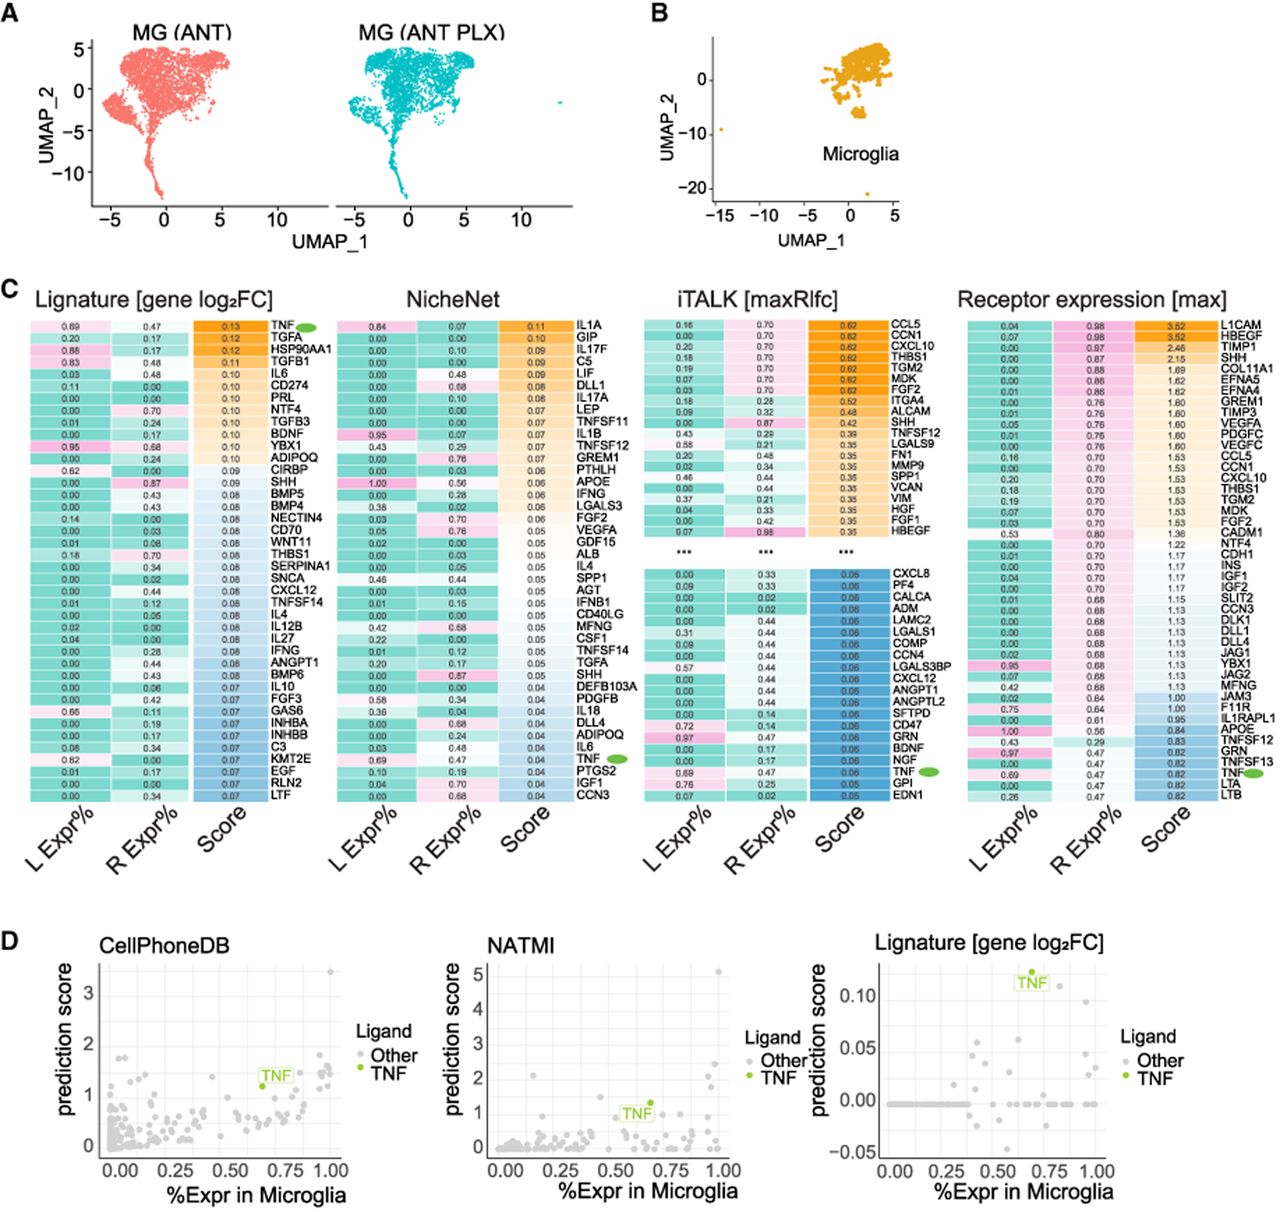
Application and assessment of Lignature on microglia and Müller glia (MG) regeneration scRNA-seq data set. (A,B) UMAP dimensionality reductions of the scRNA-seq data on microglia and MG before and after microglia ablation. (C) Heatmaps of the top predicted ligand scores from Lignature and three other methods, together with detection rate of the ligands in microglia and the maximum detection rate of their cognate receptors in MG before microglia ablation. (D) LR interaction strengths were calculated by CellPhoneDB and NATMI based on the expression of ligand genes in microglia and the expression of the receptors in MG, and each ligand was scored by the maximum interaction strength among the LR pairs between the ligand and its receptors. CellPhoneDB- and NATMI-induced ligand scores, as well as gene-level Lignature-predicted ligand scores, zeroed out by detection rates of the ligands and their receptors at 0.3, were plotted in scatter plots against the detection rates of the ligands in microglia.