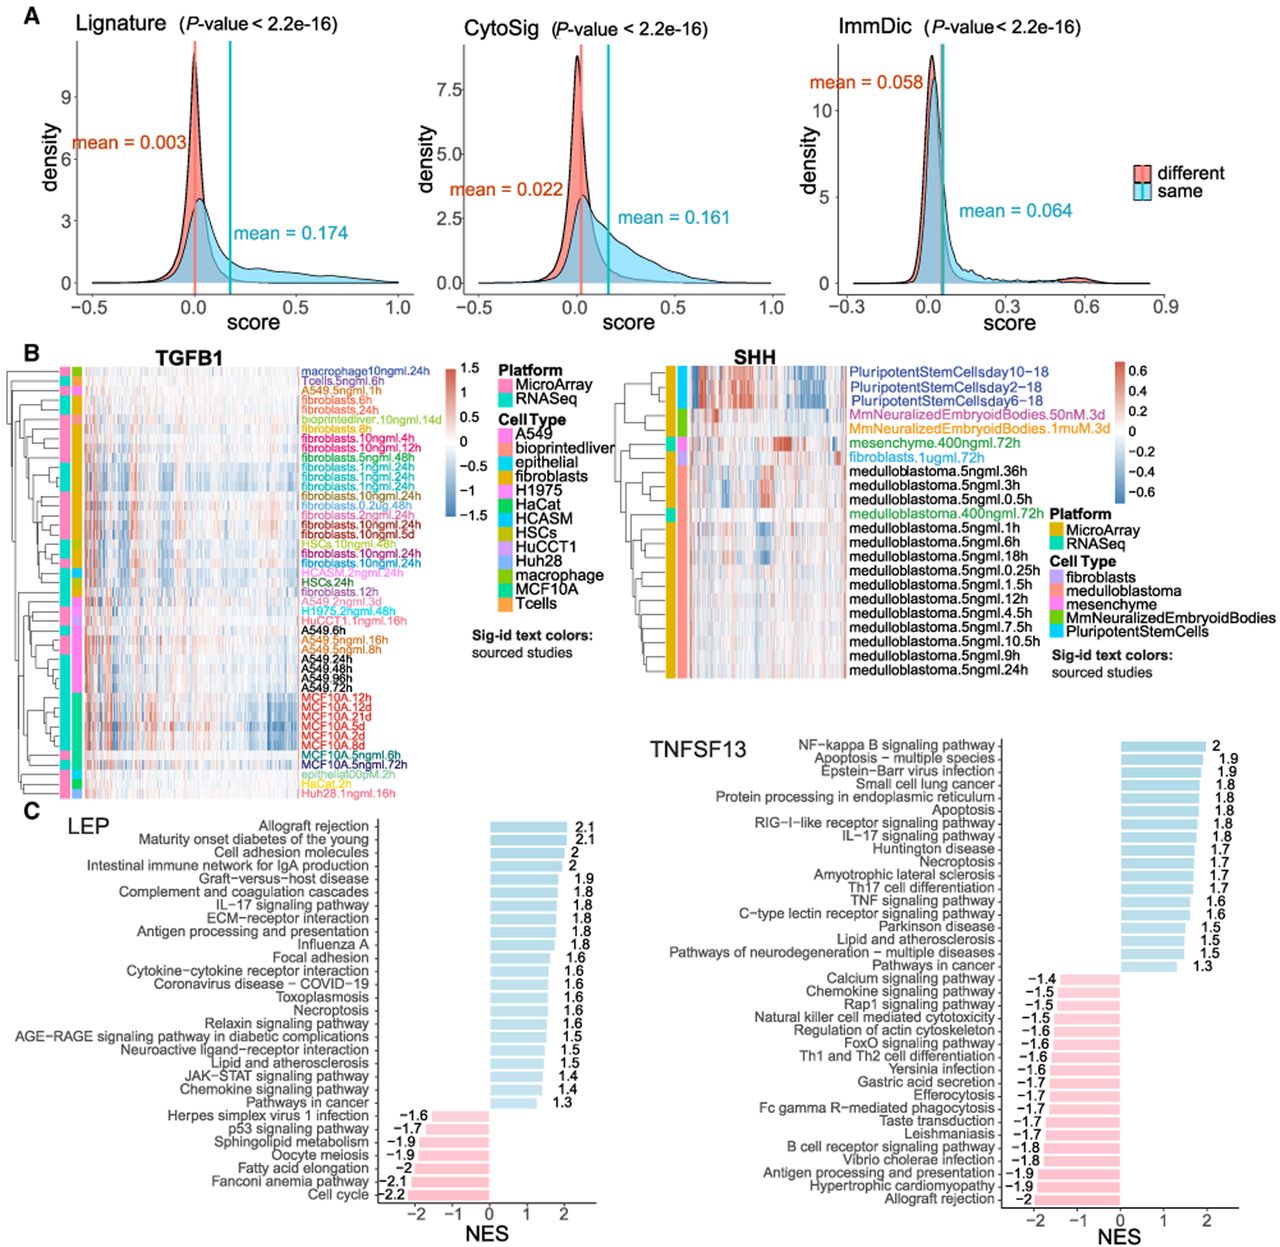
Figure 2.
Properties of ligand signatures in Lignature. (A) Distributions of Pearson correlation coefficients of gene-level signatures of the same ligand and signatures from different ligands. P-values were calculated using a KS test. (B) Heatmaps of sample gene-level signatures of TGFB1 and SHH (x-axis represents genes in the signatures) exhibit diversity in signatures for individual ligands. (C) Examples of enriched upregulated and downregulated KEGG pathways in sample ligand signatures (LEP and TNFSF13).