Figure 1.
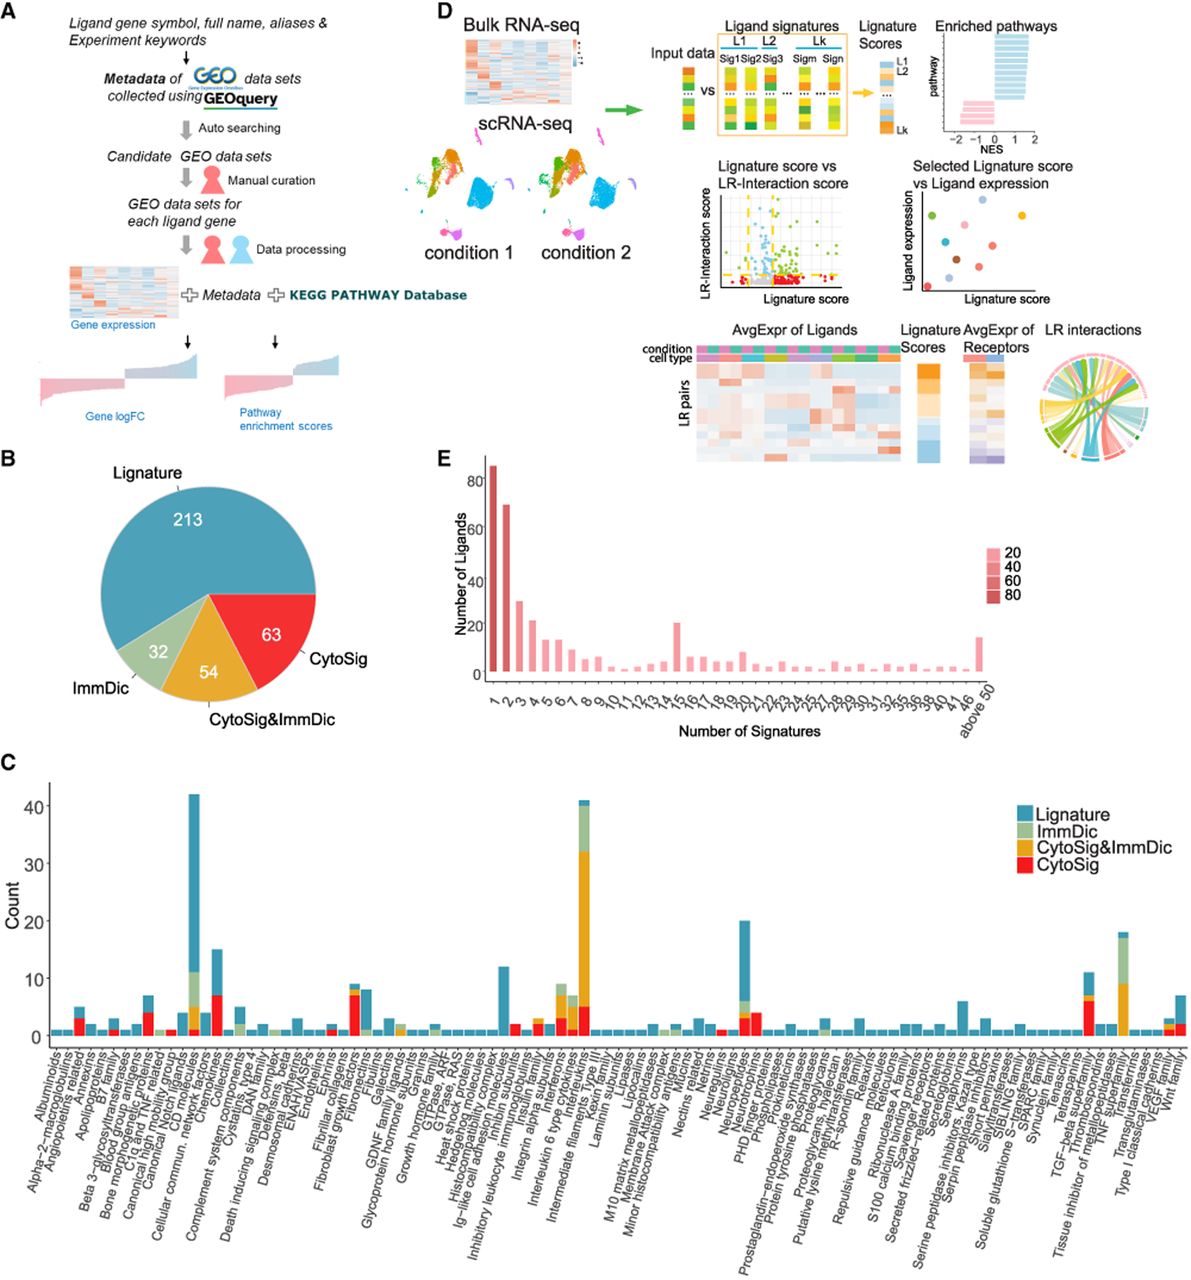
Curation and overview of Lignature. (A) Flowchart of generating the Lignature database. (B) Number of the ligands collected in the Lignature database from different data sources. (C) HUGO Gene Nomenclature Committee (HGNC) categories of the ligands curated in the Lignature database. (D) Schematic diagram of application of Lignature in predicting and visualizing LR interactions based on ligand signatures and LR expression. (E) Distribution of the number of signatures of each ligand in Lignature.