

Abstract
Genealogical ties leave traces beyond shared genetic material: relatives tend to share environmental exposures and cultural practices that persist across generations. Here, using genomic and electronic health record data from 13,143 individuals in the Biorepository and Integrative Genomics, we apply a hierarchical community detection algorithm that groups individuals into four major communities and 17 subcommunities based on the proportion of their genome shared identity-by-descent (IBD). This approach captures a fine-scale demographic structure beyond traditional ancestry classifications. By integrating neighborhood-level geographic data with census-derived environmental metrics, we reveal unequal exposure to environmental stressors between subcommunities, which correlates with differential rates of health conditions, including elevated respiratory condition prevalence in subcommunities under greater pollution burden. Through an interventional mediation analysis we find that a substantial part of the excess subcommunity-level risk remains unexplained by measured environmental factors alone, consistent with a contribution of unmeasured shared exposures captured by IBD-based grouping. Subcommunity-level disparities persist in sensitivity analyses adjusting for self-reported race, indicating that IBD-based clustering captures health-relevant information beyond demographic categories commonly used as proxies for social determinants of health. We implement an open-source dashboard for interactive exploration of IBD-defined communities, disease prevalence, and environmental exposures. Together, we demonstrate that IBD-based clustering jointly captures genetic and environmental determinants of health, offering a scalable framework for precision health and population genetics that translates biobank data into actionable insights.
Genomic studies increasingly rely on large biobanks that link genetic, clinical, and environmental data (Nait Saada et al. 2020; Belbin et al. 2021; Caggiano et al. 2023; Buonaiuto et al. 2025). How participants in these resources are grouped shapes which patterns of variation become detectable. Identity-by-descent (IBD) supports a grouping based on the genealogical relationships among individuals, inferred directly from the genome.
IBD refers to DNA segments shared by two individuals due to inheritance from a common ancestor (Palamara et al. 2012). Recombination progressively fragments these segments across generations, so the total amount of IBD shared decreases with genealogical distance. Close relatives, first and second degree, usually share more than just genetic material: their relationships are the foundation of many family systems (Itao and Kaneko 2021) and typically reflect shared culture, social norms, and environments. These ties extend beyond close kin: even distant relatives can share cultural traits passed through generations of slowly evolving social norms, as observed by Cavalli-Sforza (1986).
To study population structure, the common practice of categorizing individuals into discrete genetic groups faces challenges that go beyond technical limitations. Such categorizations impose artificial boundaries on what is fundamentally a continuous spectrum of human genetic variation (Dobzhansky 1962; Barbujani and Colonna 2010), and depend on predefined reference populations whose composition is itself the product of sampling decisions (Barbujani et al. 1997; Rosenberg et al. 2002; Maples et al. 2013). IBD-based grouping addresses these limitations by recovering population structure directly from genealogical relationships among participants, without recourse to external reference panels (Browning and Browning 2011; Ralph and Coop 2013; Browning et al. 2018; Dai et al. 2020; Nait Saada et al. 2020; Belbin et al. 2021; Naseri et al. 2021; Gilbert et al. 2022; Caggiano et al. 2023; Shemirani et al. 2026). Recent consensus statements from the National Academies of Sciences and editors of biomedical journals converge in this direction, calling for the differentiation of genetic ancestry from race and ethnicity and supporting reference-free frameworks where possible (National Academies of Sciences, Engineering, and Medicine 2023; Feero et al. 2024). Self-reported race and ethnicity categories retain practical value in U.S. clinical settings, where researchers often argue they function as proxies for social and environmental factors such as residential context and access to care (Manski et al. 2023).
In this study, we used data from the Biorepository and Integrative Genomics (BIG) cohort (Buonaiuto et al. 2025) to build IBD-based communities that integrate genomic, clinical, and environmental information, providing a scalable framework to study health disparities and the cosegregation of genealogy and environment at biobank scale. The BIG resource provides comprehensive electronic health records (EHR), neighborhood-level environmental data linked through ZIP codes, and genomic information from 13,143 participants (exome sequencing with a Regeneron genotyping spike targeting ≈1.4 M additional sites, yielding 6,886,631 variable sites after quality control), with particular emphasis on pediatric populations. A key feature of BIG is its representation of high genetic diversity concentrated within a relatively confined geographic area.
We therefore ask what IBD-based grouping recovers in this cohort: how closely it tracks inferred ancestry and residential geography, and how much of the health disparity it reveals can be attributed to measured neighborhood exposures rather than to exposures no record captures.
Results
Capturing population structure using information from genomic segments shared identical by descent
The BIG initiative has enrolled over 42,000 participants with linked EHRs and collected more than 15,000 biosamples (Supplemental Fig. S1). The cohort is predominantly pediatric (87% under 18 years), spanning ages from infancy to 90 years (mean = 8.4, median = 6.2) (Buonaiuto et al. 2025). Unlike typical pediatric cohorts of healthy mother–child pairs, BIG focuses on children with diverse diseases and ancestry backgrounds.
To assess population structure, we performed identity-by-descent (IBD) analysis, which infers genetic relationships directly from shared genomic segments (Zhou et al. 2020). Total pairwise IBD was calculated as the sum of the length (cM) of all shared segments between individuals. The distribution of total pairwise IBD is strongly right-skewed (Fig. 1A), with a fast-decaying bulk and a heavier tail from the more closely related pairs, consistent with distant-relative pairs far outnumbering closer kinship (Nait Saada et al. 2020; Shemirani et al. 2021; Caggiano et al. 2023).
Identity-by-descent (IBD) community detection on the BIG cohort. (A) Distribution of total IBD (cM) detected. (B) IBD-based network with 13,143 nodes, revealing four denser areas surrounded by sparse zones, suggesting a structured network. Fruchterman-Reingold layout was used to do the plot (Gajdoš et al. 2016). (C) Community sizes after the first Leiden stage (C1 to C4), and size of the subcommunities (small case letters on bars) derived from the second Leiden stage. (D) PCA plot showing sample distribution across the first two PCs. Colors represent the communities. The first two principal components explain 76% of the variance among the leading 20 principal components (6.8% of the total genetic variance), the leading axis reflecting continental structure. (E) Network of subcommunities highlighting diversity and inter-connectivity (Fruchterman-Reingold layout). Connections between subcommunities are based on total IBD.
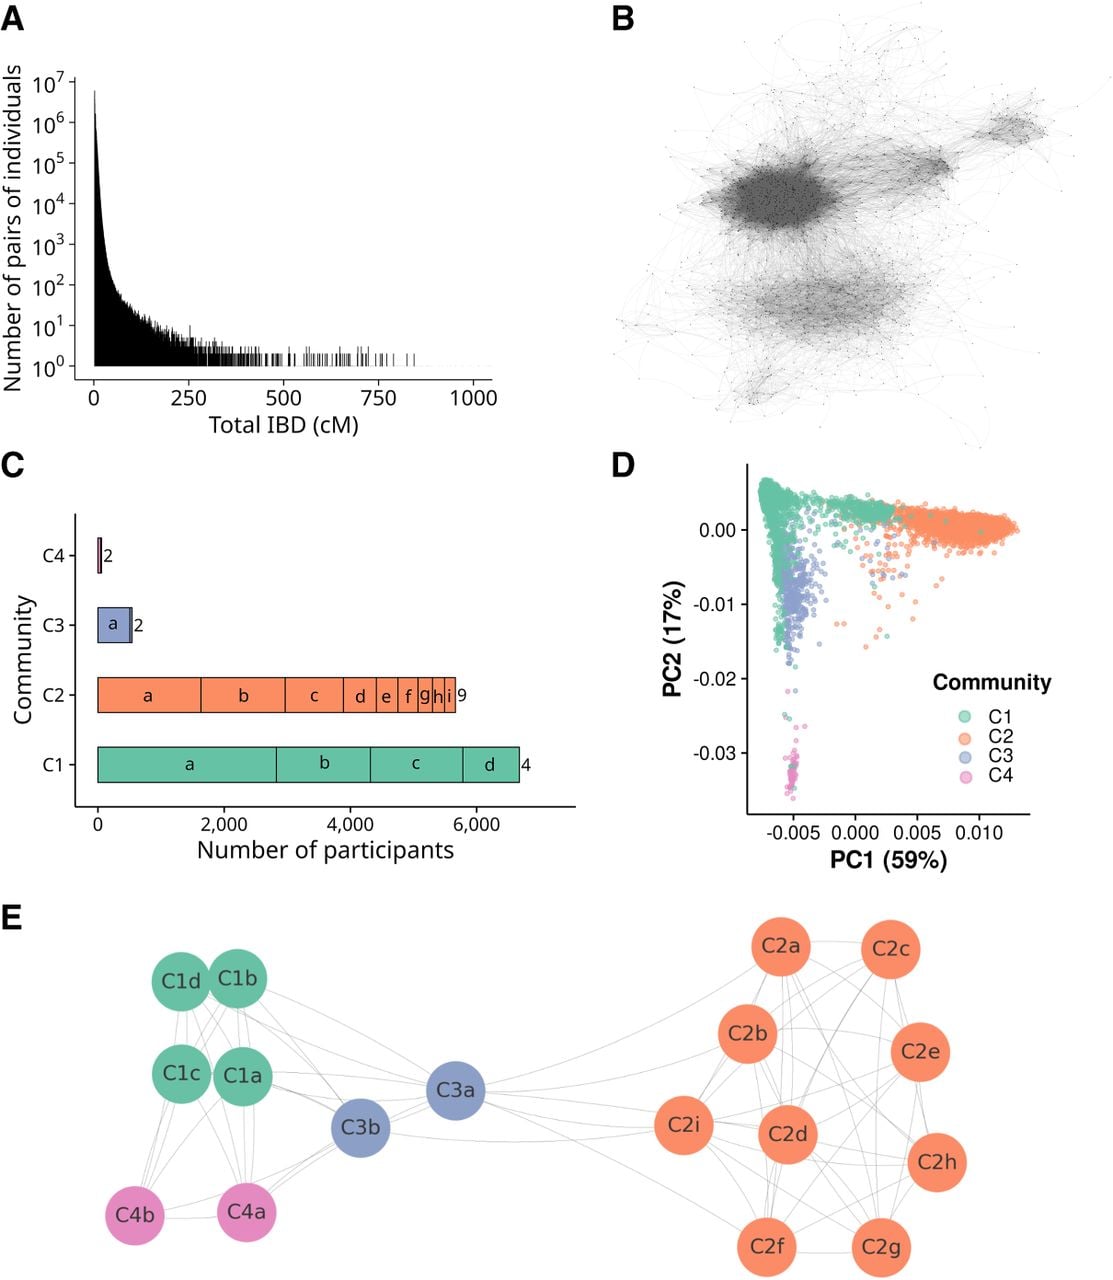
We constructed an IBD network, where nodes represent individuals (n = 13,143) and edge weights are proportional to shared IBD. The network’s global density (0.018), the fraction of all possible pairs that share detectable IBD, together with an average degree of 241.15 (each individual shares IBD with ∼241 others on average), indicates a well-connected structure while still resolving four dense clusters separated by sparse regions (Fig. 1B). Using the Leiden algorithm (Anuar et al. 2021), we performed community detection in two stages. We first ran Leiden on the full IBD network of all individuals, identifying four major communities (C1–C4), two of which contained more than 5000 individuals. We then ran Leiden independently within the subgraph of each of these communities, which together yielded 17 subcommunities (Fig. 1C).
The community classification corresponds well with the population structure revealed by PCA of autosomal genetic markers, with clear separation between communities (Fig. 1D). This concordance between discrete community assignments and continuous genetic variation, both inferred from the same genomic data, is consistent with communities reflecting non-arbitrary genealogical structure rather than artificial partitions. Despite this overall trend, we also notice individuals positioned between the main groups in the PCA space, as well as some individuals from one community who fall within the region predominantly occupied by a different community. As an example, C1 individuals in C2 space would be assigned to C2 based on their position in the PCA-based classification; however, the IBD-based approach places them in C1 due to detected signals of relatedness (up to third degree), highlighting the additional power of relationship-based community detection over purely dimensional-reduction-based methods.
At a higher level, a network of subcommunities (Fig. 1E) shows that the number of subgroups does not correlate with parent community size, suggesting that internal genetic diversity influences subdivision. Community C2 exhibits the highest genetic diversity and the greatest number of subcommunities, supported by pairwise FST values (Supplemental Fig. S2). In contrast, C1 subcommunities are more closely connected, indicating closer relationships among members, whereas C3 connects to both C1 and C2, probably reflecting shared ancestry patterns.
IBD communities reflect geographical ancestry with fine-scale substructure
Having determined IBD-based communities, we next asked whether they corresponded to global ancestry previously inferred from reference populations (Buonaiuto et al. 2025). We found enrichment of EUR-inferred ancestry (91%) in C1, AFR-inferred (49%) with EUR–AFR admixed components (39%) in C2, EUR–7AMR admixed (51%) with multicomponent admixture (43%) in C3, and EAS-inferred (81%) in C4 (Fig. 2A, Supplemental Fig. S3). Community and ancestry, both inferred from the same genomic data, showed strong concordance (Cramér’s V = 0.81).
Genetic and demographic patterns across sub-communities. (A) Inferred continental and admixed ancestries per community from previous work. (B) Ancestry’s role in the IBD-network. Connectivity ratio for each node was defined as its degree divided by the mean degree of its IBD community. Values greater than 1 indicate higher connectivity compared to the average. Betweenness measures the centrality of individuals in communities; individuals with betweenness above 1 are more central, whereas values below 1 indicate more peripheral individuals. (C) Heatmap showing mean IBD values between subcommunities and reference populations, highlighting distinct genetic relationships across C1 to C4. (D) Distribution of self-reported race (HL7 v2.5 categories), and (E) self-reported Hispanic/Latino ethnicity proportions within subcommunities.
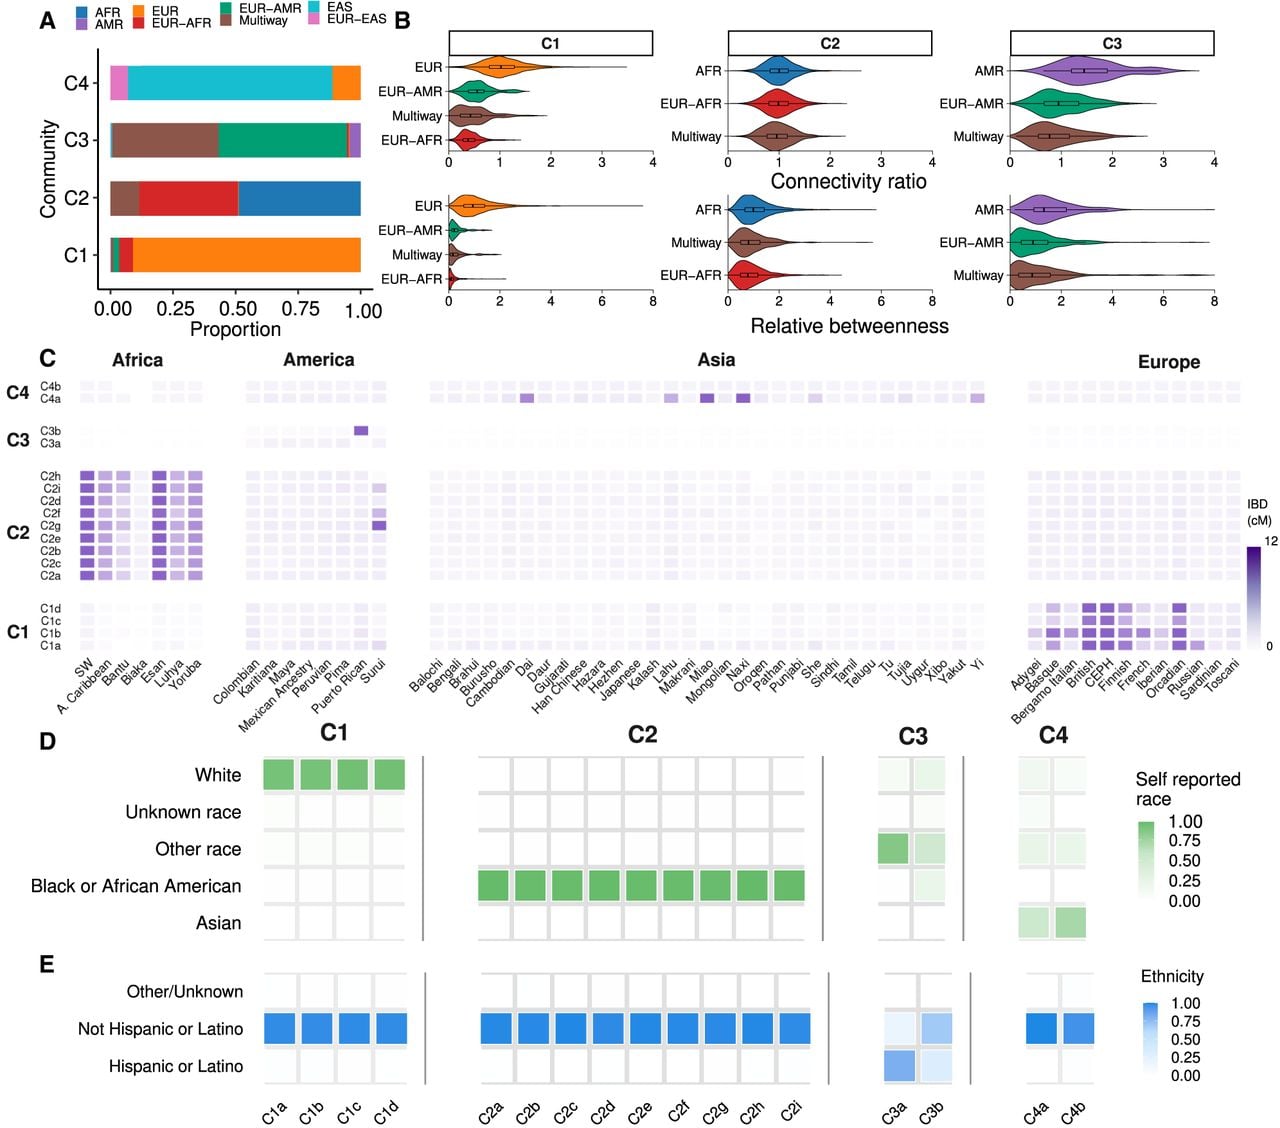
We characterized the relationship between ancestry and network topology by computing each BIG individual’s connectivity (degree link strength) and betweenness (path-based centrality). Stratification by ancestry revealed that individuals with predominantly EUR-inferred ancestry in C1, predominantly AFR-inferred in C2, and predominantly AMR-inferred in C3 tend to act as hub–bridge nodes, mediating many connections and shortest paths (Fig. 2B). In contrast, individuals with multicomponent ancestry inference tend to exhibit lower connectivity and betweenness, occupying more peripheral network positions; we note this as a descriptive pattern, since IBD connectivity reflects recent kinship rather than ancestry composition. Those with multiway (≥3 components) ancestry profiles tend to fall into low-degree, low-betweenness niches, whereas certain moderately connected nodes display elevated betweenness, acting as critical inter-community bridges. C4 subcommunities were not analyzed due to their smaller size.
To further characterize communities and subcommunities, we measured IBD sharing between BIG subcommunities and the HGDP-1kGP reference panels. The IBD sharing patterns align with the ancestry correlations we previously inferred (Fig. 2C). However, the fine-scale subcommunity structure suggests subtle demographic events that shaped genetic diversity within broader continental groups. For example, subcommunity C3b showed a stronger relationship with the Puerto Rican population, characterized by its three-way ancestry pattern (Browning et al. 2018; Mas-Sandoval et al. 2023), whereas C3a was more closely associated with Peruvian and other AMR populations. This subdivision suggests multiple waves or routes of population movement and mixing within C3. Likewise, within C2 (predominantly enriched in AFR-inferred ancestry), the connections of subcommunity C2g with Surui (HGDP population from America superpopulation) might indicate shared ancestry components that transcend simple continental divisions, possibly reflecting more recent demographic events.
After characterizing community structure through genetic measures, we next examined how communities aligned with participants’ self-reported race and ethnicity (Fig. 2D–E). Similar to what was observed for IBD sharing with reference populations, whereas community-level patterns aligned with self-reported categories as expected for an urban U.S. cohort with documented residential segregation history (C1: 91% white, C2: 97% Black/African American, C4: 62% Asian), subcommunity analysis reveals important nuances. Most notably, C3 subcommunities diverge markedly. In terms of self-reported race, C3a is predominantly Other race (73%), whereas C3b shows a three-way split across Other race (33%), White (21%), and Black/African American (21%). In terms of self-reported ethnicity, individuals in C3a were more likely to self-identify as Hispanic or Latino (72.3%), whereas those in C3b predominantly self-report as Not Hispanic or Latino (69.6%).
IBD sharing reflects shared environments in the BIG cohort
To elucidate the spatial distribution of genetic relationships, we examined whether subcommunities exhibit distinct geographical patterns and how these relate to IBD. Specifically, we geolocated BIG participants’ ZIP codes at the neighborhood level using publicly available spatial polygons (Pebesma and Bivand 2018), and then analyzed whether genetically determined subcommunities cluster geographically. We detected a strong association between genealogical and geographical distances (exponential fit R2 = 0.969, p-value < 0.0001, Fig. 3A, Supplemental Fig. S4). Nearly half (49%) of close relatives (first- and second-degree) lived in the same neighborhood, whereas the remaining pairs typically resided 4–6 km apart. Third- and fourth-degree relatives showed greater separation, though still within 20 km, with 34.3% sharing the same neighborhood. Beyond the seventh or eighth degree, geographic distance increased sharply; only 4.45% of eighth-degree or more distant relatives lived in the same neighborhood.
Genealogy, environment and geography of BIG communities. (A) Relationship between genealogical (degree of relationship) and geographical (km) distances. Exponential fit is shown. (B) Social determinants of health similarity index at neighborhood level across communities. The diagonal of the matrix is not shown and corresponds to the maximum (100%) identity. (C) IBD sharing measured as median pairwise IBD (cM) between pairs of different subcommunities. (D) Maps centered on the city of Memphis showing the geographical distribution of individuals from three subcommunities (C2a, C2e, and C2h) from community C2. (E) Social determinants of health by subcommunities. PM2.5 EJ index is an environmental justice metric derived from the ambient concentration of fine particulate matter; red line indicates the 90th percentile, above which indicates high risk. Smoking prevalence, social vulnerability index, and urbanization are also reported.
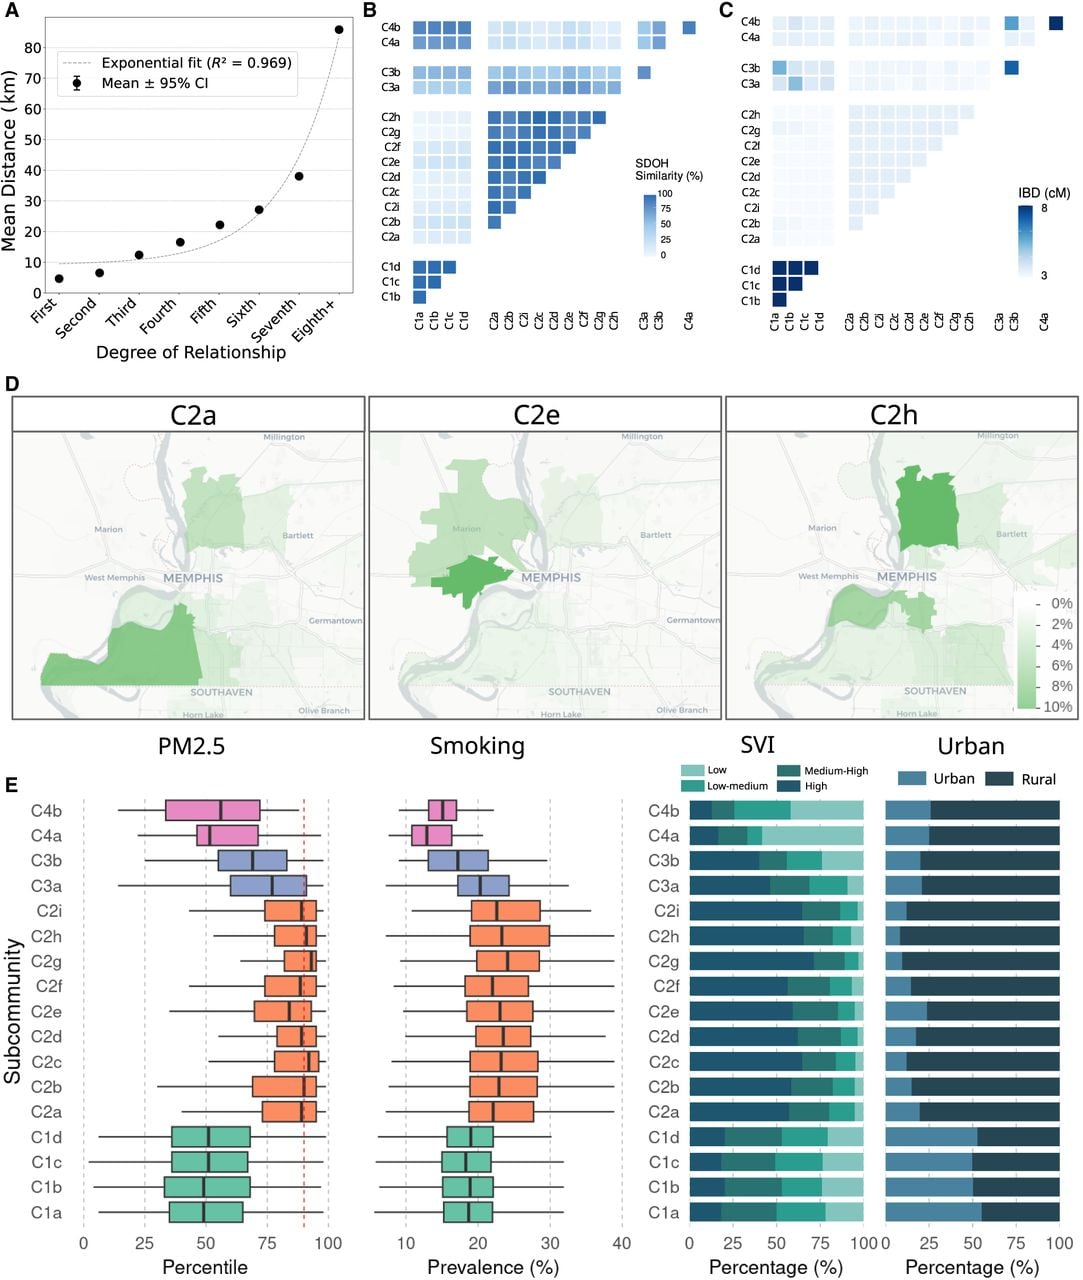
We used ZIP codes to link communities to social determinants of health (SDoH), that is, nonmedical factors influencing health outcomes. All SDoH values were obtained from publicly available data sets. Complete results, including interactive visualizations and detailed methodology, are available on our dedicated website (see Data access). We quantified SDoH similarity across subcommunities using mean SDoH and found that subcommunities within the same community shared highly similar social environments, whereas communities differed markedly from each other (Fig. 3B). This pattern held even for C1, whose subcommunities maintained 96% SDoH similarity despite being the most geographically dispersed (median distance 88.6 km between individuals vs. 18.9–22.1 km for C2 and C3, Supplemental Fig. S5B). Conversely, C2 exhibited the greatest social heterogeneity among its subcommunities while occupying a smaller geographic area than C1 (Supplemental Fig. S5B). SDoH similarity is strongly correlated with mean IBD sharing within and between subcommunities. To account for nonindependent pairwise entries, we tested the association using a Mantel permutation. We find a monotonic association (Mantel Spearman’s ρ = 0.747, p = 2.0 × 10⁻⁴), demonstrating that communities with similar SDoH share greater genetic relatedness (Fig. 3C). In addition, the nuanced variation in SDoH within C2 is reflected in overall lower IBD sharing within C2. The spatial separation of C2 subcommunities likely explains their SDoH variation. For example, subcommunities C2a, C2e, and C2h occupy distinct western, central, and eastern regions of Memphis respectively (Fig. 3D, Supplemental Fig S5A), demonstrating how IBD-based clustering captures the interplay between genetic relatedness, geographic separation, and differential social environments.
Large differences between communities and more subtle differences between subcommunities also appear when examining in more detail key SDoH factors with direct impacts on clinical outcomes. As shown in Fig. 3E, subcommunities within group C2 exhibit elevated PM2.5 Environmental Justice (EJ) index values, indicative of higher pollution levels, coupled with increased urban residency and smoking prevalence. Moreover, the Social Vulnerability Index reveals that a substantial fraction of C2 resides in high-risk areas, a trend that is also seen, though less pronounced, in C3.
Health condition patterns in subcommunities reflect differential environmental exposure
Having assessed the differential environmental exposures across communities and subcommunities, we next examined whether these differences translate into disparities in disease incidence. We mapped the ICD-9/10 codes from the BIG electronic health records to PheCode categories. Across all subcommunities, healthcare contact was broadly comparable (median 8.7 visits annually, 38 total per individual; Fig. 4A), whereas disease-category prevalence differed markedly across communities (Fig. 4B) (Eisenberg et al. 2007; Tran et al. 2023).
Health conditions across subcommunities. (A) Bar plot illustrating the median number of hospital visits per individual in subcommunities. Mean and maximum are also indicated. (B) Heatmap showing the proportion of phenotypes coded by PheCodes at the main community level (C1, C2, C3, C4), with each cell reflecting the percentage of individuals displaying a specific category (e.g., Respiratory, Neurological, Infections, etc.). (C) Regression between prevalence and PM2.5 for Neurological and Respiratory conditions. Each dot represents one subcommunity, colored by its parent community. (D) Proportion of phenotypes at the subcommunity level and 95% confidence intervals, colored by community C1, C2, C3. Subcommunities from C4 were excluded due to the high uncertainty associated with fewer individuals (complete results are shown in Supplemental Fig. S6).
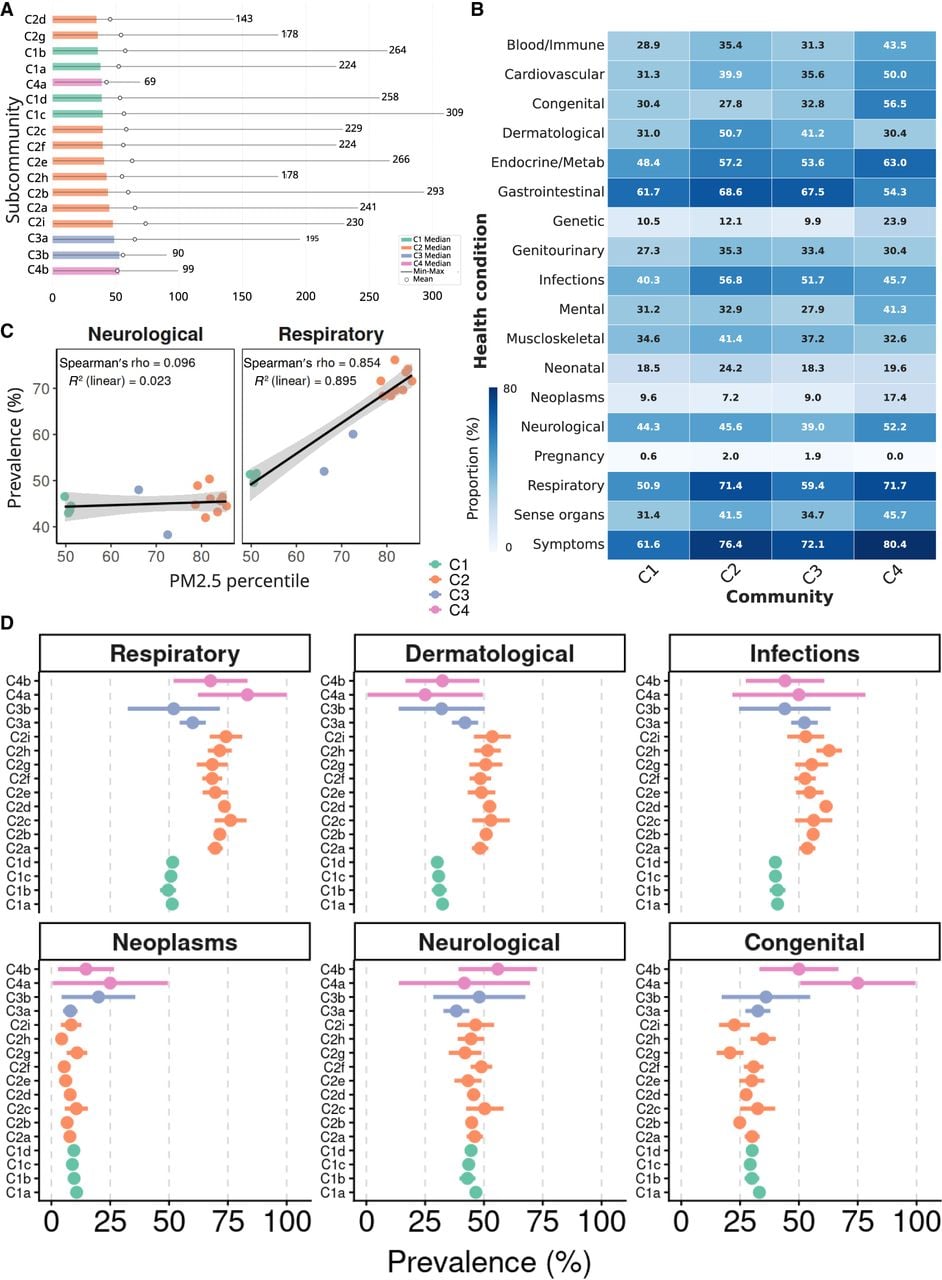
In this Memphis cohort, C2 showed a particularly high prevalence of respiratory diseases (71.4%), infections (56.8%), and dermatological conditions (50.7%). In contrast, neurological and congenital disorders show more homogeneous distributions across communities (lower between-community heterogeneity; τ2 = 0.006 and 0.03, respectively; Supplemental Table S1). We evaluated disease prevalence across the aforementioned categories at the subcommunity level. Although these categories are broad and warrant detailed case-by-case analysis, we observed a clear pattern: communities showed variable prevalence for the most between-community-heterogeneous categories (respiratory, dermatological, infectious; highest τ2) and consistent prevalence for the least heterogeneous ones (neurological and mental); the mediation analysis below attributes only about one-third of this differential prevalence to measured environmental exposure, with the majority remaining an unexplained independent component (Fig. 4D). In line with what has been described so far, C2 has the largest variance across subcommunities in many cases, especially in congenital disorders that appeared generally similar across communities, with some cases, C2g and C2i, exhibiting a lower prevalence of congenital conditions.
Combining the population structure, environmental factors, and health conditions, we detected that fine particulate matter exposure was strongly associated with the respiratory disease burden across subcommunities: PM2.5 explained most of the variation in respiratory prevalence (Spearman’s ρ = 0.85, R2 = 0.90), whereas no meaningful association was observed for neurological disorders (ρ = 0.10, R2 = 0.02; Fig. 4C).
Importantly, as a sensitivity analysis, we further adjust for per-individual encounter count directly in the decomposition (see below, Supplemental Table S2), where the community-level disparities persist.
Decomposing the sources of subcommunity health disparities
Up to this point, we have established that IBD-defined communities reflect ancestry and geography, with subcommunities sharing environmental exposures and showing enrichment for specific health conditions. Now, we ask whether we can take a further step by disentangling the sources of these differences. Specifically: how much is attributable to measured environmental and socioeconomic factors, and how much remains unexplained? To answer this, we implemented an interventional mediation analysis treating IBD subcommunity membership as the exposure, with age and sex as baseline covariates (Fig. 5A).
Prevalence of health conditions and decomposition of community effects on health. (A) Directed acyclic graph (DAG) summarizing assumed relationships among baseline confounders (D), exposure (IBD subcommunity, C), mediators (environment, E), and outcome (health, H); the environmental mediator node E encompasses residential location and the neighborhood exposures it determines, which therefore lie on the community–health path (C → E → H) as mediators rather than confounders and are not conditioned on. (B) Number of individuals with influenza, asthma, epilepsy, and dermatitis by community (C1–C3). (C) Risk difference (RD) relative to a reference community (C1c) for each condition, decomposed into the independent factor (IF; blue), the environmentally mediated effect (EME; orange), and the total effect (TE; black); points denote estimates and horizontal bars indicate 95% confidence intervals. The vertical dashed line marks RD = 0. (D) Total effect for each subcommunity comparing the standard set of confounders (Age + Sex) with the addition of self-reported race. (E) Number to be treated analysis showing the number of individuals whose disease could be prevented through equalization of environmental exposures (EME), and the number requiring further investigation of IBD-community-specific factors (IF).
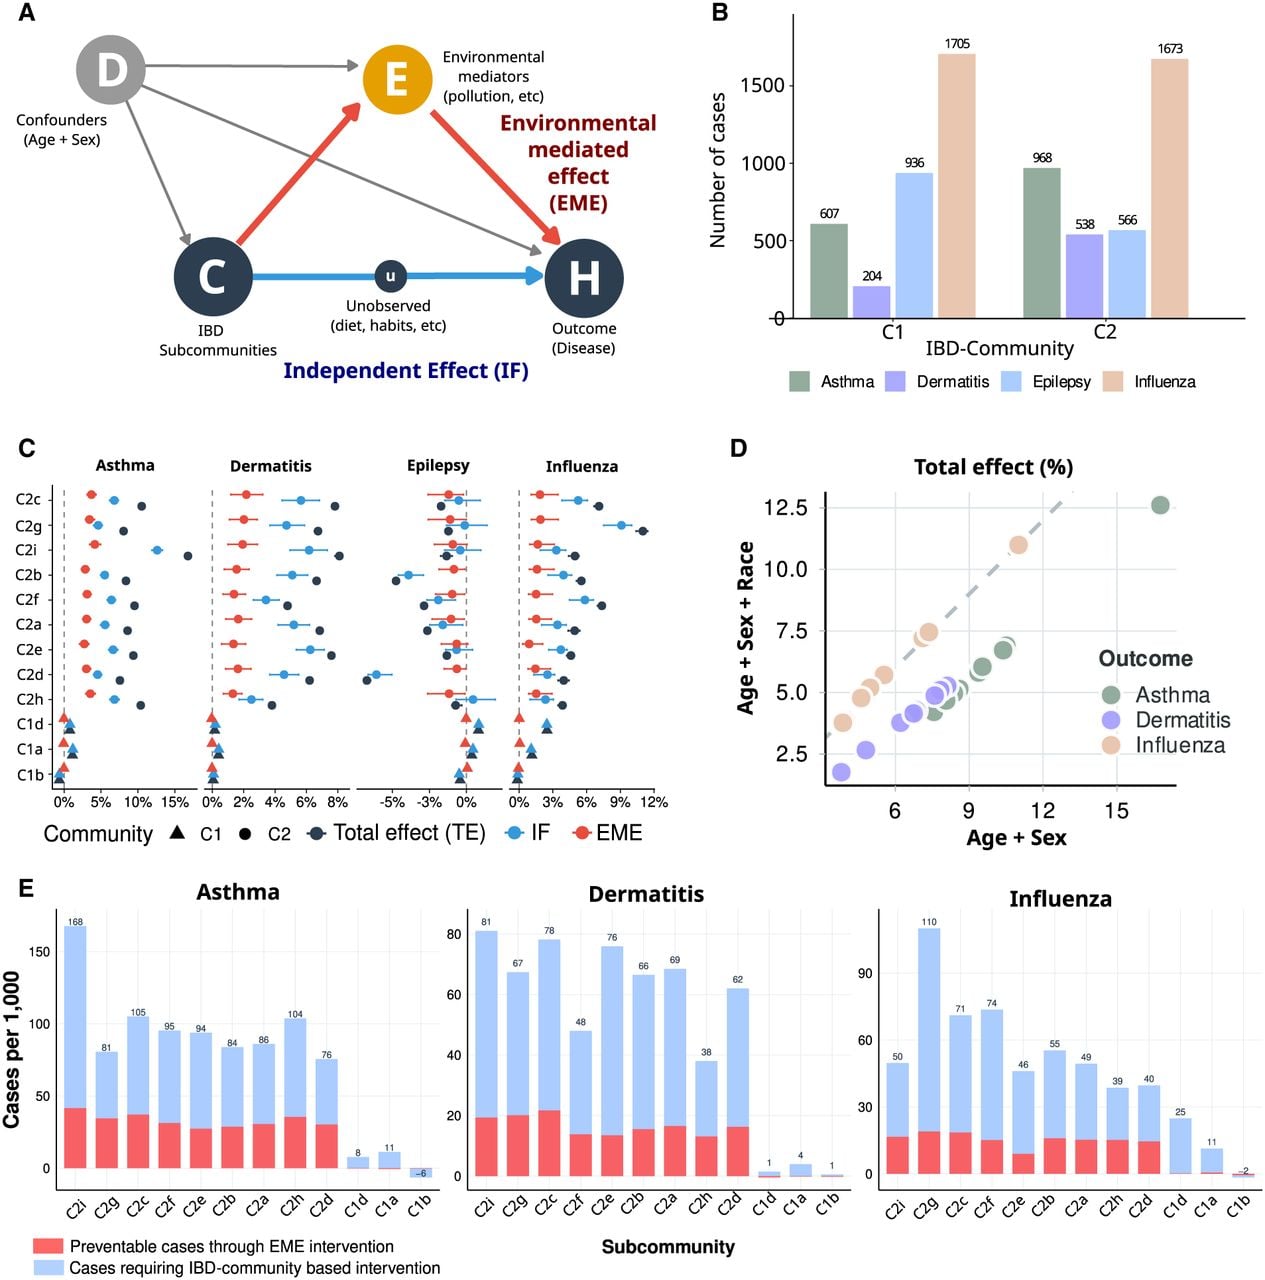
We focused on four pediatric-relevant outcomes selected a priori based on epidemiological evidence linking environmental exposures (PM2.5, poverty) to disease risk: asthma (n = 1757), dermatitis (n = 742), epilepsy (n = 1502), and influenza (n = 3378) (Fig. 5B). This focused, hypothesis-driven design prioritizes statistical precision in the mediation decomposition over exploratory breadth. For each outcome, we specified a priori a parsimonious set of neighborhood-level environmental mediators: PM2.5 air pollution and poverty (PPOV) rate for respiratory and dermatological conditions; obesity prevalence, smoking prevalence, and PPOV for infections.
First, we estimated for each subcommunity the absolute difference of disease risk (risk difference, RD, or total effect) relative to subcommunity C1c, the most populous C1 subcommunity (n = 2,807) (the decomposition conclusions are robust to this choice, Supplemental Table S3). All nine C2 subcommunities exhibited a significantly elevated risk of disease prevalence for asthma (mean RD = +9.9 percentage points [pp]; range: 7.6–16.8 pp), dermatitis (mean RD = +6.5 pp; range: 3.8–8.1 pp) and influenza (mean RD = +5.9 pp; range: 3.9–11.0 pp), with 95% confidence intervals excluding zero (Fig. 5C). Epilepsy showed an opposite pattern, with some C2 subcommunities exhibiting modestly lower risk near zero (mean RD = −2.6 pp; range: −6.7 to −0.7 pp).
We then separated the total risk difference (Total Effect, TE) into (i) an environmentally mediated effect (EME): the portion of risk attributable to environmental mediators, that is, PM2.5, poverty, and other SDoH-variable exposures (C → E → H), and (ii) an independent factor (IF): the residual component not explained by those mediators, and potentially explained by unmeasured factors captured by the IBD-community (C → u → H). Our data show that EME explains approximately one-third of the excess disease burden, with the majority assigned to IF; because exposures are measured at the ZIP-code level, this IF share is an upper bound. EME ranged from 2.7 to 4.2 pp for asthma, 1.3 to 2.2 pp for dermatitis, and 0.9 to 1.9 pp for influenza. On average across C2 subcommunities, environmental mediation accounted for 33% of the total effect for asthma, 26% for dermatitis, and 28% for influenza. In contrast, IF, the residual risk elevation not explained by measured mediators, was substantial: 4.5 to 12.6 pp for asthma, 2.5 to 6.2 pp for dermatitis, and 2.3 to 9.1 pp for influenza. Subcommunity C2i exhibited the largest total and residual effects for asthma (TE = 16.8 pp; EME = 4.2 pp; IF = 12.6 pp), whereas C2g showed the highest effects for influenza (TE = 11.0 pp; EME = 1.9 pp; IF = 9.1 pp). On average, IBD-defined subcommunities retained an independent component ranging from 67% to 74% across outcomes (Supplemental Fig. S7). Overall, we concluded that the IF likely reflects a combination of genetic factors, unmeasured environmental exposures (e.g., diet, indoor air quality, healthcare utilization patterns), and social/cultural determinants that cosegregate with fine-scale IBD-based relatedness.
These estimates rely on the standard identification assumptions for interventional effects, no unmeasured confounding of the community, mediator or mediator–outcome relationships, correct model specification, and positivity. Because IBD-community membership is genealogically fixed and precedes the outcomes, reverse causation is excluded; we do not assume the community–outcome association itself to be unconfounded, and therefore interpret the total effect descriptively. Within that descriptive frame, the decomposition into EME and IF components rests on no unmeasured mediator–outcome confounding as the principal untestable assumption, whereas the use of interventional (rather than natural) effects avoids any cross-world assumption.
E-value analysis VanderWeele and Ding (2017) confirms the robustness of the strongest community effects: explaining away the asthma and dermatitis results would require an unmeasured factor associated with both community membership and outcome, with risk ratios reaching 5.23 and 6.88 in the most affected subcommunities.
We additionally conducted a sensitivity analysis adjusting for self-reported race (Fig. 5D, Supplemental Fig. S7). Conditioning on self-reported race reduced statistical power; yet, several subcommunities retained significant direct and indirect effects. Because self-reported race may be partly downstream of community structure rather than an independent confounder, attenuation under race adjustment should be interpreted as bounding rather than identifying the share of variation captured by social labels. As an additional check that does not condition on race, we repeated the decomposition among the 6085 participants with harmonized self-reported White race, where only C1 is large enough to estimate, and the gradient across its subcommunities is preserved in rank order for all four outcomes and in sign for 11 of 12 comparisons (Supplemental Table S4). We further re-estimated the decomposition adding each individual’s healthcare-encounter count as a covariate (Supplemental Table S2). Because community membership is genealogically fixed and precedes outcome accumulation, encounter count is a descendant of the outcome rather than a baseline confounder; we therefore treat this as a conservative sensitivity bound that, if anything, biases effects toward the null. The C2 subcommunities nonetheless remained elevated for asthma (5.4–14.2 pp), dermatitis (3.2–6.5 pp), and influenza (3.1–7.2 pp), suggesting that these disparities are unlikely to be driven by differential healthcare contact alone.
Finally, to gain insight from a public health perspective, we used the model (Fig. 5A) to simulate interventions. If environmental exposures could be equalized across communities, approximately 33 asthma cases, 17 dermatitis cases, and 15 influenza cases could be prevented per 1000 individuals in high-risk C2 subcommunities, which are concrete and actionable targets for intervention, as we show in Figure 5E. However, these modifiable factors account for only part of the excess risk. The remainder, indexed by IBD-defined community structure, represents the maximum that could plausibly be attributed to community-specific factors, not a measurement of them. Because environmental exposures were observed at the ZIP-code level rather than per individual, environmental variation within neighborhoods is absorbed into this residual. Therefore, the reported EMEs are conservative (lower bounds), and the corresponding preventable-case counts are floors; with individual-level exposure data, part of the residual would be reassigned to the environmentally mediated component.
Public health applications
To translate these findings into practice, we developed an open-source dashboard using BIG biobank data (see Data access), which integrates community-specific prevalences, environment-mediated components, and the residual structure described above. For public health, this combined view reveals genetically related individuals across ZIP codes who share disease risk, enabling health departments to trace exposure pathways and quantify environmental versus unexplained contributions before intervening.
Finally, this network-based approach accommodates dynamic biobank growth, as demonstrated by our analysis incorporating 4091 individuals from the HGDP-1kGP joint release (Koenig et al. 2024). It showed that existing community assignments remain stable upon the addition of new participants, and new communities arise capturing new genetic diversity (Supplemental Fig. S8). Our application can be adapted to other cohorts, enabling joint exploration of IBD-based communities, health conditions, and environmental factors. Similar approaches have demonstrated utility in other biobank initiatives, as described by Caggiano et al. (2023) and Dai et al. (2020).
Discussion
In this work, we have shown that IBD can be used to group individuals without relying on reference populations, and that in our cohort, the grouping is informative about environmental and population health factors. Our findings demonstrate that IBD-based clustering captures population structure at multiple scales, from continental ancestry patterns to fine-scale genetic subcommunities that reflect shared environmental exposures and social determinants of health. Beyond broad inter-community differences, we observed distinct health condition prevalence among subcommunities, suggesting that genetic relatedness correlates with both biological and environmental factors influencing disease risk. Importantly, incorporating IBD information into genotype-phenotype models accounts for both genetic similarity and shared environmental effects, providing a more comprehensive framework for association studies. Together, these results demonstrate the utility of considering both close and distant relationships between individuals for targeted public health interventions.
Recent discussions have focused on the risks of conflating race and ethnicity with genetic ancestry (Popejoy 2021; Carlson et al. 2022; Lewis et al. 2022; National Academies of Sciences, Engineering, and Medicine 2023; Feero et al. 2024; Kozlov 2024). Typically, genetic studies categorize individuals based on continental-level labels; yet such classifications often overlook actual genetic relatedness. Our previous work demonstrated instances where individuals from different self-reported racial categories were closely related (i.e., second degree) (Buonaiuto et al. 2025). Similarly, ancestry-based classifications can separate genetically related individuals into distinct groups, particularly in cases involving admixed ancestry (Mas-Sandoval et al. 2023). In contrast, IBD-based hierarchical community detection allows for grouping individuals by their direct genetic relationships without relying on externally imposed labels based on arbitrarily defined reference populations. Although self-reported race is frequently used as the main proxy for unmeasured social factors (Manski et al. 2023), we show that residual variation in IBD-defined community structure, after adjusting for environmental and demographic confounders and self-reported race, reflects shared social and environmental exposures cosegregating with recent genealogy.
Self-reported race is near-collinear with IBD-community assignment ( White, Black/African American) and is plausibly a downstream marker of the residential and social processes the communities index. We therefore treat it as a sensitivity rather than a primary covariate. Conditioning on it also degrades positivity: adding race pushes the propensity model into regions of poor overlap, with the minimum propensity score falling by more than an order of magnitude. Forcing race into the primary model would additionally risk overadjusting the environmental pathway we aim to decompose. Furthermore, unlike race and ethnicity, whose definitions vary across countries and lack universal applicability, IBD-based classification relies solely on genomic data, making it transferable across populations regardless of local demographic terminology. We emphasize that IBD-defined communities are clusters of recent genealogical relatedness, not racial or ethnic groups, even when they correlate with these descriptors due to historical demographic processes.
Recently, Shemirani et al. (2026) introduced continuous spectral components from IBD graphs for fine-scale population-structure adjustment in UK Biobank association studies, Belbin et al. (2021) and Caggiano et al. (2023) characterized IBD-based clusters in adult biobanks through broad phenome-wide scans, and Dai et al. (2020) demonstrated hierarchical IBD structure across the U.S. Genographic Project. Compared to the mentioned references, our framework addresses complementary aspects: (1) we focus on a pediatric biobank with neighborhood-level geocoding, (2) we build an explicit DAG-based decomposition (Fig. 5A) of risk differences into known environmental factors-mediated and community-specific components under stated modeling assumptions, and (3) we provide a quantitative integration of social determinants of health (PM2.5, poverty, social vulnerability).
The IBD layer also adds explanatory value over alternative partitions of the same cohort: re-estimating the decomposition with geographic ZIP-centroid clusters, PCA-defined clusters, or ADMIXTURE ancestry groups reproduced the broad gradient but compressed the community-level risk heterogeneity that IBD resolves (asthma total effects up to 16.8 pp for IBD vs ≤6.9 pp for granularity-matched PCA clusters, ≤6.4 pp across ancestry groups, and no coherent geographic gradient), with a smaller environmentally mediated share under PCA clustering (Supplemental Table S5). Consistent with Naseri et al. (2021), residential location is itself partly determined by genealogical relatedness; we therefore model residence and its neighborhood exposures as a mediator, not a confounder, of the community–health association, and interpret the independent factor as an upper bound on the unmeasured portion of this socio-environmental pathway rather than as an intrinsic genetic effect.
This work focuses on the entire cohort characterization; most of the analyses were based on the 17 main subcommunities that represent the predominant demographic structure. We show how subcommunity-level patterns emerge, providing information for risk assessment and public health interventions, and identifying groups that may be at risk for genetic and environmental factors. Furthermore, the network-based approach offers additional clinical utility by identifying and characterizing outlier individuals within minor subcommunities, allowing targeted investigation of health conditions potentially linked to their distinct fine-scale IBD-defined relatedness pattern (Caggiano et al. 2023; Lancaster et al. 2024).
In addition, population stratification, admixture, and shared environmental factors represent significant sources of confounding in genome-wide association studies (GWAS) and admixture mapping, potentially leading to false positives and negatives (Devlin and Roeder 1999; Liu et al. 2013; Caliebe et al. 2022; Tan and Atkinson 2023). Addressing these confounders through methods such as principal component adjustment, mixed-model association analyses, and inclusion of local ancestry covariates has become critical to accurately identify true genotype-phenotype associations (Liu et al. 2013; Tan and Atkinson 2023). Usually, in GWAS studies, only close relationships or ancestry are taken into account (Tan and Atkinson 2023), and population structure adjustments are introduced by performing principal component analysis and incorporating the top principal components (PCs) as covariates. However, it has been observed that the introduction of PCs can lead to spurious associations in GWAS studies when including admixed populations (Grinde et al. 2024). The IBD-based grouping strategy inherently integrates distant genetic relatedness, ancestry, and shared environmental factors. Using IBD grouping to adjust population structure in association studies can be a promising line of future research.
A further consideration concerns the population descriptors conventionally used in genomic research. Self-reported race and ethnicity reflect the structure of U.S. census categories and EHR-coding practices, which do not capture the full continuum of self-identification (National Academies of Sciences, Engineering, and Medicine 2023; Feero et al. 2024). Inferred genetic ancestry, in turn, depends on reference panels such as HGDP-1kGP (Koenig et al. 2024), which under-represent Indigenous American, Middle Eastern, South Asian, and Oceanic diversity. These limitations motivate the IBD-based framework adopted here, which groups individuals based on their direct genealogical relationships, without imposing labels, reference panels, or pre-established social categories. Within this framework, genetic structure also carries a social character, possibly reflecting that kinship and shared social environments coshape one another.
Despite its advantages, the IBD-based grouping approach has limitations. Its applicability may depend on the population density, the degree of local genetic structure, and the availability of genomic and geographic data (Tang et al. 2022). Future work should evaluate the integration of IBD-based categorization with existing correction strategies in GWAS (Zhou and Stephens 2012) and gene-based association studies (Berrandou et al. 2023), particularly in cohorts with varying levels of endogamy, admixture, and environmental heterogeneity (Caliebe et al. 2022). Another aspect is the definition of relatedness, which lacks a universally accepted formulation. As discussed by Speed and Balding (2015), different measures, based on pedigree, allele, and segment sharing, reflect different interpretations of what it means to be related. In this study, we define relatedness as the total length of genome-shared IBD, a direct, quantitative measure of recent coancestry. Although often categorized for interpretability, this metric captures a continuous spectrum of genetic similarity. Also, the relationship between admixture and network centrality, why multicomponent individuals occupy peripheral positions, remains an open question that points to underlying demographic processes and warrants dedicated investigation beyond the scope of this work.
Ultimately, our findings highlight how a deeper understanding of genetically defined communities can enhance the study of health disparities, uncover hidden confounders in genomic analyses, and open new avenues for integrating genetic and environmental factors into population-scale research.
Methods
Ethics
Our research followed the ethical guidelines established in the Declaration of Helsinki for human subjects’ medical research. We conducted this study according to approved ethical standards, with authorization from the University of Tennessee Health Science Center’s Institutional Review Board (IRB number: 23-09204-NHSR). All participants provided written informed consent, with parents or legal guardians giving consent for the children involved in the study. To protect privacy, we removed all identifying information from the data before conducting our analysis. Aggregated results, including community-level disease and exposure summaries, are made publicly available through the dashboard described above; individual-level community assignments are not returned to participants.
Cohort, clinical data and genomic processing
BIG participants were recruited at four sites in Tennessee; the largest is a pediatric hospital in Memphis serving a population that is predominantly self-identified as Black/African American, in an area shaped by historical residential segregation. Genomic DNA derives from leftover clinical blood linked to de-identified EHR data. Clinical information was extracted from electronic health records and aligned to the OMOP common data model; ICD-9/10 diagnosis codes were mapped to PheCodes (Bastarache 2021), with asthma defined by PheCode RE_475 and dermatitis by PheCodes beginning with 690. Samples were exome-captured with a Regeneron genotyping spike, aligned to GRCh38 with BWA-MEM (Li and Durbin 2009), called with DeepVariant (Poplin et al. 2018) and GLnexus (Lin et al. 2018), and phased with ShapeIT v5 (Hofmeister et al. 2023), yielding 6,886,631 variable sites after quality control. Global ancestry was inferred with RFMix (Maples et al. 2013) against the harmonized HGDP-1kGP reference panel (Koenig et al. 2024), defining the AFR, AMR, EUR and EAS components and the admixture categories used throughout. Recruitment sites and dates, sequencing chemistry and coverage metrics, variant annotation, and the ancestry thresholds are given in Supplemental Methods.
Identity-by-descent
To identify identity-by-descent (IBD) segments, we used hap-ibd in the phased data set comprising 13,143 genomes from the BIG cohort and 4091 genomes from the HGDP-1kGP, focusing exclusively on autosomal loci (Zhou et al. 2020). Hap-ibd was executed with a minimum seed parameter of 2 cM to focus on the detection of IBD segments reflecting recent common ancestry, given that segments of this length or greater provide information for fine-scale relationship inference (Huff et al. 2011).
Post-processing protocols established by Browning and Browning (2013, 2015) were applied to refine the detected segments (using Refined IBD Browning and Browning 2013). Specifically, the merge-ibd-segments tool was employed with default parameters, consolidating fragmented segments to improve continuity. Additionally, gaps containing at most one discordant homozygote and segments shorter than 0.6 cM were removed, significantly enhancing detection accuracy and efficiency in large-scale genomic data sets. The 2 cM seed threshold was retained to maximize detection of recent shared ancestry; classical false-positive rates reported for short segments (Tang et al. 2022) are reduced by the post-processing protocols applied above (gap-merging, low-quality segment filtering, and exclusion of high-LD regions).
For quality control, segments overlapping centromeres, telomeres, the human leukocyte antigen region, and low complexity regions were excluded. To identify genome regions with high shared genetic material, we calculated total identity by descent at each marker position and removed those that deviated significantly from the genome-wide average. For downstream analysis, IBD segment lengths were summed across all chromosomes between each pair of individuals, generating the total shared IBD. Finally, only for illustrative purposes, we classified the degree of relationships based on IBD sharing (Huff et al. 2011; Gusev et al. 2012; Browning and Browning 2015) using the pedsuite R package (Vigeland 2021).
Network, community detection and topology
A genetic network was constructed in which each BIG participant was represented as a node, and edges were defined based on the total genome-wide IBD segment sharing. Edge weights were proportional to the total IBD shared between individuals. To build this network, pairwise IBD data were processed and filtered, excluding close-kin pairs following Dai et al. (2020). For visualization and exploratory analyses, the network was represented using the Fruchterman-Reingold layout.
We evaluated the Louvain and Leiden algorithms for community detection (Anuar et al. 2021). Both were applied in two stages: a first pass on the full IBD network to identify the top-level communities, followed by an independent second pass within each top-level community to resolve its subcommunities. Comparative analysis revealed an Adjusted Rand Index (ARI) of 0.975, indicating high similarity between community assignments from both methods. However, we selected the Leiden algorithm due to its improved resolution, robustness, and ability to avoid disconnected communities, a known limitation of Louvain (Anuar et al. 2021).
The hierarchical Leiden algorithm was applied, with modularity as the objective function, using a resolution parameter of 0.3 and a beta value of 2. These values were determined empirically to optimize the balance between identifying meaningful broad-scale community structures and maintaining balanced sizes of subcommunities. The partition was invariant to beta (adjusted Rand index ≥0.99 across beta 1–3); the resolution parameter sets the granularity of the partition by construction (i.e., the number of communities), and the robustness of the downstream conclusions to this granularity is established in the interventional analysis (Supplemental Table S6). Community assignments were robust to the choice of edge-weight metric: re-running Leiden with weights set to (total IBD), a monotone transform of the kinship-degree scale, yielded a partition highly concordant with the raw-IBD weighting (adjusted Rand index = 0.92). This approach aligns conceptually with previously published methods for hierarchical community detection based on IBD networks (Dai et al. 2020), but it explicitly specifies parameter values adapted to our data set characteristics and study objectives.
Genetic differentiation between communities was independently assessed using the fixation index (FST), calculated with PLINK. This analysis quantitatively characterized genetic distances between communities, offering independent validation and additional genetic context for the hierarchical community structures identified by the Leiden algorithm.
Network topology analysis was performed using NetworkX to characterize the structural properties of IBD-based genetic networks within each community partition. For each individual node, the connectivity ratio was computed as the normalized degree centrality, calculated by dividing the number of direct connections by the mean degree within the respective community. Betweenness was quantified using the standard algorithm that measures the fraction of shortest paths between all node pairs that traverse through each individual node, subsequently normalized by the community-specific mean betweenness score to facilitate comparative analysis across communities with different topological characteristics. The normalization procedure ensures that values above 1.0 indicate above-average connectivity or centrality within the community context, whereas values below 1.0 represent below-average network importance. To be consistent and informative in our context, network topology analyses require more than 30 nodes; for this reason, C4 subcommunities were not included.
As a sensitivity analysis, IBD was recalculated over the BIG cohort combined with 4091 HGDP-1kGP genomes (Koenig et al. 2024) (n = 17,234) under identical parameters and thresholds, and the same hierarchical Leiden procedure was applied (Supplemental Methods; Supplemental Fig. S8).
Geographical analysis
To analyze the geographical patterns of genetic relationships, we geolocated BIG cohort participants by ZIP code at the neighborhood level. Distances between neighborhoods were calculated using the sf R package (Pebesma and Bivand 2018), and therefore, we obtained a matrix of distances between individuals (with zero as the distance between those who shared the same neighborhood). A network based on the geographical distance was constructed, representing the subcommunities in the nodes and the inverse of the median distance for the edges. Geographical data was integrated with the 24th USA census (2020)-based metrics. It provided several demographic measures and also social determinants of health.
Population descriptors
We use three orthogonal descriptors throughout this work, distinguished operationally and conceptually:
Self-reported race and ethnicity (SIRE) are social and administrative categories extracted from electronic health records, used as proxies for shared social environment and exposure to structural inequities, not as biological variables (National Academies of Sciences, Engineering, and Medicine 2023; Feero et al. 2024). Hospital staff selected self-reported race categories from a dropdown menu following HL7 v2.5 standards (https://hl7-definition.caristix.com/v2/HL7v2.5/Tables/0005); the system allowed multiple self-reported race codes for individuals identifying with more than one background. Owing to inconsistencies in legacy records, free-text and dropdown entries were harmonized to HL7 v2.5 categories while preserving self-identification (Supplemental Table S7). Hispanic/Latino ethnicity was recorded separately from race.
Inferred genetic ancestry refers to RFMix-derived ancestry proportions estimated against the harmonized HGDP-1kGP reference panel (Koenig et al. 2024), with components labeled AFR, AMR, EUR, and EAS. These labels denote reference-panel ancestry components and not biological or social identities; in particular, AMR refers to the admixture-derived component in the 1000G reference and should not be conflated with Indigenous American identity, which our reference panel cannot resolve.
IBD-defined communities are network-derived clusters of recent genealogical relatedness, obtained by hierarchical Leiden community detection on the IBD-sharing network. Communities (C1–C4) and subcommunities are clusters of pairwise relatedness, not racial, ethnic, or ancestry groups, even when they correlate with these descriptors due to historical demographic processes.
Social determinants of health
In our analysis, each subcommunity is characterized by aggregating Social Determinants of Health (SDoH) variables by neighborhood level. Therefore, we were able to assign SDoH to each BIG participant based on ZIP code. We analyzed SDoH variables from multiple sources. U.S. Census (2020) provided population density, poverty rates and Gini index. CDC contributed the Social Vulnerability Index (2020), obesity prevalence and smoking rates (2021). Geographic factors included USDA urban/rural designations (2019) and Treasury Department/CDFI metro classifications (2020). We incorporated unemployment rates (Treasury Department/CDFI, 2016–2020), and EPA’s PM2.5 particulate matter percentiles (2024).
We acknowledge that neighborhood-level assignment of exposures (an instance of ecological inference, with associated modifiable-areal-unit limitations) may not fully capture individual-level variation, particularly in cities with marked residential segregation. However, for pediatric populations with limited residential mobility, ZIP code-level metrics provide reasonable proxies for cumulative environmental exposure. Critically, ZIP-averaged measurement of the mediators introduces classical measurement error in the mediation path, which attenuates the EME component and correspondingly inflates the independent factor (IF) in the decomposition. The IF estimates reported here should therefore be interpreted as an upper bound: they absorb both genuinely unmeasured shared exposures and measured factors that are correctly specified but coarsely resolved at the ZIP scale (e.g., within-ZIP variation in PM2.5 and poverty). Refinement to finer, census-tract or address-level exposure data would shift mass from IF toward EME without altering the total effect. The de-identified EHR extract does not capture individual-level income, insurance, or parental education; we adjust instead for area-level poverty (a mediator in every outcome model) and related neighborhood measures (unemployment, obesity, smoking) linked by ZIP code. Individual-level socioeconomic data would further refine the decomposition.
Continuous variables (e.g., PM2.5, CSMOKING) are averaged between individuals, whereas categorical variables () are converted to ordinal scores by appropriate mapping and are similarly averaged. Each community is represented by a profile vector, and the Euclidean distance between communities i and j is calculated as
Interventional effect analysis
We estimated interventional direct and indirect effects (Pearl 2001; VanderWeele and Vansteelandt 2014; Vansteelandt and Daniel 2017) for IBD subcommunity (C; reference C1c) on binary health outcomes (H) using g-computation (Robins 1986) on the risk-difference scale. Baseline covariates (D) included age and sex (plus self-reported race in sensitivity analyses). Environmental mediators (E) were selected a priori based on epidemiological evidence (Mersha and Abebe 2015; Johnson et al. 2021) and assessed for collinearity prior to model specification: for asthma and dermatitis, ; for influenza, ; for epilepsy, . The interventional decomposition adopted here partitions risk differences under identification assumptions that we cannot test from these observational data. IBD-defined community membership (C) is a stable, genealogically determined characteristic that does not vary with outcomes, ruling out reverse association from H to C. Neighborhood exposures (E) at ZIP-code resolution were largely fixed during the period in which pediatric outcomes accumulated. Unmeasured factors, including individual mobility, indoor exposures, healthcare utilization, and cultural or behavioral characteristics, may confound the mediator-outcome relationship and are not addressed by our specification. We therefore interpret the resulting partition (TE, EME, IF) descriptively, as the decomposition of risk differences that holds under the specified DAG and identification assumptions; the E-value sensitivity analysis (VanderWeele and Ding 2017) characterizes the strength of unmeasured confounding required to overturn the observed patterns.
Healthcare-encounter count is realized during outcome accumulation and is a plausible consequence of disease; it is therefore a descendant of the outcome, not a baseline confounder, and enters only as a conservative sensitivity adjustment (Supplemental Table S2), never in the primary set D. Encounter counts proxy healthcare contact but not access, diagnostic intensity, or coding completeness; any access-, coding-, or ascertainment-related signal not captured by this adjustment is absorbed into the independent factor, consistent with our reading of IF as an upper bound on unmeasured pathways.
Estimation used cross-fitted g-computation (K = 4 folds) in R (R Core Team 2025). In each fold we fit (i) a logistic outcome regression q(C, D, E) with natural splines for continuous covariates and factor indicators for categorical covariates, and (ii) a joint mediator model via sequential factorization (Imai et al. 2010) using Gaussian GLMs on automatically selected transformation scales (logit for bounded mediators, log for right-skewed, identity otherwise).
The g-formula requires integrating over the mediator distribution, which lacks a closed-form solution. We approximated these integrals via Monte Carlo simulation (500 draws), sampling mediator values by adding resampled residuals to predicted conditional means on transformed scales, then propagating through the outcome model. Counterfactual risks were averaged over simulations and individuals. Uncertainty was quantified via community-cluster weighted bootstrap (500 replicates), drawing wc ∼ Exp(1) per subcommunity and re-estimating effects with weighted likelihood to account for within-cluster correlation. We report percentile-based 95% confidence intervals. Analyses excluded subcommunities with n < 100 and C3a (positivity violations). Missing data were handled via rare-category lumping for categorical variables and median imputation with missingness indicators for continuous variables.
We conducted E-value sensitivity analysis (VanderWeele and Ding 2017) to assess robustness to unmeasured confounding. E-values were computed by converting risk differences to approximate risk ratios under baseline prevalence estimates from the reference community, then applying the standard formula.
Additionally, we performed a specification sensitivity analysis adjusting for self-reported race, used here as a proxy for accumulated social exposures rather than as a biological covariate (Manski et al. 2023; National Academies of Sciences, Engineering, and Medicine 2023; Feero et al. 2024), to evaluate whether IBD-defined community effects persist beyond what self-reported race captures. Moreover, the interventional decomposition was robust to the granularity of the partition: re-estimating it on the maximally coarse-grained partition reproduced the environment-mediated/independent split obtained at the subcommunity level (Supplemental Table S6).
To estimate the public health impact of equalizing environmental exposures, we calculated the number of preventable cases per 1000 individuals as the EME multiplied by 1000. This represents the expected reduction in disease burden if neighborhood-level exposures (e.g., PM2.5, poverty) in high-risk subcommunities were equalized to reference levels.
Code availability
All custom analysis code, including IBD calling, network construction, community detection, mediation analyses, and the interactive dashboard, is available at GitHub (https://github.com/MarsicoFL/BIG.Communities), Zenodo (https://doi.org/10.5281/zenodo.19766414), and as Supplemental Code.
Data access
Individual-level genomic and clinical records analyzed in this study are controlled-access under the BIG biorepository’s IRB protocol (University of Tennessee Health Science Center IRB 23-09204-NHSR), in compliance with HIPAA and institutional requirements protecting participants of a predominantly pediatric cohort. The following derived outputs supporting the findings of this paper are publicly available without restriction at GitHub (https://github.com/MarsicoFL/BIG.Communities) and as Supplemental Data: aggregated ancestry proportions per community and subcommunity, de-identified IBD-network community assignments, neighborhood-level social-determinants-of-health summaries, and risk-difference estimates from the mediation analyses. The interactive dashboard built on these outputs is available at https://francomarsico.shinyapps.io/BIG_Communities/. Researchers seeking access to individual-level data may submit a request to the BIG Research Oversight Committee at https://uthsc.edu/cbmi/big/ or [email protected]; requests are reviewed within four weeks, and approved access is granted for the duration of the proposed project under a data use agreement.
Regeneron Genetics Center
RGC Management and Leadership Team
Aris Baras,11 Gonçalo Abecasis,11 Adolfo Ferrando,11 Giovanni Coppola,11 Andrew Deubler,11 Luca A. Lotta,11 John D. Overton,11 Jeffrey G. Reid,11 Alan Shuldiner,11 Katherine Siminovitch,11 Jason Portnoy,11 Marcus B. Jones,11 Lyndon Mitnaul,11 Alison Fenney,11 Jonathan Marchini,11 Manuel Allen Ferreira Revez,11 Maya Ghoussaini,11 Mona Nafde,11 William Salerno,11 Cristen Willer,11 Lourdes Crane,11 Niek Verweij,11 Eric Jorgenson,11 Joseph Pickrell,11
Sequencing and Laboratory Operations
John D. Overton,11 Christina Beechert,11 Erin Fuller,11 Laura M. Cremona,11 Eugene Kalyuskin,11 Hang Du,11 Caitlin Forsythe,11 Zhenhua Gu,11 Kristy Guevara,11 Michael Lattari,11 Alexander Lopez,11 Kia Manoochehri,11 Prathyusha Challa,11 Manasi Pradhan,11 Raymond Reynoso,11 Ricardo Schiavo,11 Maria Sotiropoulos Padilla,11 Chenggu Wang,11 Sarah E. Wolf,11
Genome Informatics and Data Engineering
Mona Nafde,11 Manan Goyal,11 George Mitra,11 Sanjay Sreeram,11 Rouel Lanche,11 Sai Lakshmi Vasireddy,11 Gisu Eom,11 Krishna Pawan Punuru,11 Sujit Gokhale,11 Shehroze Aamer,11 Pooja Mule,11 Mudasar Sarwar,11 Muhammad Aqeel,11 Xiaodong Bai,11 Lance Zhang,11 Sean O’Keeffe,11 Razvan Panea,11 Evan Edelstein,11 Devika Torvi,11 Ayesha Rasool,11 William Salerno,11 Evan K. Maxwell,11 Boris Boutkov,11 Alexander Gorovits,11 Ju Guan,11 Alicia Hawes,11 Olga Krasheninina,11 Samantha Zarate,11 Adam J. Mansfield,11 Lukas Habegger,11 Stephen Tahan,11 Naveen Karumuri,11
Analytical Genetics and Data Science
Gonçalo Abecasis,11 Manuel Allen Ferreira Revez,11 Joshua Backman,11 Kathryn Burch,11 Adrian Campos,11 Liron Ganel,11 Sheila Gaynor,11 Benjamin Geraghty,11 Arkopravo Ghosh,11 Christopher Gillies,11 Lauren Gurski,11 Eric Jorgenson,11 Tyler Joseph,11 Michael Kessler,11 Jack Kosmicki,11 Adam Locke,11 Priyanka Nakka,11 Jonathan Marchini,11 Karl Landheer,11 Olivier Delaneau,11 Maya Ghoussaini,11 Anthony Marcketta,11 Joelle Mbatchou,11 Jonathan Ross,11 Carlo Sidore,11 Eli Stahl,11 Rujin Wang,11 Kuan-Han Wu,11 Blair Zhang,11 Andrey Ziyatdinov,11 Yuxin Zou,11 Jingning Zhang,11 Kyoko Watanabe,11 Mira Tang,11 Frank Wendt,11 Suganthi Balasubramanian,11 Suying Bao,11 Kathie Sun,11 Chuanyi Zhang,11 Sean Yu,11 David Corrigan,11 Dhruv Shidhaye,11 Chen Wang,11 Keyrun Adhikari,11 Alexander Lachmann,11 Anna Alkelai,11 Mark Weiner,11 Julian Stamp,11 Joseph Pickrell,11 Ammar Tareen,11 Kah Young,11 Leonia Bozzacco,11 Muhammad Elsadany,11 Anjali Das,11 Layla Aref,11 Ruhollah Shemirani,11 Sylvanus Toikumo,11
Therapeutic Area Genetics
Adolfo Ferrando,11 Giovanni Coppola,11 Luca A. Lotta,11 Alan Shuldiner,11 Katherine Siminovitch,11 Brian Hobbs,11 Jon Silver,11 William Palmer,11 Rita Guerreiro,11 Amit Joshi,11 Antoine Baldassari,11 Cristen Willer,11 Sarah Graham,11 Ernst Mayerhofer,11 Erola Pairo Castineira,11 Mary Haas,11 Niek Verweij,11 George Hindy,11 Jonas Bovijn,11 Tanima De,11 Luanluan Sun,11 Olukayode Sosina,11 Arthur Gilly,11 Peter Dornbos,11 Moeen Riaz,11 Manav Kapoor,11 Gannie Tzoneva,11 Sahar Gelfman,11 Vijay Kumar,11 Jacqueline Otto,11 Jose Bras,11 Silvia Alvarez,11 Jessie Brown,11 Hossein Khiabanian,11 Joana Revez,11 Kimberly Skead,11 Jae Soon Sul,11 Lei Chen,11 Sam Choi,11 Amy Damask,11 Nan Lin,11 Charles Paulding,11 Sameer Malhotra,11 Joseph Herman,11 Jacob McPadden,11 David Blair,11 Joshua Motelow,11 Julie Horowitz,11 Wenmin Zhang,11
Research Program Management and Strategic Initiatives
Marcus B. Jones,11 Michelle G. LeBlanc,11 Nadia Rana,11 Jennifer Rico Varela,11 Jaimee Hernandez,11 Larizbeth Romero,11 Ashley Paynter,11
Competing interest statement
The Regeneron Genetics Center is a subsidiary of Regeneron Pharmaceuticals, Inc. All other authors declare no competing interests.
Acknowledgements
We are grateful to the participants of the Biorepository and Integrative Genomics initiative and to their families, whose contribution made this resource possible. We thank Carol Hendrix and the consent teams in Memphis and Johnson City for their oversight of recruitment and sample collection; Kito Lord (ROH); James Adkins and Jonathan Patrick Moorman (ETSU); Jason Yaun and Sandra Arnold (FRI); Peter Buckley, G. Nicholas Verne, and Pamela Beckley (UTHSC); Trey Eubanks (Le Bonheur Children’s Hospital); Scott Strome, Jon McCullers, and David Haines; and the members of the BIG Community Advisory Board; Giuseppe Comentale (Academy of Fine Arts of Naples, Italy). This work was supported by the Center for Integrative and Translational Genomics at UTHSC (S.B., F.M., R.W.W., P.P., V.C.); National Institutes of Health (NIH)/National Institute of General Medical Sciences (R01GM123489 to P.P.); National Science Foundation (PPoSS Award 2118709 to P.P.); NIH/National Heart, Lung, and Blood Institute (R01 HL170151 to T.H.F.); the Italian Ministry of University and Research, PRIN 2020J84FAM “DELIVER” (CUP B63C20040330001) (F.M., M.V.); the Rady Children’s Institute for Genomic Medicine (T.H.F.); the Children’s Foundation of Memphis (T.H.F.); the Assisi Foundation (C.W.B.); the Urban Child Institute; the Children’s Foundation Research Institute, Children’s Foundation of Memphis; and the Children’s Foundation Research Institute, Le Bonheur Children’s Hospital.
Author contributions: Conceptualization: F.M., S.B., A.M., R.W.W., R.L.D., C.W.B., P.P., V.C.; Data curation: F.M., S.B., L.K.C., A.M.; Formal analysis: F.M., S.B., E.K.A., V.C.; Funding acquisition: R.J.R., R.W.W., R.L.D., T.H.F., C.W.B., P.P., V.C.; Investigation: F.M., RGC, V.C.; Methodology: F.M., S.B., V.C.; Resources: RGC, R.W.W., C.W.B., P.P.; Software: F.M., P.P., V.C.; Supervision: R.J.R., R.W.W., R.L.D., T.H.F., C.W.B., M.V., P.P., V.C.; Visualization: F.M., S.B., V.C.; Writing – original draft: F.M., S.B., E.K.A., R.W.W., R.L.D., T.H.F., C.W.B., V.C.; Writing – review & editing: F.M., S.B., E.K.A., L.K.C., A.M., R.Z., RGC, R.J.R., R.W.W., R.L.D., T.H.F., C.W.B., M.V., P.P., V.C.
Footnotes
[1] Supplementary material [Supplemental material is available for this article.]
[2] Article published online before print. Article, supplemental material, and publication date are at https://www.genome.org/cgi/doi/10.1101/gr.282338.126.
[3] Freely available online through the Genome Research Open Access option.
[11] Regeneron Genetics Center, Tarrytown, NY 10591, USA
References
- ↵Anuar SHH, Abas ZA, Yunos NM, Zaki NHM, Hashim NA, Mokhtar MF, Asmai SA, Abidin ZZ, Nizam AF. 2021. Comparison between Louvain and Leiden algorithm for network structure: a review. J Phys Conf Ser 2129: 012028. 10.1088/1742-6596/2129/1/012028
- ↵Barbujani G, Colonna V. 2010. Human genome diversity: frequently asked questions. Trends Genet 26: 285–295. 10.1016/j.tig.2010.04.002
- ↵Barbujani G, Magagni A, Minch E, Cavalli-Sforza LL. 1997. An apportionment of human DNA diversity. Proc Natl Acad Sci 94: 4516–4519. 10.1073/pnas.94.9.4516
- ↵Bastarache L. 2021. Using phecodes for research with the electronic health record: from PheWAS to PheRS. Annu Rev Biomed Data Sci 4: 1–19. 10.1146/annurev-biodatasci-122320-112352
- ↵Belbin GM, Cullina S, Wenric S, Soper ER, Glicksberg BS, Torre D, Moscati A, Wojcik GL, Shemirani R, Beckmann ND, 2021. Toward a fine-scale population health monitoring system. Cell 184: 2068–2083. 10.1016/j.cell.2021.03.034
- ↵Berrandou TE, Balding D, Speed D. 2023. LDAK-GBAT: fast and powerful gene-based association testing using summary statistics. Am J Hum Genet 110: 23–29. 10.1016/j.ajhg.2022.11.010
- ↵Browning SR, Browning BL. 2011. Haplotype phasing: existing methods and new developments. Nat Rev Genet 12: 703–714. 10.1038/nrg3054
- ↵Browning BL, Browning SR. 2013. Improving the accuracy and efficiency of identity-by-descent detection in population data. Genetics 194: 459–471. 10.1534/genetics.113.150029
- ↵Browning SR, Browning BL. 2015. Accurate non-parametric estimation of recent effective population size from segments of identity by descent. Am J Hum Genet 97: 404–418. 10.1016/j.ajhg.2015.07.012
- ↵Browning SR, Browning BL, Daviglus ML, Durazo-Arvizu RA, Schneiderman N, Kaplan RC, Laurie CC. 2018. Ancestry-specific recent effective population size in the Americas. PLoS Genet 14: e1007385. 10.1371/journal.pgen.1007385
- ↵Buonaiuto S, Marsico F, Mohammed A, Chinthala LK, Amos-Abanyie EK, Prins P, Mozhui K, Rooney RJ, Williams RW, 2025. Insights from the biorepository and integrative genomics pediatric resource. Nat Commun 16: 4750. 10.1038/s41467-025-59375-0
- ↵Caggiano C, Boudaie A, Shemirani R, Mefford J, Petter E, Chiu A, Ercelen D, He R, Tward D, Paul KC, 2023. Disease risk and healthcare utilization among ancestrally diverse groups in the Los Angeles region. Nat Med 29: 1845–1856. 10.1038/s41591-023-02425-1
- ↵Caliebe A, Tekola-Ayele F, Darst BF, Wang X, Song YE, Gui J, Sebro RA, Balding DJ, Saad M, Dubé MP, 2022. Including diverse and admixed populations in genetic epidemiology research. Genet Epidemiol 46: 347–371. 10.1002/gepi.22492
- ↵Carlson J, Henn BM, Al-Hindi DR, Ramachandran S. 2022. Counter the weaponization of genetics research by extremists. Nature 610: 444–447. 10.1038/d41586-022-03252-z
- ↵Cavalli-Sforza LL. 1986. Cultural evolution. Am Zool 26: 845–856. 10.1093/icb/26.3.845
- ↵Dai CL, Vazifeh MM, Yeang CH, Tachet R, Wells RS, Vilar MG, Daly MJ, Ratti C, Martin AR. 2020. Population histories of the United States revealed through fine-scale migration and haplotype analysis. Am J Hum Genet 106: 371–388. 10.1016/j.ajhg.2020.02.002
- ↵Devlin B, Roeder K. 1999. Genomic control for association studies. Biometrics 55: 997–1004. 10.1111/j.0006-341X.1999.00997.x
- ↵Dobzhansky T. 1962. Mankind evolving: the evolution of the human species. Yale University Press, New Haven, CT.
- ↵Eisenberg JN, Desai MA, Levy K, Bates SJ, Liang S, Naumoff K, Scott JC. 2007. Environmental determinants of infectious disease: a framework for tracking causal links and guiding public health research. Environ Health Perspect 115: 1216–1223. 10.1289/ehp.9806
- ↵Feero WG, Steiner RD, Slavotinek A, Faial T, Bamshad MJ, Austin J, Korf BR, Flanagin A, Bibbins-Domingo K. 2024. Guidance on use of race, ethnicity, and geographic origin as proxies for genetic ancestry groups in biomedical publications. Am J Hum Genet 111: 621–623. 10.1016/j.ajhg.2024.03.003
- ↵Gajdoš P, Ježowicz T, Uher V, Dohnálek P. 2016. A parallel Fruchterman–Reingold algorithm optimized for fast visualization of large graphs and swarms of data. Swarm Evol Comput 26: 56–63. 10.1016/j.swevo.2015.07.006
- ↵Gilbert E, Shanmugam A, Cavalleri GL. 2022. Revealing the recent demographic history of Europe via haplotype sharing in the UK Biobank. Proc Natl Acad Sci 119: e2119281119. 10.1073/pnas.2119281119
- ↵Grinde KE, Browning BL, Reiner AP, Thornton TA, Browning SR. 2024. Adjusting for principal components can induce collider bias in genome-wide association studies. PLoS Genet 20: e1011242. 10.1371/journal.pgen.1011242
- ↵Gusev A, Palamara PF, Aponte G, Zhuang Z, Darvasi A, Gregersen P, Pe’er I. 2012. The architecture of long-range haplotypes shared within and across populations. Mol Biol Evol 29: 473–486. 10.1093/molbev/msr133
- ↵Hofmeister RJ, Ribeiro DM, Rubinacci S, Delaneau O. 2023. Accurate rare variant phasing of whole-genome and whole-exome sequencing data in the UK Biobank. Nat Genet 55: 1243–1249. 10.1038/s41588-023-01415-w
- ↵Huff CD, Witherspoon DJ, Simonson TS, Xing J, Watkins WS, Zhang Y, Tuohy TM, Neklason DW, Burt RW, Guthery SL, 2011. Maximum-likelihood estimation of recent shared ancestry (ERSA). Genome Res 21: 768–774. 10.1101/gr.115972.110
- ↵Imai K, Keele L, Yamamoto T. 2010. Identification, inference and sensitivity analysis for causal mediation effects. Stat Sci 25: 51–71. 10.1214/10-STS321
- ↵Itao K, Kaneko K. 2021. Evolution of family systems and resultant socio-economic structures. Humanit Soc Sci Commun 8: 243. 10.1057/s41599-021-00919-2
- ↵Johnson CC, Chandran A, Havstad S, Li X, McEvoy CT, Ownby DR, Litonjua AA, Karagas MR, Camargo CA, Gern JE, 2021. US childhood asthma incidence rate patterns from the ECHO consortium to identify high-risk groups for primary prevention. JAMA Pediatr 175: 919–927. 10.1001/jamapediatrics.2021.0667
- ↵Koenig Z, Yohannes MT, Nkambule LL, Zhao X, Goodrich JK, Kim HA, Wilson MW, Tiao G, Hao SP, Sahakian N, 2024. A harmonized public resource of deeply sequenced diverse human genomes. Genome Res 34: 796–809. 10.1101/gr.278378.123
- ↵Kozlov M. 2024. ’All of Us’ genetics chart stirs unease over controversial depiction of race. Nature 10.1038/d41586-024-00568-w
- ↵Lancaster MC, Chen HH, Shoemaker MB, Fleming MR, Strickland TL, Baker JT, Evans GF, Polikowsky HG, Samuels DC, Huff CD, 2024. Detection of distant relatedness in biobanks to identify undiagnosed cases of Mendelian disease as applied to Long QT syndrome. Nat Commun 15: 7507. 10.1038/s41467-024-51977-4
- ↵Lewis ACF, Molina SJ, Appelbaum PS, Dauda B, Di Rienzo A, Fuentes A, Fullerton SM, Garrison NA, Ghosh N, Hammonds EM, 2022. Getting genetic ancestry right for science and society. Science 376: 250–252. 10.1126/science.abm7530
- ↵Li H, Durbin R. 2009. Fast and accurate short read alignment with Burrows–Wheeler transform. Bioinformatics 25: 1754–1760. 10.1093/bioinformatics/btp324
- ↵Lin MF, Rodeh O, Penn J, Bai X, Reid JG, Krasheninina O, Salerno WJ. 2018. GLnexus: joint variant calling for large cohort sequencing. bioRxiv 10.1101/343970
- ↵Liu J, Lewinger JP, Gilliland FD, Gauderman WJ, Conti DV. 2013. Confounding and heterogeneity in genetic association studies with admixed populations. Am J Epidemiol 177: 351–360. 10.1093/aje/kws234
- ↵Manski CF, Mullahy J, Venkataramani AS. 2023. Using measures of race to make clinical predictions: decision making, patient health, and fairness. Proc Natl Acad Sci 120: e2303370120. 10.1073/pnas.2303370120
- ↵Maples BK, Gravel S, Kenny EE, Bustamante CD. 2013. RFMix: a discriminative modeling approach for rapid and robust local-ancestry inference. Am J Hum Genet 93: 278–288. 10.1016/j.ajhg.2013.06.020
- ↵Mas-Sandoval A, Mathieson S, Fumagalli M. 2023. The genomic footprint of social stratification in admixing American populations. eLife 12: e84429. 10.7554/eLife.84429
- ↵Mersha TB, Abebe T. 2015. Self-reported race/ethnicity in the age of genomic research: its potential impact on understanding health disparities. Hum Genomics 9: 1. 10.1186/s40246-014-0023-x
- ↵Nait Saada J, Kalantzis G, Shyr D, Cooper F, Robinson M, Gusev A, Palamara PF. 2020. Identity-by-descent detection across 487,409 British samples reveals fine scale population structure and ultra-rare variant associations. Nat Commun 11: 6130. 10.1038/s41467-020-19588-x
- ↵Naseri A, Tang K, Geng X, Shi J, Zhang J, Shakya P, Liu X, Zhang S, Zhi D. 2021. Personalized genealogical history of UK individuals inferred from biobank-scale IBD segments. BMC Biol 19: 1–12. 10.1186/s12915-021-00964-y
- ↵National Academies of Sciences Engineering and Medicine. 2023. Using population descriptors in genetics and genomics research: a new framework for an evolving field. The National Academies Press, Washington, DC.
- ↵Palamara PF, Lencz T, Darvasi A, Pe’er I. 2012. Length distributions of identity by descent reveal fine-scale demographic history. Am J Hum Genet 91: 809–822. 10.1016/j.ajhg.2012.08.030
- ↵Pearl J. 2001. Direct and indirect effects. In Proceedings of the seventeenth conference on uncertainty in artificial intelligence, Seattle, pp. 411–420. Morgan Kaufmann, San Francisco.
- ↵Pebesma E, Bivand R. 2018. sf: simple features for R. R package version 0.6-3. URL: cran.r-project.org/package=sf 2.
- ↵Popejoy AB. 2021. Too many scientists still say Caucasian. Nature 596: 463. 10.1038/d41586-021-02288-x
- ↵Poplin R, Chang PC, Alexander D, Schwartz S, Colthurst T, Ku A, Newburger D, Dijamco J, Nguyen N, Afshar PT, 2018. A universal SNP and small-indel variant caller using deep neural networks. Nat Biotechnol 36: 983–987. 10.1038/nbt.4235
- ↵Ralph P, Coop G. 2013. The geography of recent genetic ancestry across Europe. PLoS Biol 11: e1001555. 10.1371/journal.pbio.1001555
- ↵R Core Team. 2025. R: a language and environment for statistical computing. R Foundation for Statistical Computing, Vienna. https://www.R-project.org/.
- ↵Robins JM. 1986. A new approach to causal inference in mortality studies with a sustained exposure period: application to control of the healthy worker survivor effect. Math Model 7: 1393–1512. 10.1016/0270-0255(86)90088-6
- ↵Rosenberg NA, Pritchard JK, Weber JL, Cann HM, Kidd KK, Zhivotovsky LA, Feldman MW. 2002. Genetic structure of human populations. Science 298: 2381–2385. 10.1126/science.1078311
- ↵Shemirani R, Belbin GM, Avery CL, Kenny EE, Gignoux CR, Ambite JL. 2021. Rapid detection of identity-by-descent tracts for mega-scale datasets. Nat Commun 12: 3546. 10.1038/s41467-021-22910-w
- ↵Shemirani R, Belbin GM, Cullina S, Caggiano C, Gignoux CR, Zaitlen N, Kenny EE. 2026. A spectral component approach leveraging identity-by-descent graphs to address recent population structure in genomic analysis. Genome Res 36: 534–546. 10.1101/gr.280659.125
- ↵Speed D, Balding DJ. 2015. Relatedness in the post-genomic era: is it still useful? Nat Rev Genet 16: 33–44. 10.1038/nrg3821
- ↵Tan T, Atkinson EG. 2023. Strategies for the genomic analysis of admixed populations. Annu Rev Biomed Data Sci 6: 105–127. 10.1146/annurev-biodatasci-020722-014310
- ↵Tang K, Naseri A, Wei Y, Zhang S, Zhi D. 2022. Open-source benchmarking of IBD segment detection methods for biobank-scale cohorts. GigaScience 11: giac111. 10.1093/gigascience/giac111
- ↵Tran HM, Tsai FJ, Lee YL, Chang JH, Chang LT, Chang TY, Chung KF, Kuo HP, Lee KY, Chuang KJ, 2023. The impact of air pollution on respiratory diseases in an era of climate change: a review of the current evidence. Sci Total Environ 898: 166340. 10.1016/j.scitotenv.2023.166340
- ↵VanderWeele TJ, Ding P. 2017. Sensitivity analysis in observational research: introducing the e-value. Ann Intern Med 167: 268–274. 10.7326/M16-2607
- ↵VanderWeele TJ, Vansteelandt S. 2014. Mediation analysis with multiple mediators. Epidemiol Methods 2: 95–115. 10.1515/em-2012-0010
- ↵Vansteelandt S, Daniel RM. 2017. Interventional effects for mediation analysis with multiple mediators. Epidemiology 28: 258–265. 10.1097/EDE.0000000000000596
- ↵Vigeland MD. 2021. Pedigree analysis in R. Academic Press.
- ↵Zhou X, Stephens M. 2012. Genome-wide efficient mixed-model analysis for association studies. Nat Genet 44: 821–824. 10.1038/ng.2310
- ↵Zhou Y, Browning SR, Browning BL. 2020. A fast and simple method for detecting identity-by-descent segments in large-scale data. Am J Hum Genet 106: 426–437. 10.1016/j.ajhg.2020.02.010