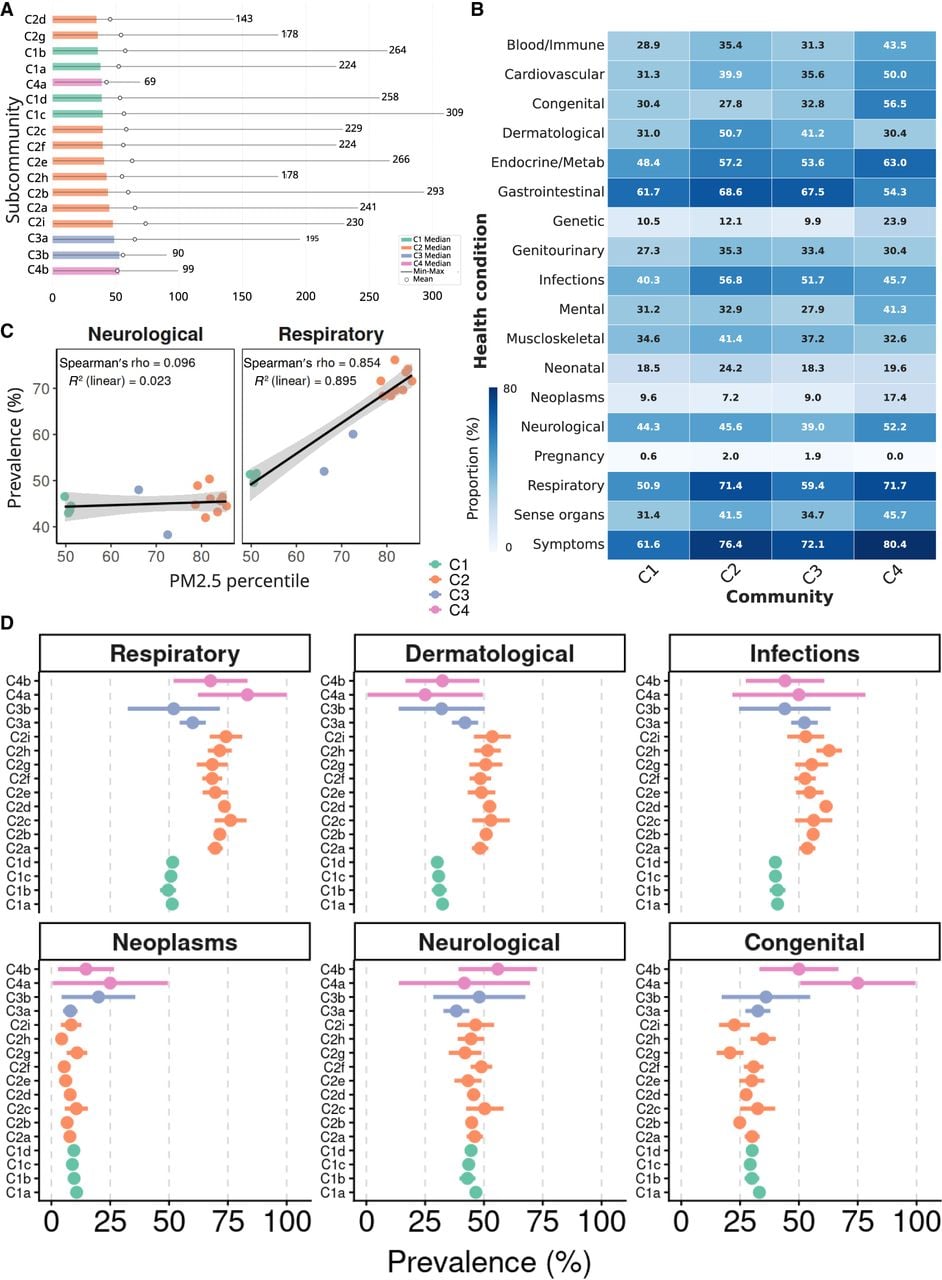
Health conditions across subcommunities. (A) Bar plot illustrating the median number of hospital visits per individual in subcommunities. Mean and maximum are also indicated. (B) Heatmap showing the proportion of phenotypes coded by PheCodes at the main community level (C1, C2, C3, C4), with each cell reflecting the percentage of individuals displaying a specific category (e.g., Respiratory, Neurological, Infections, etc.). (C) Regression between prevalence and PM2.5 for Neurological and Respiratory conditions. Each dot represents one subcommunity, colored by its parent community. (D) Proportion of phenotypes at the subcommunity level and 95% confidence intervals, colored by community C1, C2, C3. Subcommunities from C4 were excluded due to the high uncertainty associated with fewer individuals (complete results are shown in Supplemental Fig. S6).