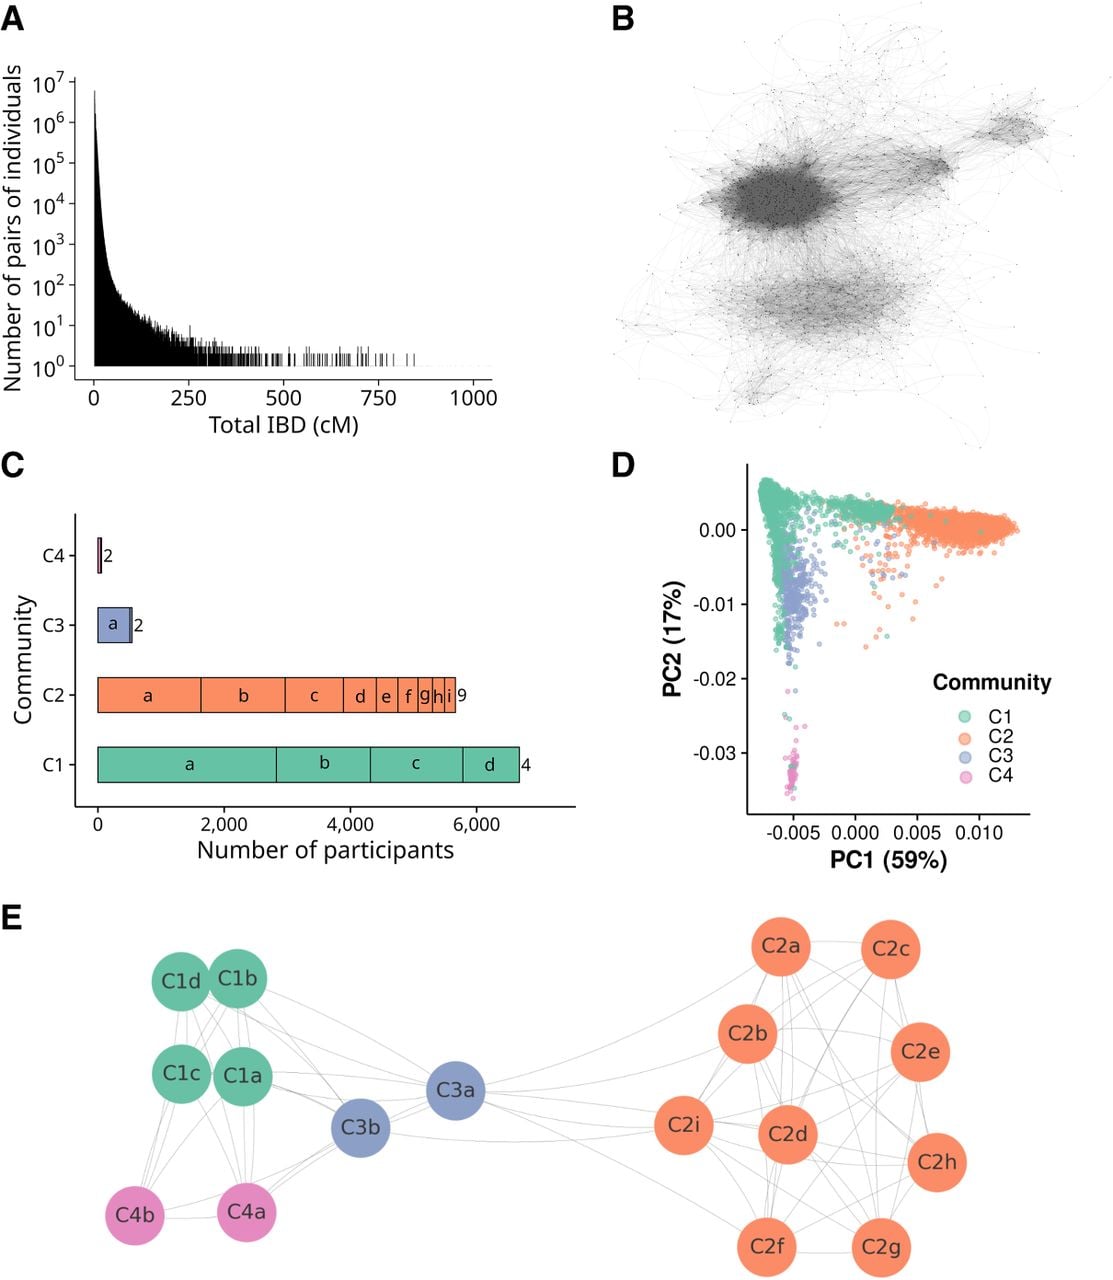
Identity-by-descent (IBD) community detection on the BIG cohort. (A) Distribution of total IBD (cM) detected. (B) IBD-based network with 13,143 nodes, revealing four denser areas surrounded by sparse zones, suggesting a structured network. Fruchterman-Reingold layout was used to do the plot (Gajdoš et al. 2016). (C) Community sizes after the first Leiden stage (C1 to C4), and size of the subcommunities (small case letters on bars) derived from the second Leiden stage. (D) PCA plot showing sample distribution across the first two PCs. Colors represent the communities. The first two principal components explain 76% of the variance among the leading 20 principal components (6.8% of the total genetic variance), the leading axis reflecting continental structure. (E) Network of subcommunities highlighting diversity and inter-connectivity (Fruchterman-Reingold layout). Connections between subcommunities are based on total IBD.