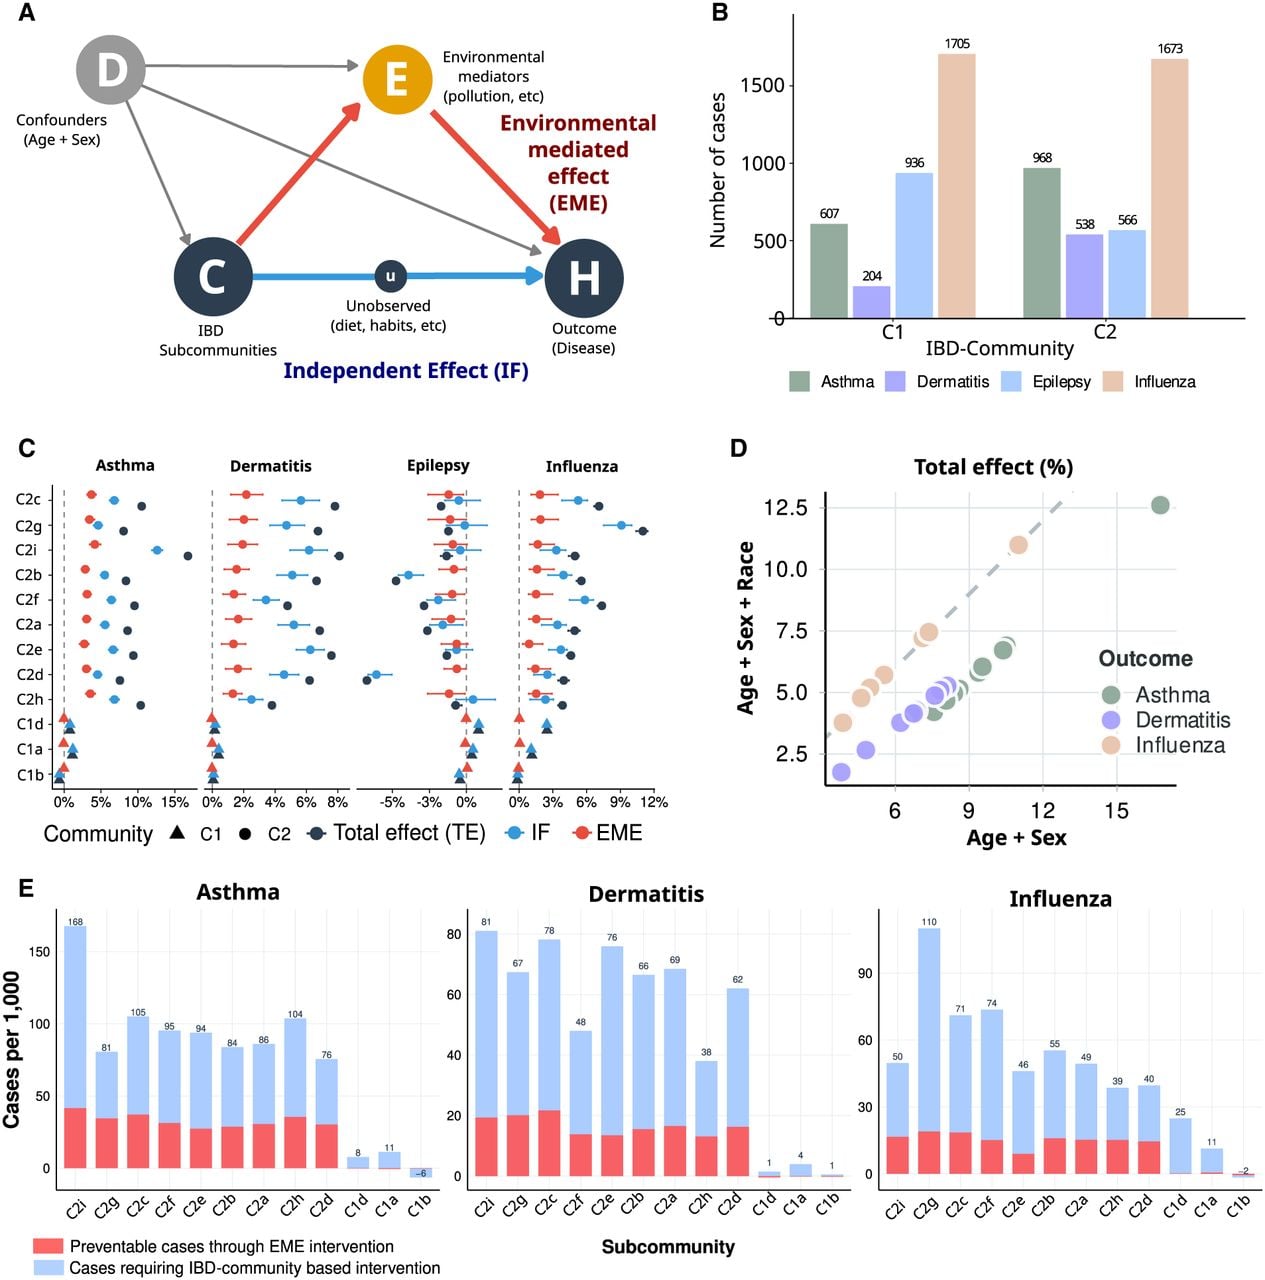
Prevalence of health conditions and decomposition of community effects on health. (A) Directed acyclic graph (DAG) summarizing assumed relationships among baseline confounders (D), exposure (IBD subcommunity, C), mediators (environment, E), and outcome (health, H); the environmental mediator node E encompasses residential location and the neighborhood exposures it determines, which therefore lie on the community–health path (C → E → H) as mediators rather than confounders and are not conditioned on. (B) Number of individuals with influenza, asthma, epilepsy, and dermatitis by community (C1–C3). (C) Risk difference (RD) relative to a reference community (C1c) for each condition, decomposed into the independent factor (IF; blue), the environmentally mediated effect (EME; orange), and the total effect (TE; black); points denote estimates and horizontal bars indicate 95% confidence intervals. The vertical dashed line marks RD = 0. (D) Total effect for each subcommunity comparing the standard set of confounders (Age + Sex) with the addition of self-reported race. (E) Number to be treated analysis showing the number of individuals whose disease could be prevented through equalization of environmental exposures (EME), and the number requiring further investigation of IBD-community-specific factors (IF).