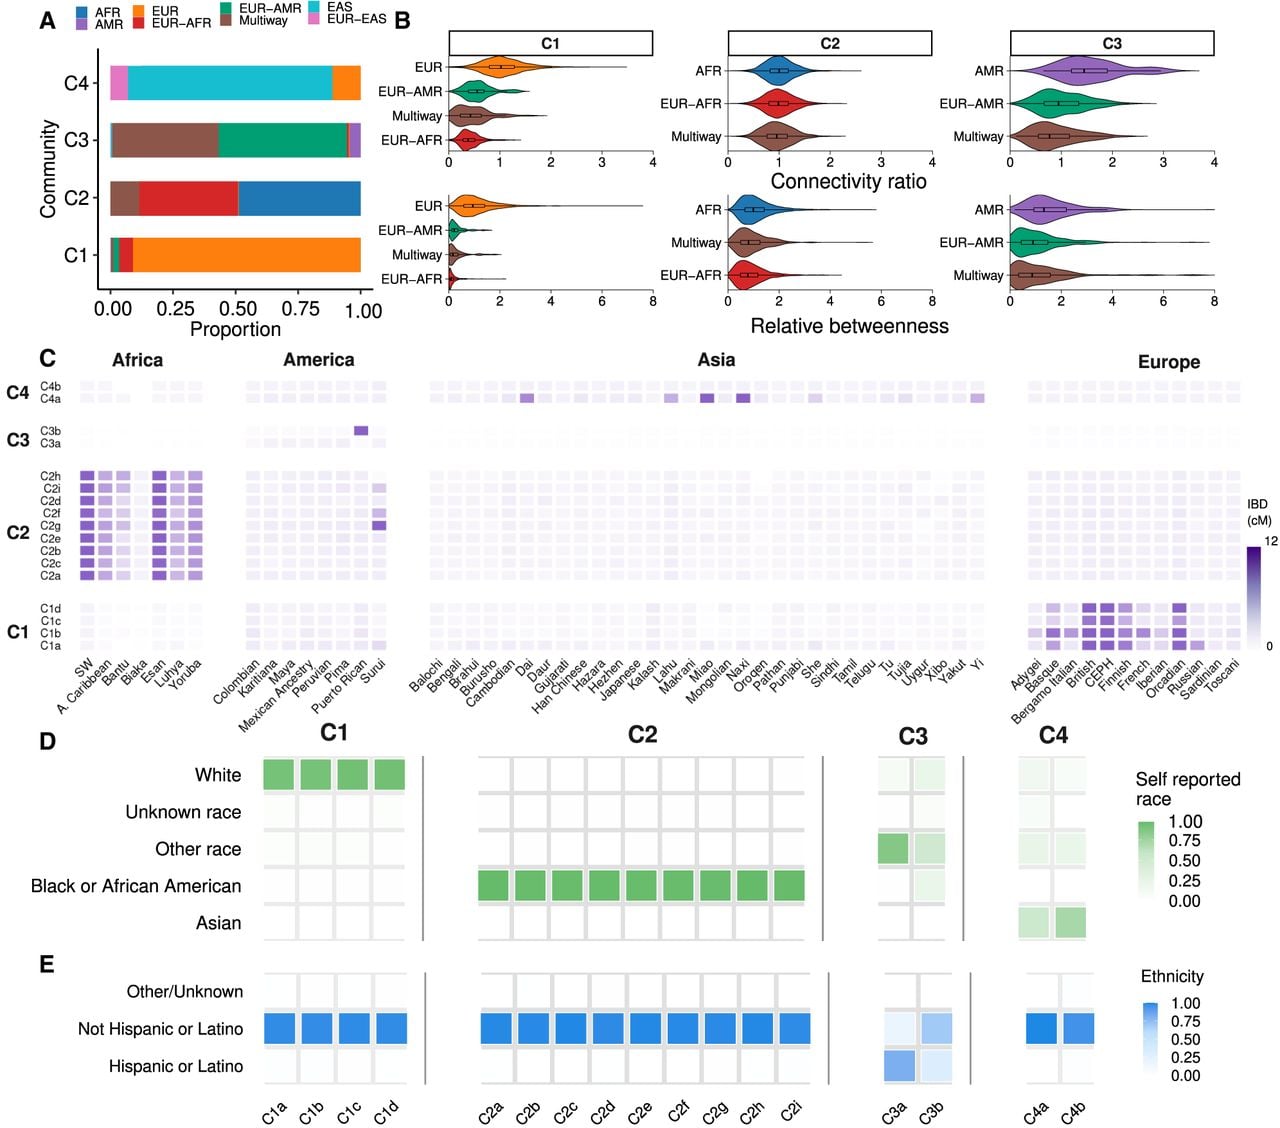
Genetic and demographic patterns across sub-communities. (A) Inferred continental and admixed ancestries per community from previous work. (B) Ancestry’s role in the IBD-network. Connectivity ratio for each node was defined as its degree divided by the mean degree of its IBD community. Values greater than 1 indicate higher connectivity compared to the average. Betweenness measures the centrality of individuals in communities; individuals with betweenness above 1 are more central, whereas values below 1 indicate more peripheral individuals. (C) Heatmap showing mean IBD values between subcommunities and reference populations, highlighting distinct genetic relationships across C1 to C4. (D) Distribution of self-reported race (HL7 v2.5 categories), and (E) self-reported Hispanic/Latino ethnicity proportions within subcommunities.