

Abstract
Chromatin immunoprecipitation followed by sequencing (ChIP-seq) is widely used to study the genomic localization of DNA-associated proteins. However, conventional protocols include multiple manual steps that can introduce inconsistency and limit scalability, thereby restricting the inclusion of appropriate replicates and controls. Although the introduction of liquid handling platforms has improved reproducibility, most existing efforts have automated only a subset of the workflow, and extending automation to efficiently map nonhistone proteins, such as chromatin regulators, remains challenging. Here, we present a fully automated implementation of our previously developed single-pot ChIP-seq protocol, named spa-ChIP-seq, which enables scalable processing of eight to 96 ChIP-seq samples from cross-linked cells to a sequencing-ready library in approximately 3 days with an estimated cost of $70 per sample. Benchmarking spa-ChIP-seq against manual ChIP-seq performed in parallel demonstrates a comparable signal-to-noise ratio between the two workflows. Using spa-ChIP-seq, we systematically evaluate multiple parameters including shearing and cross-linking conditions, buffer compositions, and the ratio of antibody to cell number. We find, for the first time to our knowledge, that weaker genomic localization signals are sensitive to changing the antibody–to–cell-number ratio, whereas the stronger signals remain unaffected. This finding underscores the importance of maintaining consistent antibody–to–cell-number ratio for comparative studies, such as treatment responses or chromatin-QTL mapping. The spa-ChIP-seq protocol is publicly available, including deck setups, operational parameters, and scripts. We envision that this robust, cost-efficient protocol will facilitate high-throughput, reproducible ChIP-seq analyses, supporting large-scale studies of antibody validation, compound screening, population genomics, and diagnostic frameworks.
Chromatin immunoprecipitation followed by sequencing (ChIP-seq) is a well-established method for studying the genomic localization of DNA-associated proteins. ChIP-seq is widely used to study histone modifications, chromatin regulators (CRs), transcription factors (TFs), and other DNA-associated proteins (Barski et al. 2007; Johnson et al. 2007; Mikkelsen et al. 2007; Furey 2012). The commonly used ChIP-seq method has led to significant insights about principles of gene regulation and function of the epigenome in both normal and disease conditions (Park 2009; Mundade et al. 2014). Although ChIP-seq is useful, the overall experimental workflow involves multiple steps that increase the risk of introducing inconsistency within experiments and between groups, making analysis across ChIP-seq data sets challenging. These challenges were partially addressed by the incorporation of automated liquid handling platforms to improve the robustness of the process (Garber et al. 2012; Aldridge et al. 2013; Blecher-Gonen et al. 2013; Gasper et al. 2014; Busby et al. 2016). Yet, most of the previous efforts (Garber et al. 2012; Blecher-Gonen et al. 2013; Gasper et al. 2014) have automated only a subset of the ChIP-seq steps (for details, see below). Additionally, the majority of current automated ChIP-seq protocols are limited in their ability to efficiently map nonhistone proteins, such as CRs that may interact only indirectly with DNA (e.g., by being associated with modified histones or histone variants).
Commonly, ChIP-seq cross-linking involves a single step of formaldehyde (FA) to create covalent bonds between proteins and DNA. However, FA is a small molecule and only captures interactions in the range of 2.3 Å–2.7 Å, which limits the distance of protein interactions captured (Sutherland et al. 2008). Thus, to enable detection of protein interactions occurring between molecules that are further apart, larger FA-compatible cross-linkers, such as disuccinimidyl glutarate (DSG), that can form cross-links of ∼7.7 Å, can be combined with FA. Double cross-linking was shown to be a highly effective and reproducible method for capturing the binding of protein complexes or TFs (e.g., NF-kB and STAT3) and identifying genomic targets for protein–DNA binding with high signal-to-noise ratios (SNRs) (Nowak et al. 2005; Tian et al. 2012).
Moreover, effective chromatin solubilization is also critical in the ChIP-seq workflow as it directly influences the immunoprecipitation performance, sonication efficiency, and experiment reproducibility. A wide range of lysis buffers using different detergents have been developed to facilitate nuclear disruption and the release of cross-linked chromatin. These lysis buffers help to generate soluble chromatin preparation, balancing effective lysis and nuclear disruption with the preservation of chromatin–protein interactions.
Another important aspect of ChIP-seq workflow is the ratio of antibody to cell number, as this ratio can influence enrichment efficiency during immunoprecipitation. Usually, the vendor experimentally validates and titrates the antibody to yield an optimal titer for each antibody, yet different vendors may have different validation methods, and the available recommendations may not be suitable for all applications (Marx 2019). Using fixed amounts of antibody when cell numbers differ across samples or conditions can lead to suboptimal enrichment, increased background, and variability in ChIP-seq quality (Caride et al. 2023).
We recently developed and published a detailed single-pot ChIP-seq protocol that incorporates an on-bead library preparation step (Texari et al. 2021). Here, we adapted this single-pot ChIP-seq protocol to a liquid handler operation and created an end-to-end fully automated version that uses a 96-well sonicator. We first benchmarked our single-pot automated ChIP-seq (spa-ChIP-seq) against manual ChIP-seq to ensure high-quality data are produced. The spa-ChIP-seq protocol enables simultaneous processing of a maximum of 96 samples (a full 96-well plate) in a time- and cost-effective manner that would not be feasible with manual ChIP-seq. It allowed us to evaluate multiple parameters, including double cross-linking, shearing conditions, lysis buffer compositions, and antibody–to–cell-number ratios. We demonstrated the utility of our automated method by identifying optimal ChIP-seq conditions for both histone and nonhistone proteins. We have streamlined the automation process, made the protocols generalizable, tailored the deck settings, and packaged the individual protocols into a user-friendly interface. Our automated ChIP-seq protocol is publicly available, including the specific deck setups, software files, and parameters (see Data access). We envision that our robust, cost-efficient protocol can advance research efforts via multiple fronts. These include (1) allowing the scaling up the number of replicates and conditions tested in each experiment, (2) improving quantification precision when using spike-in normalization in ChIP-seq experiments (Patel et al. 2024, 2025), (3) enabling core facilities to provide high-throughput ChIP-seq as a service, and (4) being incorporated into antibody evaluation procedures (Landt et al. 2012; Wardle and Tan 2015; Mendoza-Parra et al. 2016), compound screening (Zou et al. 2022), population genomics (Waszak et al. 2015), and diagnostic frameworks (Yan et al. 2016).
Results
Establishment and evaluation of a spa-ChIP-seq protocol
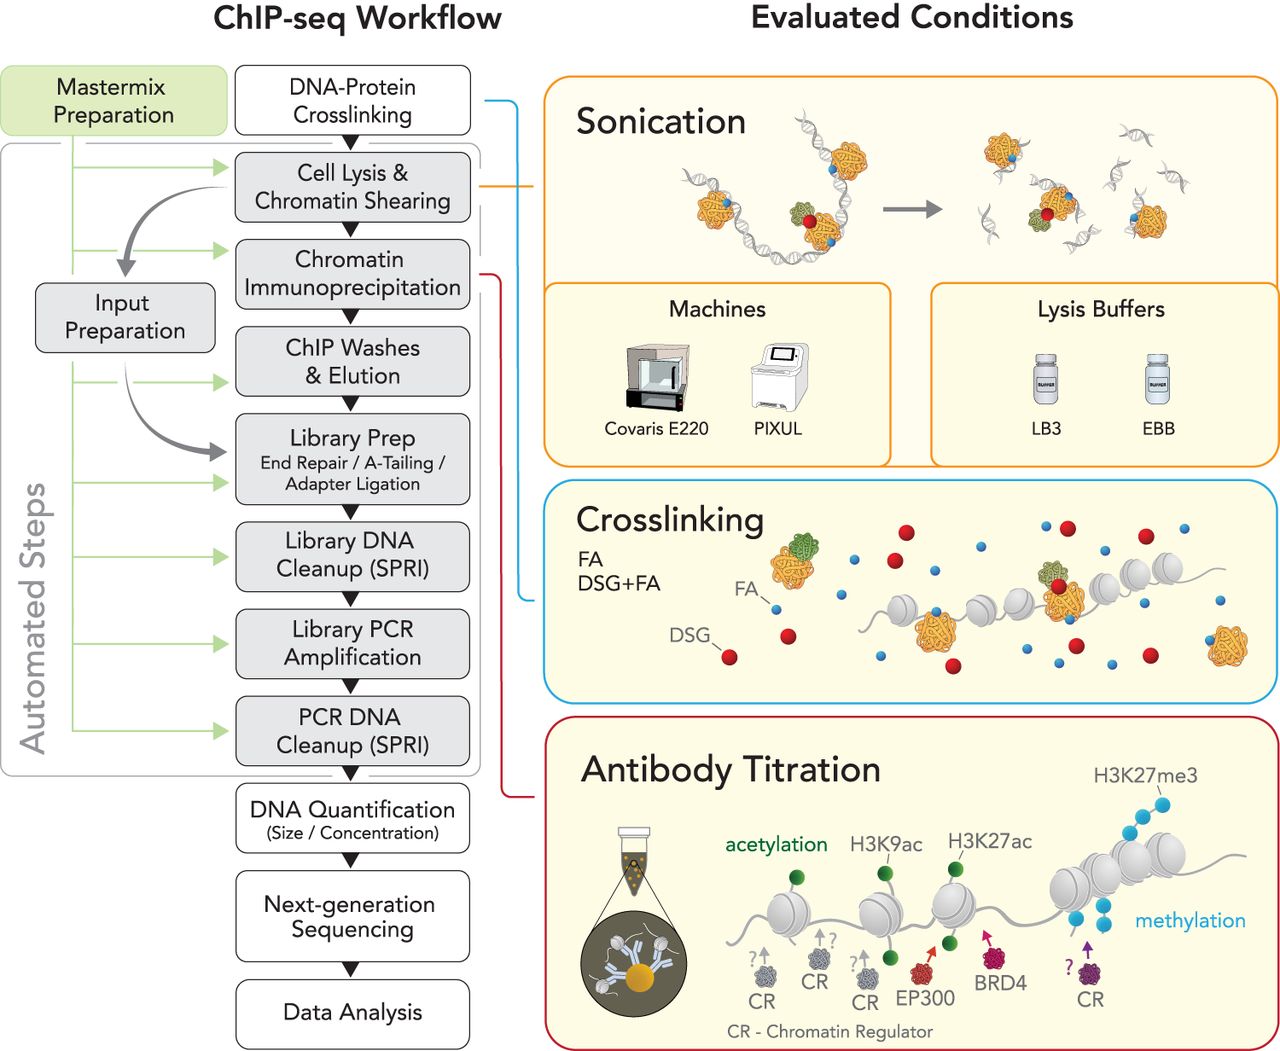
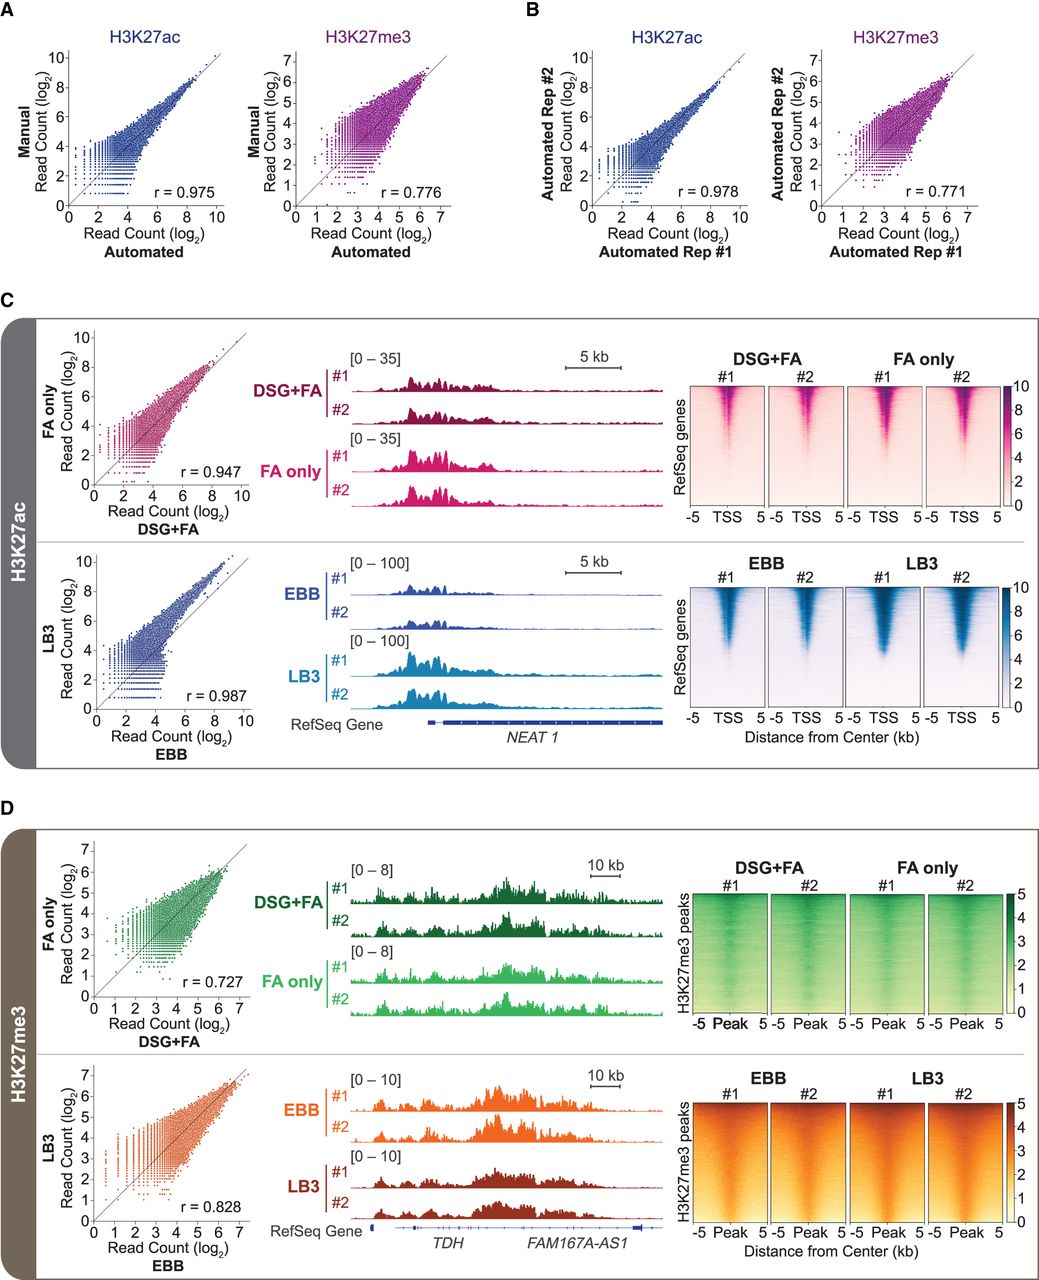
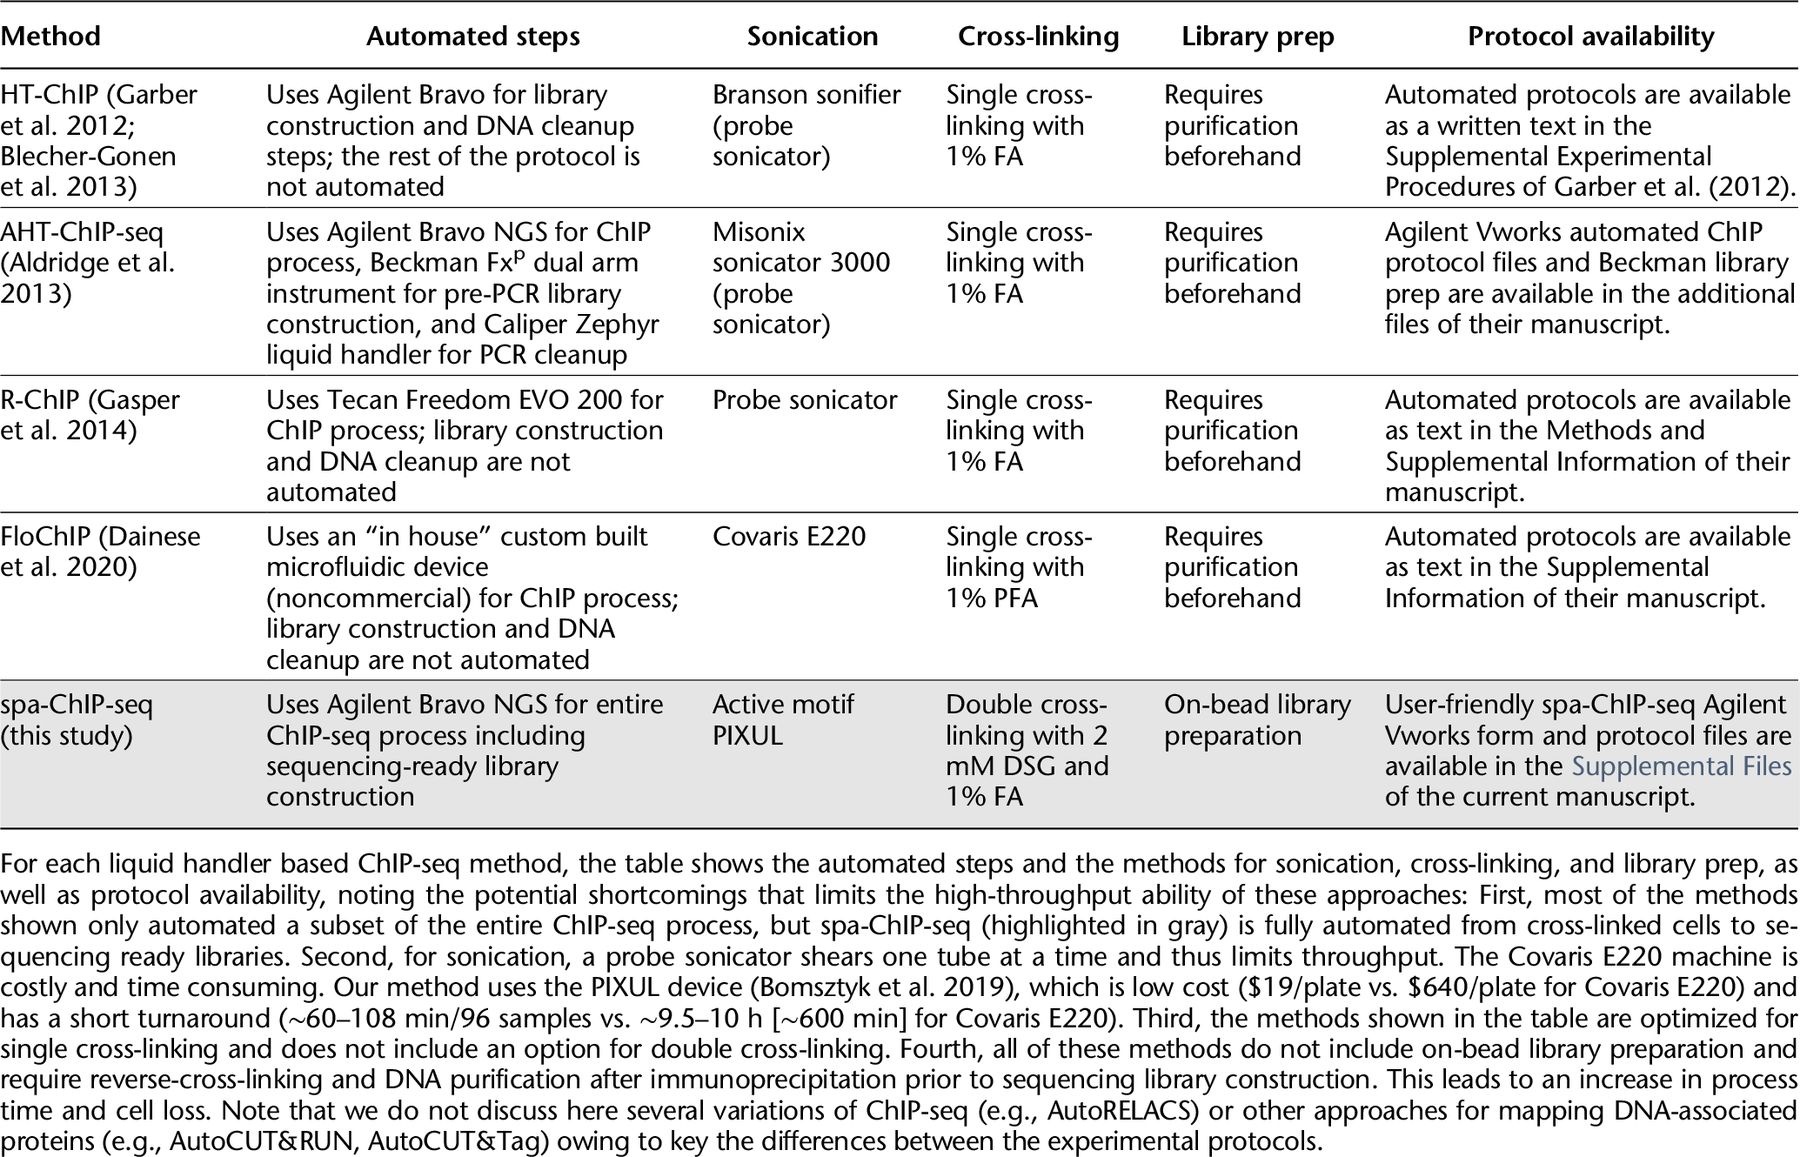
We built on our previous automated ChIP-seq setup with a liquid handling robot (Busby et al. 2016) and modified the parameters to accommodate our recent single-pot ChIP-seq protocol (Texari et al. 2021) to establish spa-ChIP-seq. Both the manual and automated workflows take ∼3 days (starting from fixed cells) to produce sequencing-ready indexed libraries. Differing from previously established methods (Table 1), spa-ChIP-seq workflow automates all steps of the ChIP-seq process with a liquid handler, although it does require the manual preparation of master mixes and buffers prior to the run (Fig. 1). Although both workflows can process a similar number of samples within a similar time frame, the incorporation of a liquid handler substantially reduces pipetting and handling errors, minimizing experimental variability, especially in larger-scale experiments. Our automated process is scalable, and can accommodate between 8 and 96 ChIP-seq reactions (ideally in increments of eight), at a cost of approximately $70 per sample (Supplemental Table S1). We first identified multiple experimental variables that could be optimized and tested (Fig. 1). We then assessed the performance of our automated ChIP-seq protocol by benchmarking it against the manual ChIP-seq using the exact same input material. To conduct this initial benchmarking, we focused on both H3K27ac, a histone modification that is associated with open chromatin, and H3K27me3, a histone mark that is linked to repressive heterochromatin. The ChIP-seq SNRs for H3K27ac and H3K27me3 were highly concordant between the manual and automated ChIP-seq workflows and between the automated replicates, validating the liquid handler settings we optimized and the reproducibility of our automated protocol (Fig. 2A,B).
Overview of the spa-ChIP-seq workflow and evaluated ChIP-seq experimental conditions. The automated steps of the ChIP-seq workflow are highlighted in the gray boxes of the flowchart on the left and the evaluated experimental conditions in the yellow boxes. The green box shows the required manual preparations of master mixes prior to the start of each automated step. The cross-linking reagent formaldehyde (FA) is represented as a small blue dot, and disuccinimidyl glutarate (DSG) is represented as a large red dot.
Systematic evaluation of spa-ChIP-seq with comparison to manual workflow, cross-linking conditions, and buffer compositions. (A,B) Scatterplots comparing normalized read counts (log2) between automated and manual ChIP-seq samples (A) and automated replicates (B) at H3K27ac or H3K27me3 shared peaks. (C,D) Scatterplots of read counts (log2) on shared peaks, IGV (Robinson et al. 2011) tracks, and heatmaps of ±5 kb from the center of transcription start sites (TSSs) or peaks showing the automated ChIP-seq results of H3K27ac (C) and H3K27me3 (D) for evaluating cross-linking conditions, DSG+FA versus FA only (top), and buffer compositions, EBB versus LB3 (bottom). The Pearson r correlation coefficients are reported on the lower right corner of the scatterplots. A total of 32 ChIP-seq experiments were performed, 16 of them using spa-ChIP-seq and 16 of them using manual ChIP-seq, with additional data in Supplemental Figure S2.
Comparison of spa-ChIP-seq protocol to other automated ChIP-seq approaches
Identification of optimal shearing conditions, buffer composition, and cross-linking using spa-ChIP-seq
Most of the initial automation efforts (Garber et al. 2012; Aldridge et al. 2013; Blecher-Gonen et al. 2013) has focused on using a probe sonicator such as Branson, which is limited to shearing one sample at a time. Here, we aimed to use a 96-well format sonicator. In previous work (Busby et al. 2016), we used the Covaris E220 device that allows shearing of up to 96 samples. However, as the Covaris E220 sonicates only one sample at a time, shearing of 96 samples requires ∼10 h. This limitation leads to the samples being kept for a long time within the Covaris E220 before the addition of antibodies and extends the time it takes to perform the protocol. A recently introduced sonication device, PIXUL (Bomsztyk et al. 2019), enables the shearing of 96 samples in only 1–2 h and also reduces the costs of the plate used for sonication by 30-fold (Supplemental Table S1). We decided to evaluate the ability of PIXUL to reproducibly shear samples in a manner that is at least comparable to the Covaris E220. For both devices, we additionally tested the impact of placing samples at different locations within the 96-well plate (Supplemental Fig. S1A). Although the samples sheared by the different devices had distinct size distributions (∼250 bp for Covaris E220 and ∼350 bp for PIXUL), both were within the range of 200–600 bp, which is normally used for ChIP-seq (Supplemental Fig. S1A). As the PIXUL machine was significantly faster and about 30-fold lower in costs per plate, we proceeded to use this device for shearing in our tests of subsequent variables using our spa-ChIP-seq.
Next, we compared the ChIP-seq results of the histone modifications H3K27ac and H3K27me3 under single and double cross-linking conditions as well as two different lysis buffer compositions, EBB and LB3 (Methods) (Fig. 2C,D; Supplemental Fig. S2). We used PIXUL to shear about 1 million cross-linked HeLa-S3 cells per well; to reduce variation, following the shearing step, we merged the sheared chromatin from all wells. Next, we split the pool of sheared chromatin between the two conditions (manual or automated ChIP-seq). In total, for this initial evaluation, we performed 32 ChIP-seq experiments, comparing 16 different conditions, each in duplicates.
We observed that the samples treated with the additional cross-linker required longer sonication time in LB3, the lysis buffer we routinely use (Supplemental Fig. S1B). We evaluated the ability of EBB buffer to assist the shearing process. Sonication of the double cross-linked samples in EBB for 60 min provided optimal fragmentation patterns. This fits with prior work (Métivier et al. 2003). We overcame the inefficient fragmentation of double cross-linked samples in LB3 buffer (Supplemental Fig. S1B) by increasing the sonication time to 90–120 min. The longer shearing time provided optimal shearing patterns. Thus, both buffers were able to generate fragment sizes of 200–600 bp and were subsequently used to determine their performance in ChIP-seq.
Next, we used the double cross-linked samples and performed ChIP-seq of H3K27ac and H3K27me3, lysed with either EBB or LB3. Overall, we observed that the samples sheared in EBB had lower SNR compared with the ones sonicated in LB3, potentially owing to the high SDS levels in the EBB buffer (1% SDS; Methods) (Fig. 2C,D; Supplemental Fig. S2A–D, S2G,H). Given the lower SNR we obtained when using EBB, we conducted the rest of the experiments only with LB3 buffer and sonicated the double cross-linked samples for 108–120 min. Using these conditions, the H3K27me3 and H3K27ac ChIP-seq results from the double cross-linked samples were mostly indistinguishable from the single cross-linked ones, providing evidence that the additional cross-linker or longer shearing time did not introduce bias in either active or repressive chromatin environments (Fig. 2C,D; Supplemental Fig. S2A–F). Because double cross-linking with DSG and FA extends the range of captured interactions in ChIP-seq of DNA-associated proteins and does not negatively impact histone modification ChIP-seq results, using double cross-linked cells for both target types offers a feasible and consistent protocol for experiments involving CRs, TFs, and histone marks.
Identification of optimal conditions for genomic mapping of nonhistone DNA-associated proteins
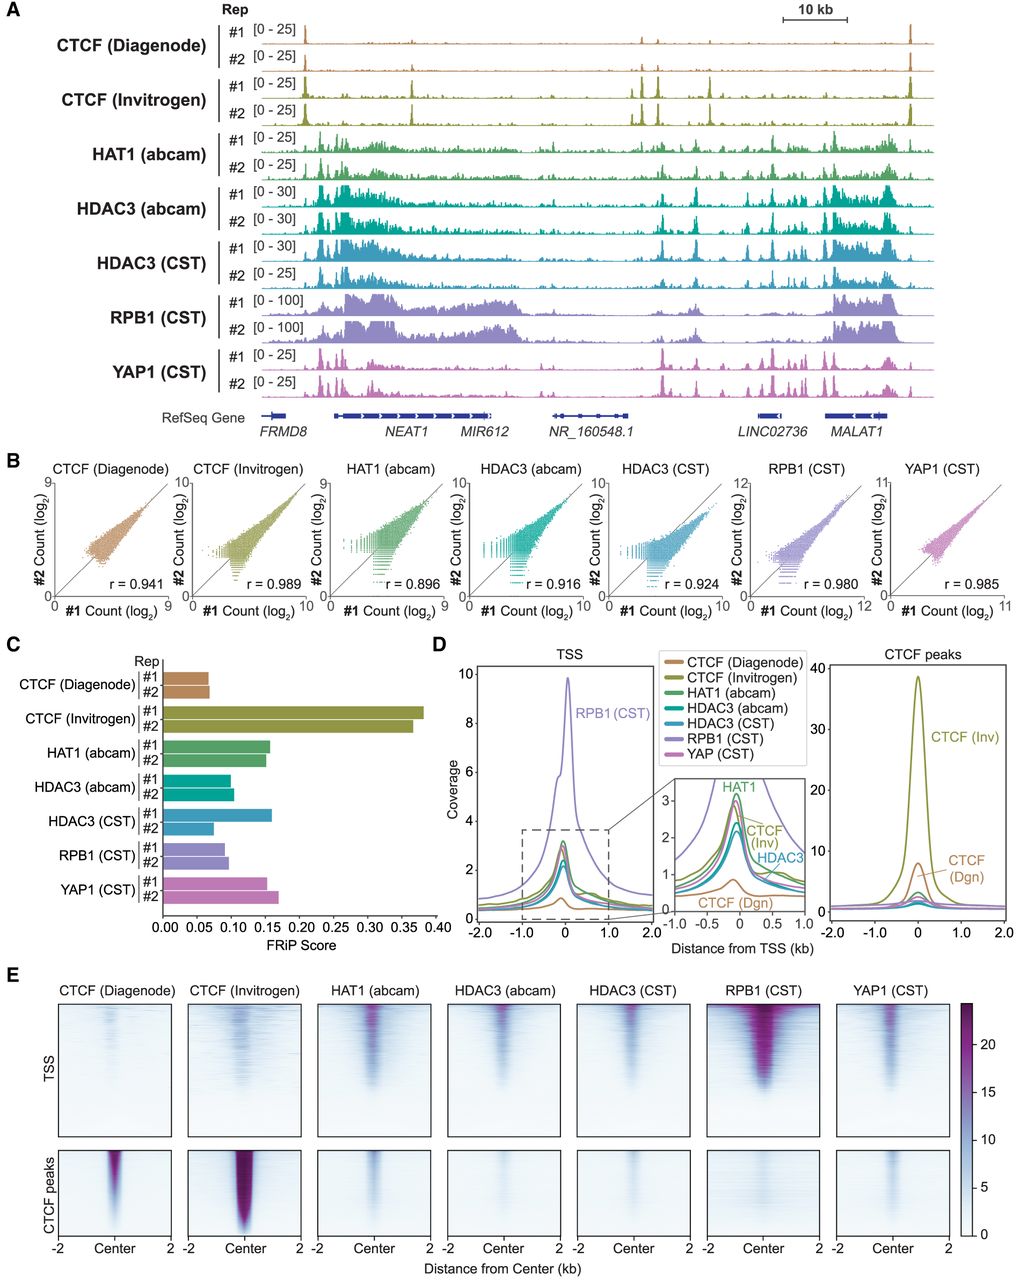
Next, we used the ChIP-seq conditions identified above to map nonhistone proteins in double cross-linked (DSG+FA) HeLa-S3 cells. As a proof of concept, we focused on five DNA-associated proteins (CTCF, HAT1, HDAC3, RPB1 [POLR2A], and YAP1) to perform ChIP-seq, each in two technical replicates (Fig. 3A–E; Supplemental Fig. S3). Following our previous efforts to increase ChIP-seq standardization (Busby et al. 2016), we aimed to mainly focus on monoclonal antibodies and used our automated approach to evaluate between two and four different antibodies for each target protein. Technical replicates had highly reproducible SNRs across six of the seven samples, and the variability observed in the remaining sample was within the expected range of experimental variability (Fig. 3A–C). To further assess antibody performance, we profiled signal enrichment around transcription start sites (TSSs) and known CTCF peaks. Each antibody produced characteristic and biologically consistent enrichment profiles, supporting the specificity and validity of the corresponding ChIP-seq data sets (Fig. 3D,E; Supplemental Fig. S3). Together, these results demonstrate that we successfully mapped all the DNA-associated proteins tested, although a subset of antibodies yielded comparatively weaker enrichment under the conditions evaluated (Supplemental Table S2).
Mapping of DNA-associated proteins using spa-ChIP-seq. (A) IGV tracks showing the ChIP-seq of DNA-associated proteins: CTCF, HAT1, HDAC3, RPB1, and YAP1. The ChIP-seq experiments for CTCF and HDAC3 were performed with two antibodies from two different vendors. Each antibody condition has two technical replicates (labeled as #1 and #2), with a total of 14 ChIP-seq samples. (B) Scatterplots showing the comparison of the two technical replicates at shared peaks for each antibody condition. (C) Bar plot showing fraction of reads in peaks (FRiP) for the ChIP-seq of DNA-associated proteins. For each antibody, both technical replicates (labeled as #1 and #2) are plotted. (D) Histograms showing the average normalized read coverage of the replicates at ±2 kb from the center of TSSs and CTCF peaks. (E) Heatmaps showing the average normalized read density of the replicates at ±2 kb from the center of TSSs (top) and CTCF peaks (bottom). CTCF peaks were obtained from ENCODE (file accession ENCFF502CZS).
The antibody–to–cell-number ratio may impact ChIP-seq results
Another important, yet often overlooked, aspect of ChIP-seq is the ratio between the amount of antibody used for immunoprecipitation and the number of cells (or amount of chromatin) in the reaction. Our automated ChIP-seq protocol significantly simplifies the task of performing multiple antibody titrations, which could be tedious otherwise. We first titrated H3K9ac antibody in HeLa-S3 cells with four different amounts of the antibody, each in replicates. Initial evaluation of the genome browser tracks on the Integrative Genomics Viewer (IGV) and FRiP scores shows that different amounts of antibodies had minimal impact on the global ChIP-seq signal, and the overall trend is that higher amounts of antibodies may lead to only slightly higher ChIP enrichment (Supplemental Fig. S4). However, when we equally divided the ChIP-seq peaks into four quartiles based on the normalized read counts at the peaks, we found that the amount of antibody had a greater impact on ChIP-seq peaks with weaker enrichment, whereas the enrichment signal is constant for the strongest peaks in the experiment (Fig. 4A).
Antibody titration with spa-ChIP-seq reveals that weaker signals are more sensitive to the amount of antibody. (A) Relative total coverage of H3K9ac signal with 0.04 µg, 0.2 µg, 0.4 µg, and 1 µg of antibody for H3K9ac peaks separated into quartiles based on normalized read counts at the peaks (the values are relative to the minimum, which is set to one). Each condition has two technical replicates, with a total of eight ChIP-seq samples. Each plot is fitted with a linear regression line, and the corresponding slope of fitted line is shown in the bar plot on the left. (B) IGV tracks for HA-tag and BRD4 ChIP-seq in dTAG-13- and DMSO-treated HEK293T-BRD4-FKBP12F36V-2xHA cells with 0.5 µL, 1 µL, 2.5 µL, and 5 µL of the HA-tag and BRD4 antibodies, with each amount of antibody performed in replicates for a total of 32 ChIP-seq samples. The tracks of two replicates for each condition are overlaid on one another. (C) Histograms of normalized read coverage for HA-tag and BRD4 antibody titration ChIP-seq signals centered on peaks obtained by using the DMSO samples. The peaks are separated into quartiles according to normalized read counts at the peaks. Relative total coverage of HA-tag and BRD4 signals with 0.5 µL, 1 µL, 2.5 µL, and 5 µL of antibody for each quartile of DMSO peaks shown in the histogram above. The orange and blue triangles represent the increase in the ratio of antibody to cell number in HA-tag and BRD4, respectively. Each condition has two technical replicates.
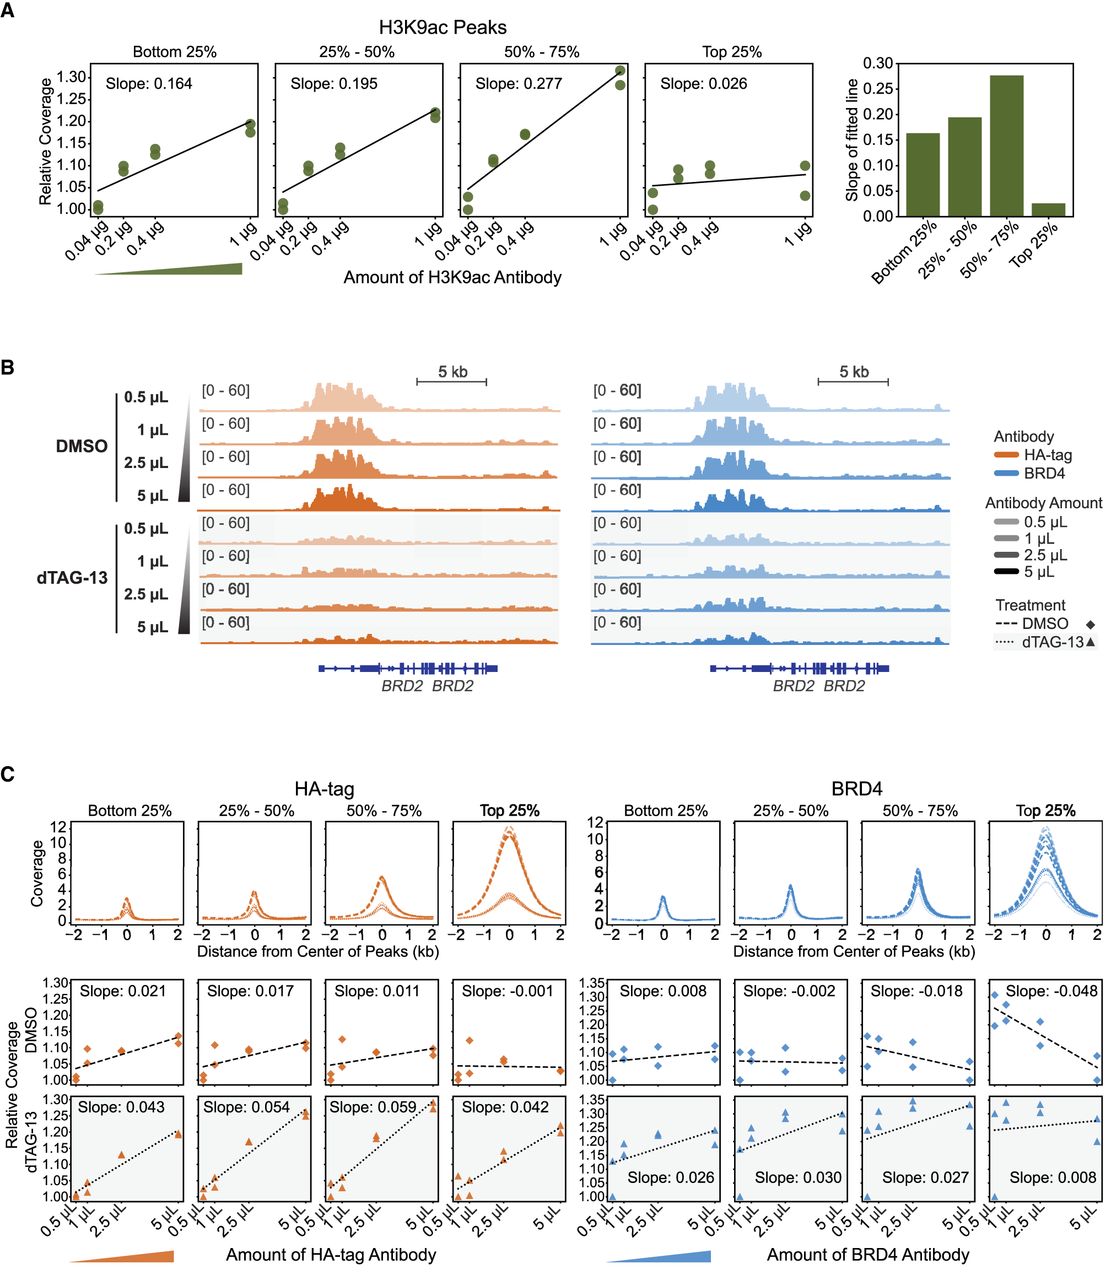
We hypothesized that the weaker signals are more sensitive to the amount of antibody, and to investigate this further, we incorporated a cell line with a knock-in that allows an inducible degradation of the BRD4 protein (HEK293T-BRD4-FKBP12F36V-2xHA (Nabet et al. 2018)). Upon treatment of dTAG-13, the amount of BRD4 epitopes is greatly reduced (Nabet et al. 2018). We performed titration experiments for four different amounts of antibodies targeting HA-tag and BRD4 in both dTAG-13- and DMSO-treated cells. Regardless of the amounts of antibody used, the ChIP-seq signal is reduced in dTAG-13-treated cells for both the HA-tag and BRD4 antibodies (Fig. 4B; Supplemental Fig. S5). When the DMSO peaks for each antibody were separated by quartiles based by their DMSO enrichment, the dTAG-13-treated samples showed an increasing higher signal as the ratio of antibody to cell number increased in all four quartiles regardless of the trend in the DMSO samples (Fig. 4C).
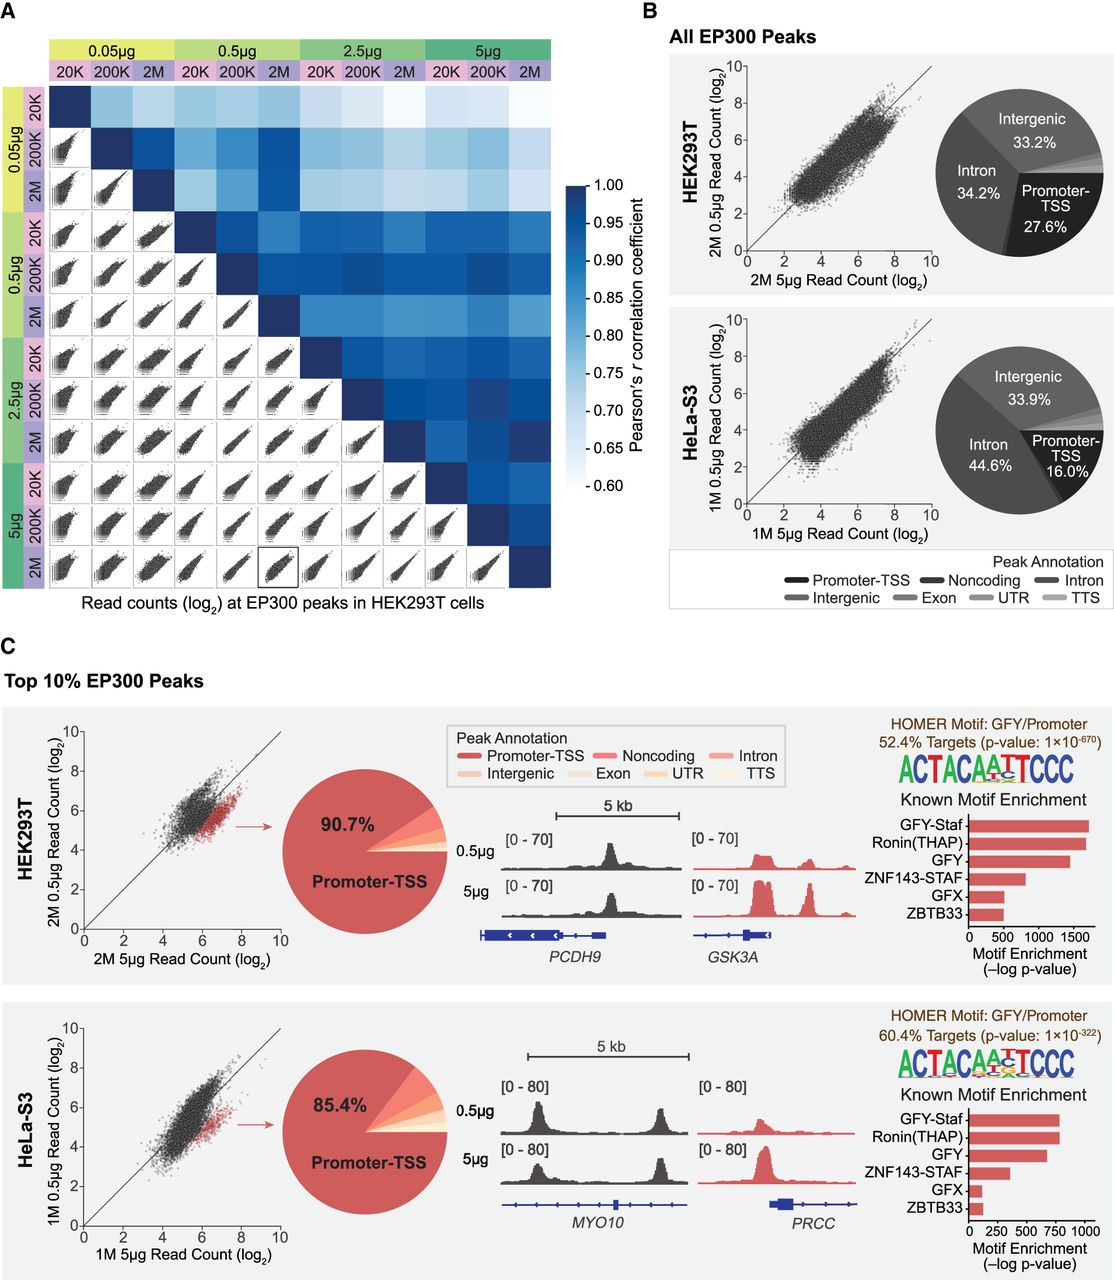
Next, to further study our hypothesis regarding the weaker signals being more sensitive to the antibody–to–cell-number ratio, we focused on EP300, which binds strongly to nonpromoter cis-regulatory elements and is weakly associated with promoter regions (Heintzman et al. 2007; Mendenhall and Bernstein 2008). Using spa-ChIP-seq, we conducted a comprehensive antibody titration experiment in which we varied both the number of cells and the amounts of EP300 antibody (Fig. 5A). In particular, we titrated 0.05 µg, 0.5 µg, 2.5 µg, and 5 µg of EP300 antibody with 20,000, 200,000, and 2 million HEK293T cells. To minimize variability, we used the same chromatin preparation that was split across the different conditions. We observed that, in general, the higher amount of antibody and higher number of cells tended to generate better ChIP-seq SNRs (Supplemental Fig. S6A). Yet, when comparing the normalized read counts on shared EP300 peaks for the different combinations of antibody–to–cell-number ratios with each other, we noticed that samples with distinct ratios did not share similar set of peaks, and the Pearson r correlation coefficients varied across the combinations (Fig. 5A). Thus, given that the same original chromatin extract was used for all conditions, the ratio of EP300 antibody to cell number appears to cause a discrepancy in the ChIP-seq results.
EP300 antibody titration shows that higher antibody–to–cell-number ratio better captures weaker promoter signals. (A) A matrix of scatterplots showing normalized read counts (log2) at EP300 peaks and heatmaps showing Pearson r correlation coefficients for EP300 antibody titrations in HEK293T cells with various antibody–to–cell-number ratios. We conducted a comprehensive comparison of conditions using 0.05 µg, 0.5 µg, 2.5 µg, and 5 µg of EP300 antibody (green shades) and 20,000, 200,000, and 2 million HEK293T cells (pink/purple shades), resulting in a total of 12 ChIP-seq samples. The scatterplot outlined in bold corresponds to the HEK293T sample shown in B. Note that a similar matrix for HeLa-S3 cells is presented in Supplemental Figure S6B. For HeLa-S3 samples, each antibody amount was tested in replicates, yielding a total of eight ChIP-seq samples, and the replicates for each amount were merged for subsequent analysis. (B) Scatterplot of normalized read counts (log2) at all EP300 peaks comparing 0.5 µg and 5 µg of antibody in 2 million HEK293T cells (top) and 1 million HeLa-S3 cells (bottom). The pie chart on the right shows the genomic annotations for all EP300 peaks. The peaks are annotated with HOMER, and the annotations include promoter–TSS, noncoding, intron, intergenic, exon, UTR (5′ UTR and 3′ UTR), and TTS (see legend below the pie chart). (C) Scatterplot of normalized read counts (log2) at the top 10% of EP300 ChIP-seq peaks comparing 0.5 µg and 5 µg of antibody in 2 million HEK293T cells (top) and 1 million HeLa-S3 cells (bottom). The subset of peaks that has higher signal in 5 µg of antibody than in 0.5 µg of antibody is highlighted in red. The pie chart shows the distribution of peak annotations in the red subset highlighted in the scatterplot to the left. IGV tracks show two peak loci, one in the black subset and one in the red subset. HOMER motif analysis identified the same top enriched known motifs in the red subset of peaks for both the HeLa-S3 and HEK293T cells. The motif enrichments are shown in the bar plot as −log P-values.
We conducted a similar antibody titration experiment using a different cell line, HeLa-S3. Here, we only varied the amount of antibody (ranging between 0.5 µg, 1 µg, 2.5 µg, and 5 µg of EP300 antibody) with 1 million HeLa-S3 cells (Supplemental Fig. S6B,C), splitting the exact same chromatin extract across the different antibody amounts to minimize variability, as described above. In a similar manner to our observations in HEK293T cells, we noticed a discrepancy between the genomic patterns between the different ratios of antibody to cell number (Supplemental Fig. S6B).
In both experiments, when we used either HEK293T or HeLa-S3, we noticed that the major discrepancy between antibody–to–cell-number ratios was observed in the regions with the higher EP300 read counts, in particular when comparing the lowest versus the highest ratios (0.5 µg vs. 5 µg EP300 antibody per 1 million HeLa-S3 cells, respectively) (Fig. 5B). To further study this discrepancy, we focused on the top 10th quantile and compared the normalized read counts between the highest and lowest antibody–to–cell-number ratios. This analysis revealed a subset of peaks with stronger enrichment in the higher antibody–to–cell-number ratio (Fig. 5C). Then, we used principal component analysis (PCA) to separate out the subset of peaks that showed an increased signal in samples with higher ratio of antibody to cell number in both cell lines (Supplemental Fig. S6D,E). Annotation of the loci associated with the subset of peaks impacted by the antibody–to–cell-number ratio showed that these regions are predominantly present at promoter–TSS regions with 90% in HEK293T cells and 85% in HeLa-S3 cells, whereas the annotation of the entire set of EP300 peaks showed high localization at nonpromoter intergenic or intron regions, and only 27% (HEK293T) and 16% (HeLa-S3) in promoter regions (Fig. 5B,C). Next, to better define the subset of peaks most impacted by the antibody–to–cell-number ratio, we conducted motif analysis, which identified a GFY motif commonly associated with some active promoter regions. Moreover, in both cell lines, this subset of EP300 peaks was enriched for the same top known motifs (Fig. 5C), further supporting the notion that the weaker or less frequent localization of EP300 at promoter regions leads to the higher sensitivity of these peaks to the ratio of antibody to cell number.
Discussion
We presented here spa-ChIP-seq, a single-pot automated protocol for chromatin profiling. We benchmarked spa-ChIP-seq by performing parallel manual ChIP-seq reactions and demonstrated a high reproducibility and nearly indistinguishable SNR between the manual and automated workflows. We then used spa-ChIP-seq to systematically evaluate several aspects of the ChIP-seq process, including shearing conditions, cross-linking methods, and buffer compositions.
In our hands, the optimal conditions included (1) shearing with the Active Motif PIXUL device (Bomsztyk et al. 2019), which provides a short incubation time and low cost per sample; (2) lysing the cells with LB3, a buffer that requires longer sonication time compared with EBB (potentially owing to the weaker reagent), but the ChIP-seq results had higher SNR than EBB; and (3) using DSG+FA double cross-linking for all ChIP-seq profiling to allow a consistent the experimental procedure regardless of the target epitope. We demonstrated that for histone modifications the SNR was indistinguishable between single (FA) and double (DSG+FA) cross-linking. As nonhistone DNA-associated proteins such as CRs may be less amenable to get cross-linked to the DNA, double cross-linking by DSG and FA can yield ChIP-seq results with robust SNRs. Although FA only forms cross-links of 2.3 Å–2.7 Å, DSG can form cross-links of 7.7 Å, thus potentially capturing longer interactions (Sutherland et al. 2008). In the combination of DSG and FA, DSG first stabilizes the longer protein–protein interactions, and then FA cross-links shorter DNA–protein interactions (Nowak et al. 2005; Tian et al. 2012).
Using spa-ChIP-seq and our optimal set of conditions, we identified a set of mostly monoclonal antibodies for an array of nonhistone DNA-associated proteins, including CTCF, BRD4, HA-tag, HDAC3, HAT1, and YAP1. As we discussed in our previous work (Busby et al. 2016), the use of monoclonal antibodies is critical to allow reproducibility of studies, for example, between groups or over time, as polyclonal reagents are nonrenewable, and each batch may differ from the other. We thus envision that the validation of this set of antibodies and conditions allows reproducible studies with these targets.
A key observation of our study relates to the impact of antibody–to–cell-number ratio in chromatin profiling. Using spa-ChIP-seq, we conducted a set of comprehensive experiments to systematically interrogate the effect of this ratio. For each experiment, we used the exact same chromatin prep, thus only varying the ratios of the antibodies or the number of cells. First, we demonstrated that only the weaker quartiles of H3K9ac peaks are impacted by the antibody–to–cell-number ratio, whereas the upper quartile is not. We then used a BRD4 HA-tagged perturbation system to reduce the amount of epitope by degrading HA-tagged BRD4 and showed that when we titrated either the HA-tag or BRD4 antibodies following depletion of the target, the normalized ChIP enrichment signal was impacted by the antibody–to–cell-number ratio much more than prior to depletion. Lastly, we focused on EP300, which has both strong (enhancer/cis-regulatory elements) and weak (promoter) binding sites (Heintzman et al. 2007; Mendenhall and Bernstein 2008), and systematically titrated both the number of cells and the amount of antibody in two cell lines. This allowed us to identify a subset of the peaks that show enhanced sensitivity to the antibody–to–cell-number ratio and to show that they are highly enriched for promoter signatures. Thus, our results highlight the importance of maintaining the ratio of antibody to cell number as constant as possible, in particular in chromatin profiling experiments aimed at studying the impact of perturbations (e.g., by small molecules or CRISPRi) to allow proper comparisons.
Altogether, our study highlights the usefulness of spa-ChIP-seq in conducting comprehensive, systematic studies. The method reduces hands-on time and cost per sample, and the increased throughput (up to 96 samples) was a key component in our ability to conduct our systematic studies. We anticipate that spa-ChIP-seq will allow the scaling up of ChIP-seq studies to improve statistical power and facilitate novel experimental work, including assaying entire population cohorts and large compound libraries, as well as potentially to advance diagnostic approaches.
Methods
Cell culture and fixation (cross-linking)
HeLa-S3 (ATCC CCL-2.2), HEK293T (CRL-3216), and HEK293T-BRD4-FKBP12F36V-2xHA adherent cells were cultured in Dulbecco's Modified Eagle Medium (Gibco DMEM, high glucose, GlutaMAX supplement, with 4.5 g/L D-glucose), supplemented with 10% fetal bovine serum (FBS), 110 mg/L sodium pyruvate, 2 mM L-glutamine, and 1% antibiotic-antimycotic. Cells were incubated at 37°C with 5% CO2 and 95% air. HEK293T-BRD4-FKBP12F36V-2xHA cells were treated with 500 nM of dTAG-13 (Tocris 6605) or DMSO for 24 h. When the cells were grown to confluency, they were either single or double cross-linked. For single cross-linking, cells were incubated with 1% FA solution for 10 min at room temperature. For double cross-linking, cells were incubated first with 2 mM DSG solution for 30 min and then with 1% FA solution for 10 min at room temperature. The cross-linking reaction was quenched by 2.625 M glycine to a final concentration of 0.125 M. The cell pellets were washed with PBS and stored in −80°C.
Chromatin shearing
Cells were lysed with either the LB3 lysis buffer (10 mM Tris-HCl at pH 7.5, 100 mM NaCl, 1 mM EDTA, 0.1% deoxycholate, 0.5% N-lauroylsarcosine, 1× protease inhibitor cocktail) or the EBB lysis buffer (0.5% Empigen BB [Sigma-Aldrich 30326], 1% SDS, 50 mM Tris-HCl at pH 7.5, 10 mM EDTA, 1× protease inhibitor cocktail) (Métivier et al. 2003). Cells were sonicated either on the Active Motif PIXUL sonicator for 60–120 min per plate or on the Covaris E220 sonicator for 6 min per well. After sonication, lysates in EBB lysis buffer were diluted 2.5-fold in EBB dilution buffer (20 mM Tris-HCl at pH 7.5, 100 mM NaCl, 0.5% Triton X-100, 2 mM EDTA, 1× protease inhibitor cocktail).
Analysis of sheared chromatin/input preparation
Manual workflow
Per input sample, a reaction mix (0.5% SDS, 18.75 mM EDTA, 280 mM NaCl, 250 µg/mL Proteinase K, 125 µg/mL RNase A) was added and incubated in a thermocycler for 1 h at 55°C and then for at least 2 h at 65°C. To clean up the input sample, SpeedBead mastermix (2 µL SpeedBeads [Cytiva 65152105050250], 12% PEG8000 final, 1 M NaCl final) was added to each input and incubated for 10 min at room temperature. Then, the input sample was washed twice with 80% EtOH, and the SpeedBead pellet was air-dried. Lastly, the input sample was eluted with TT buffer (0.05% Tween 20, 10 mM Tris at pH 8.0).
Bravo workflow
A reaction mix plate was prepared by equally distributing the total required amount of reaction mix to each well in the first column and placed on Bravo deck 6. After running the Bravo protocol 1a_Input_Prep, the input plate was incubated in a thermocycler for 1 h at 55°C and then for at least 2 h at 65°C. A SpeedBead mastermix plate was prepared by equally distributing the total required amount of SpeedBead mastermix to each well in the first column and placed on Bravo deck 5. After incubation, the input plate was placed back on Bravo deck 4, and Bravo protocol 1b_Input_PEG was run. An ethanol reservoir was placed on deck 9, and a TT buffer reservoir was placed on deck 3. Immediately after incubation with SpeedBead mastermix, Bravo protocol 1c_Input_Speedbead_Cleanup was run to clean up the input samples. At the end of the protocols, the input plate should contain input samples eluted in TT buffer.
Chromatin immunoprecipitation
For all the antibodies used in the immunoprecipitation step, see Supplemental Table S2.
Manual workflow
Dynabeads Protein A or G was resuspended either in LB3 and 1% Triton X-100 for LB3 ChIP samples or in EBB dilution buffer for EBB ChIP samples. Resuspended beads were combined with each antibody to make antibody/beads mix. Per each ChIP sample, sheared chromatin was combined with the antibody/bead mix.
Bravo workflow
The antibody/bead mix was made the same way as the manual workflow. The mix was transferred to tube strips, which were then placed on deck 4. The PIXUL lysate plate was placed on deck 5. Bravo protocol 2_Chromatin_Beads_Antibody_On_Mag was run to combine the chromatin lysate with the antibody/bead mix.
The ChIP samples were incubated overnight, rotating overhead on HulaMixer Sample Mixer in the cold room at 4°C.
ChIP washes
Manual workflow
After overnight incubation, the sample was washed three times with WBI (20 mM Tris at pH7.5, 1% Triton X-100, 2 mM EDTA, 150 mM NaCl, 0.1% SDS, 1× protease inhibitor cocktail), three times with WBIII (10 mM Tris at pH7.5, 0.7% DOC, 1 mM EDTA, 250 mM LiCl, 1× protease inhibitor cocktail), and twice with TET (10 mM Tris at pH7.5, 0.2% Tween-20, 1 mM EDTA, 1× protease inhibitor cocktail). The Dynabeads loaded with each ChIP sample were resuspended in 25 µL of TT buffer (10 mM Tris-HCl at pH 8.0, 0.05% Tween 20).
Bravo workflow
Excessive amounts of wash buffers (WBI, WBIII, and TET) and TT buffer were prepared. A waste reservoir was placed on deck 1; an elution TT buffer reservoir was placed on deck 3; an empty ChIP plate was placed on deck 4; IP tube strips were placed on deck 6; and a wash buffer reservoir was placed on deck 9. Bravo protocol 3_ChIP_Wash_Elution_Off_Mag was run. At the end of the protocol, each well of the ChIP plate should contain 25 µL of ChIP sample/Dynabeads resuspended in TT buffer.
Library construction, reverse cross-linking, and library cleanup
For the IP and input samples, libraries were constructed with the NEBNext Ultra II DNA library prep kit (Illumina E7645L). Indexing adapters were from NEXTflex DNA barcodes 48 (NOVA-514104) and NEXTflex unique dual index barcodes (8NT index, 97-192; NOVA-514151).
Manual workflow
End prep. End prep mastermix (NEBNext Ultra II end prep enzyme mix and NEBNext Ultra II end prep reaction buffer) was added to the ChIP and input samples and incubated for 30 min at 20°C and then 30 min at 65°C in a thermal cycler.
Adapter ligation. We added 0.625 µM of indexing adapters and ligation mastermix (NEBNext Ultra II ligation master mix and NEBNext ligation enhancer) to the ChIP and input samples, which were then incubated for 15 min at 20°C.
Reverse cross-linking. Per sample, the ligation reaction was stopped by adding 27 µL of ligation stop solution mastermix (0.5% SDS, 18.75 mM EDTA, 250 µg/mL Proteinase K, 125 µg/mL RNase A) and 285 mM NaCl. ChIP samples were incubated for 1 h at 55°C and then for at least 2 h at 65°C.
Library cleanup. The supernatant of each sample was separated from Dynabeads Protein A/G and incubated with SpeedBead mastermix (2 µL SpeedBeads, 8.6% PEG8000 final, and 0.8 M NaCl final) for 10 min at room temperature. Then, the input sample was washed twice with 80% EtOH, and the SpeedBead pellet was air-dried. Lastly, the input sample was eluted with TT buffer.
Bravo workflow
End prep. The end prep mastermix plate was prepared by equally distributing the total required amount of the mastermix to each well in the first column and placed on Bravo deck 6. The ChIP sample plate was placed on deck 4. Bravo protocol 4_End_Repair_MM_Dispense was run, and the ChIP plate was incubated for 30 min at 20°C and then 30 min at 65°C in a thermal cycler.
Adapter ligation. The ligation mastermix plate was prepared by equally distributing the total required amount of the mastermix to each well in the first column and placed on Bravo deck 6. The ChIP sample plate was placed on deck 4, and the index plate was placed on deck 5. Bravo protocol 5_Adapter_Ligation_MM was run, and the ChIP plate was incubated for 15 min at 20°C.
Reverse cross-link. The ligation stop solution mastermix plate was prepared by equally distributing the total required amount of the mastermix to each well in the first column and placed on Bravo deck 6. The ChIP sample plate was placed on deck 4, and the 5 M NaCl reservoir was placed on deck 9. Bravo protocol 6_Ligation_Stop_Solution_Disp was run, and the sample was incubated for 1 h at 55°C and then for at least 2 h at 65°C.
Library cleanup. The SpeedBead mastermix plate was prepared by equally distributing the total required amount of SpeedBead mastermix to each well in the first column and placed on Bravo deck 5. After incubation, the ChIP plate was placed back on Bravo deck 4, and Bravo protocol 7a_Adapter_Ligation_Cleanup was run. Ethanol reservoir was placed on deck 9, and TT buffer reservoir was placed on deck 3. Immediately after incubation with the SpeedBead mastermix, Bravo protocol 7b_Adapter_Ligation_Cleanup was run to clean up the input samples. At the end of the protocols, the ChIP plate should contain ChIP samples eluted in TT buffer.
PCR amplification and final cleanup of ChIP and input libraries
Manual workflow
PCR amplification. The PCR mastermix (Ultra II Q5 mastermix, and 1 µM sequencing platform-compatible forward and reverse primers [Solexa 1GA and Solexa 1 GB]) was added to each library sample. A PCR program (initial denaturation for 30 sec at 98°C; 12 cycles of denaturation for 10 sec at 98°C, annealing for 15 sec at 60°C, and extension for 30 sec at 72°C; and final extension for 2 min at 72°C) was run to amplify the libraries using a thermal cycler.
PCR cleanup. The PCR products were incubated with SpeedBead mastermix (2 µL SpeedBeads, 8.5% PEG8000 final, and 1.06 M NaCl final) for 10 min at room temperature. Then, the input sample was washed twice with 80% EtOH, and the SpeedBead pellet was air-dried. Lastly, the input sample was eluted with TT buffer.
Bravo workflow
PCR amplification. The PCR mastermix plate was prepared by equally distributing the total required amount of the mastermix to each well in the first column and placed on Bravo deck 6. The ChIP library plate was placed on deck 4. Bravo protocol 8_PCR_Enrichment_MM_Dispense was run. Then, a PCR program (initial denaturation for 30 sec at 98°C; 12 cycles of denaturation for 10 sec at 98°C, annealing for 15 sec at 60°C, and extension for 30 sec at 72°C; and final extension for 2 min at 72°C) was run to amplify the libraries using a thermal cycler.
Library cleanup. The SpeedBead mastermix plate was prepared by equally distributing the total required amount of SpeedBead mastermix to each well in the first column and placed on Bravo deck 5. After incubation, the ChIP library plate was placed back on Bravo deck 4, and Bravo protocol 9a_PCR_Enrichment_Cleanup was run. Ethanol reservoir was placed on deck 9, and TT buffer reservoir was placed on deck 3. Immediately after incubation with SpeedBead mastermix, Bravo protocol 9b_PCR_Enrichment_Cleanup was run to clean up the input samples. At the end of the protocols, the ChIP library plate should contain ChIP library samples eluted in TT buffer.
DNA quantification and sequencing
The size of the DNA libraries was estimated by running on a 2% agarose gel prestained with GelGreen. DNA libraries should have a smear with high intensity of ∼250–500 bp on the gel (Supplemental Fig. S7). The concentration of the library (ng/µL) was determined using a Qubit fluorometer with a Qubit HS DNA assay kit (Invitrogen). The libraries were pooled according to the concentration calculations. The pooled libraries were prepared and sequenced on Illumina NextSeq 500 or NextSeq 2000.
Sequencing data analysis
Raw sequencing data were demultiplexed using Illumina's bcl2fastq program. Adapter sequences were trimmed with Trimmomatic (Bolger et al. 2014), and sequencing quality was assessed using FastQC. Reads were aligned to the human reference genome (hg38) with Bowtie 2 (Langmead and Salzberg 2012) using the default parameters, and duplicated reads were removed with SAMtools markdup (Li et al. 2009). HOMER (Heinz et al. 2010) makeTagDirectory was used to generate tag directories containing filtered primary alignments (MAPQ > 10), and bigWig files were created with makeBigWig.pl for visualization in IGV (Robinson et al. 2011). Peaks were called using HOMER findPeaks with the parameters “-style histone” for histone mark peaks, “-style histone -size 1000 -minDist 2500” for broader histone mark peaks and using “-style factor” for TFs, using matched input controls as background. CTCF peaks used in Figure 3, D and E, were obtained from the ENCODE Project Consortium (file accession ENCFF502CZS). Peaks from all samples for each antibody target were merged using the HOMER mergePeaks program and read-depth-normalized read counts were quantified at merged peak regions using annotatePeaks.pl (hg38, -size 2000). Histograms centered on TSSs or peaks were generated with annotatePeaks.pl set in “TSS” mode or using the corresponding peak files (hg38, -size 4000, -hist 10). Heatmaps centered on TSSs and peaks were generated using deepTools (Ramírez et al. 2016) computeMatrix and plotHeatmap. All other plots (e.g., scatterplots and coverage histograms) were generated with custom Python scripts using matplotlib and seaborn (see Supplemental Code).
Data access
Data generated in this study have been submitted to the NCBI Gene Expression Omnibus (GEO; https://www.ncbi.nlm.nih.gov/geo/) under accession number GSE304259. To allow implementation of spa-ChIP-seq by other laboratories, we provide the complete automation setup and protocols, including the specific deck layouts, detailed parameters, and software files (Supplemental Files).
Competing interest statement
L.P., Y.C., C.B., S.H. and A.G. are inventors on related patent applications. L.A. is an employee of Agilent Technologies Inc.
Acknowledgments
Research reported in this publication was supported in part by National Institutes of Health/National Institute of Mental Health grants R01MH127077 (A.G. and C.B.), R35GM149520 (C.B.), R01GM129523 (S.H.), and National Science Foundation grant 2003358 (A.G.). We thank T. Xu and T. Dishon for their input, as well as R. Wachs for her help with the illustrations. We thank the Stem Cell Genomics Core at the Sanford Stem Cell Institute and the Epigenomics Core at UC San Diego for providing sequencing services. We also thank N. Gray and B. Nabet (Dana-Farber Cancer Institute) for the HEK293T-BRD4-FKBP12F36V-2xHA cell line and for the insightful input.
Author contributions: A.G. and Y.C. conceptualized and designed the study. Y.C. and L.P. performed the experiments and analyses. Y.C. programmed individual Bravo protocols, and L.A. organized them into a user-friendly interface on VWorks and a distributable package. E.M., C.B., and S.H. provided key input in designing, interpreting, and analyzing the results. A.G. supervised the study. All authors contributed to writing and reviewing the manuscript.
Notes
[1] Supplementary material [Supplemental material is available for this article.]
[2] Article published online before print. Article, supplemental material, and publication date are at https://www.genome.org/cgi/doi/10.1101/gr.281320.125.
References
- ↵Aldridge S, Watt S, Quail MA, Rayner T, Lukk M, Bimson MF, Gaffney D, Odom DT. 2013. AHT-ChIP-seq: a completely automated robotic protocol for high-throughput chromatin immunoprecipitation. Genome Biol 14: R124. 10.1186/gb-2013-14-11-r124
- ↵Barski A, Cuddapah S, Cui K, Roh T-Y, Schones DE, Wang Z, Wei G, Chepelev I, Zhao K. 2007. High-resolution profiling of histone methylations in the human genome. Cell 129: 823–837. 10.1016/j.cell.2007.05.009
- ↵Blecher-Gonen R, Barnett-Itzhaki Z, Jaitin D, Amann-Zalcenstein D, Lara-Astiaso D, Amit I. 2013. High-throughput chromatin immunoprecipitation for genome-wide mapping of in vivo protein-DNA interactions and epigenomic states. Nat Protoc 8: 539–554. 10.1038/nprot.2013.023
- ↵Bolger AM, Lohse M, Usadel B. 2014. Trimmomatic: a flexible trimmer for Illumina sequence data. Bioinformatics 30: 2114–2120. 10.1093/bioinformatics/btu170
- ↵Bomsztyk K, Mar D, Wang Y, Denisenko O, Ware C, Frazar CD, Blattler A, Maxwell AD, MacConaghy BE, Matula TJ. 2019. PIXUL-ChIP: integrated high-throughput sample preparation and analytical platform for epigenetic studies. Nucleic Acids Res 47: e69. 10.1093/nar/gkz222
- ↵Busby M, Xue C, Li C, Farjoun Y, Gienger E, Yofe I, Gladden A, Epstein CB, Cornett EM, Rothbart SB, 2016. Systematic comparison of monoclonal versus polyclonal antibodies for mapping histone modifications by ChIP-seq. Epigenetics Chromatin 9: 49. 10.1186/s13072-016-0100-6
- ↵Caride A, Jang JS, Shi G-X, Lenz S, Zhong J, Kim KH, Allen M, Robertson KD, Farrugia G, Ordog T, 2023. Titration-based normalization of antibody amount improves consistency of ChIP-seq experiments. BMC Genomics 24: 171. 10.1186/s12864-023-09253-0
- Dainese R, Gardeux V, Llimos G, Alpern D, Jiang JY, Meireles-Filho ACA, Deplancke B. 2020. A parallelized, automated platform enabling individual or sequential ChIP of histone marks and transcription factors. Proc Natl Acad Sci 117: 13828–13838. 10.1073/pnas.1913261117
- ↵Furey TS. 2012. ChIP–seq and beyond: new and improved methodologies to detect and characterize protein–DNA interactions. Nat Rev Genet 13: 840–852. 10.1038/nrg3306
- ↵Garber M, Yosef N, Goren A, Raychowdhury R, Thielke A, Guttman M, Robinson J, Minie B, Chevrier N, Itzhaki Z, 2012. A high-throughput chromatin immunoprecipitation approach reveals principles of dynamic gene regulation in mammals. Mol Cell 47: 810–822. 10.1016/j.molcel.2012.07.030
- ↵Gasper WC, Marinov GK, Pauli-Behn F, Scott MT, Newberry K, DeSalvo G, Ou S, Myers RM, Vielmetter J, Wold BJ. 2014. Fully automated high-throughput chromatin immunoprecipitation for ChIP-seq: identifying ChIP-quality p300 monoclonal antibodies. Sci Rep 4: 5152. 10.1038/srep05152
- ↵Heintzman ND, Stuart RK, Hon G, Fu Y, Ching CW, Hawkins RD, Barrera LO, Van Calcar S, Qu C, Ching KA, 2007. Distinct and predictive chromatin signatures of transcriptional promoters and enhancers in the human genome. Nat Genet 39: 311–318. 10.1038/ng1966
- ↵Heinz S, Benner C, Spann N, Bertolino E, Lin YC, Laslo P, Cheng JX, Murre C, Singh H, Glass CK. 2010. Simple combinations of lineage-determining transcription factors prime cis-regulatory elements required for macrophage and B cell identities. Mol Cell 38: 576–589. 10.1016/j.molcel.2010.05.004
- ↵Johnson DS, Mortazavi A, Myers RM, Wold B. 2007. Genome-wide mapping of in vivo protein-DNA interactions. Science 316: 1497–1502. 10.1126/science.1141319
- ↵Landt SG, Marinov GK, Kundaje A, Kheradpour P, Pauli F, Batzoglou S, Bernstein BE, Bickel P, Brown JB, Cayting P, 2012. ChIP-seq guidelines and practices of the ENCODE and modENCODE consortia. Genome Res 22: 1813–1831. 10.1101/gr.136184.111
- ↵Langmead B, Salzberg SL. 2012. Fast gapped-read alignment with Bowtie 2. Nat Methods 9: 357–359. 10.1038/nmeth.1923
- ↵Li H, Handsaker B, Wysoker A, Fennell T, Ruan J, Homer N, Marth G, Abecasis G, Durbin R, 1000 Genome Project Data Processing Subgroup. 2009. The Sequence Alignment/Map format and SAMtools. Bioinformatics 25: 2078–2079. 10.1093/bioinformatics/btp352
- ↵Marx V. 2019. What to do about those immunoprecipitation blues. Nat Methods 16: 289–292. 10.1038/s41592-019-0365-3
- ↵Mendenhall EM, Bernstein BE. 2008. Chromatin state maps: new technologies, new insights. Curr Opin Genet Dev 18: 109–115. 10.1016/j.gde.2008.01.010
- ↵Mendoza-Parra M-A, Saravaki V, Cholley P-E, Blum M, Billoré B, Gronemeyer H. 2016. Antibody performance in ChIP-sequencing assays: from quality scores of public data sets to quantitative certification. F1000Res 5: 54. 10.12688/f1000research.7637.1
- ↵Métivier R, Penot G, Hübner MR, Reid G, Brand H, Koš M, Gannon F. 2003. Estrogen receptor-α directs ordered, cyclical, and combinatorial recruitment of cofactors on a natural target promoter. Cell 115: 751–763. 10.1016/S0092-8674(03)00934-6
- ↵Mikkelsen TS, Ku M, Jaffe DB, Issac B, Lieberman E, Giannoukos G, Alvarez P, Brockman W, Kim T-K, Koche RP, 2007. Genome-wide maps of chromatin state in pluripotent and lineage-committed cells. Nature 448: 553–560. 10.1038/nature06008
- ↵Mundade R, Ozer HG, Wei H, Prabhu L, Lu T. 2014. Role of ChIP-seq in the discovery of transcription factor binding sites, differential gene regulation mechanism, epigenetic marks and beyond. Cell Cycle 13: 2847–2852. 10.4161/15384101.2014.949201
- ↵Nabet B, Roberts JM, Buckley DL, Paulk J, Dastjerdi S, Yang A, Leggett AL, Erb MA, Lawlor MA, Souza A, 2018. The dTAG system for immediate and target-specific protein degradation. Nat Chem Biol 14: 431–441. 10.1038/s41589-018-0021-8
- ↵Nowak DE, Tian B, Brasier AR. 2005. Two-step cross-linking method for identification of NF-κB gene network by chromatin immunoprecipitation. BioTechniques 39: 715–725. 10.2144/000112014
- ↵Park PJ. 2009. ChIP–seq: advantages and challenges of a maturing technology. Nat Rev Genet 10: 669–680. 10.1038/nrg2641
- ↵Patel LA, Cao Y, Mendenhall EM, Benner C, Goren A. 2024. The wild west of spike-in normalization. Nat Biotechnol 42: 1343–1349. 10.1038/s41587-024-02377-y
- ↵Patel L, Cao Y, Xu T, Modolo E, Dishon T, Zhang L, Mendenhall E, Heinz S, Simon I, Benner C, 2025. Improved spike-in normalization clarifies the relationship between active histone modifications and transcription. bioRxiv 10.1101/2025.11.25.690627v2
- ↵Ramírez F, Ryan DP, Grüning B, Bhardwaj V, Kilpert F, Richter AS, Heyne S, Dündar F, Manke T. 2016. deepTools2: a next generation web server for deep-sequencing data analysis. Nucleic Acids Res 44: W160–W165. 10.1093/nar/gkw257
- ↵Robinson JT, Thorvaldsdóttir H, Winckler W, Guttman M, Lander ES, Getz G, Mesirov JP. 2011. Integrative genomics viewer. Nat Biotechnol 29: 24–26. 10.1038/nbt.1754
- ↵Sutherland BW, Toews J, Kast J. 2008. Utility of formaldehyde cross-linking and mass spectrometry in the study of protein–protein interactions. J Mass Spectrom 43: 699–715. 10.1002/jms.1415
- ↵Texari L, Spann NJ, Troutman TD, Sakai M, Seidman JS, Heinz S. 2021. An optimized protocol for rapid, sensitive and robust on-bead ChIP-seq from primary cells. STAR Protoc 2: 100358. 10.1016/j.xpro.2021.100358
- ↵Tian B, Yang J, Brasier AR. 2012. Two-step cross-linking for analysis of protein–chromatin interactions. In Transcriptional regulation: methods and protocols: methods in molecular biology (ed. Vancura A), pp. 105–120. Springer, New York.
- ↵Wardle FC, Tan H. 2015. A ChIP on the shoulder? Chromatin immunoprecipitation and validation strategies for ChIP antibodies. F1000Res 4: 235. 10.12688/f1000research.6719.1
- ↵Waszak SM, Delaneau O, Gschwind AR, Kilpinen H, Raghav SK, Witwicki RM, Orioli A, Wiederkehr M, Panousis NI, Yurovsky A, 2015. Population variation and genetic control of modular chromatin architecture in humans. Cell 162: 1039–1050. 10.1016/j.cell.2015.08.001
- ↵Yan H, Tian S, Slager SL, Sun Z. 2016. ChIP-seq in studying epigenetic mechanisms of disease and promoting precision medicine: progresses and future directions. Epigenomics 8: 1239–1258. 10.2217/epi-2016-0053
- ↵Zou Z, Iwata M, Yamanishi Y, Oki S. 2022. Epigenetic landscape of drug responses revealed through large-scale ChIP-seq data analyses. BMC Bioinformatics 23: 51. 10.1186/s12859-022-04571-8