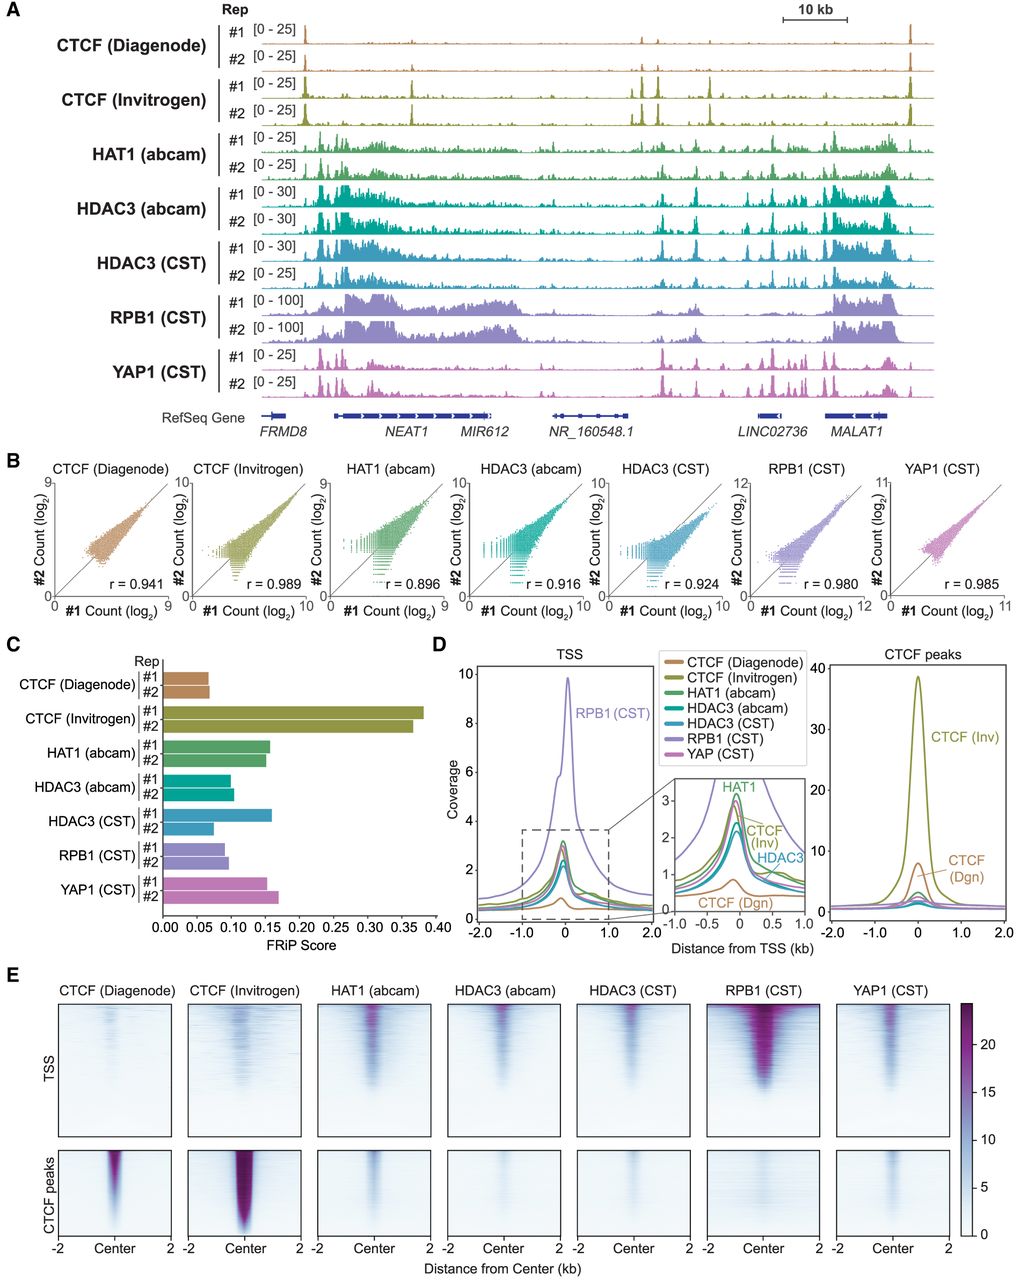
Mapping of DNA-associated proteins using spa-ChIP-seq. (A) IGV tracks showing the ChIP-seq of DNA-associated proteins: CTCF, HAT1, HDAC3, RPB1, and YAP1. The ChIP-seq experiments for CTCF and HDAC3 were performed with two antibodies from two different vendors. Each antibody condition has two technical replicates (labeled as #1 and #2), with a total of 14 ChIP-seq samples. (B) Scatterplots showing the comparison of the two technical replicates at shared peaks for each antibody condition. (C) Bar plot showing fraction of reads in peaks (FRiP) for the ChIP-seq of DNA-associated proteins. For each antibody, both technical replicates (labeled as #1 and #2) are plotted. (D) Histograms showing the average normalized read coverage of the replicates at ±2 kb from the center of TSSs and CTCF peaks. (E) Heatmaps showing the average normalized read density of the replicates at ±2 kb from the center of TSSs (top) and CTCF peaks (bottom). CTCF peaks were obtained from ENCODE (file accession ENCFF502CZS).