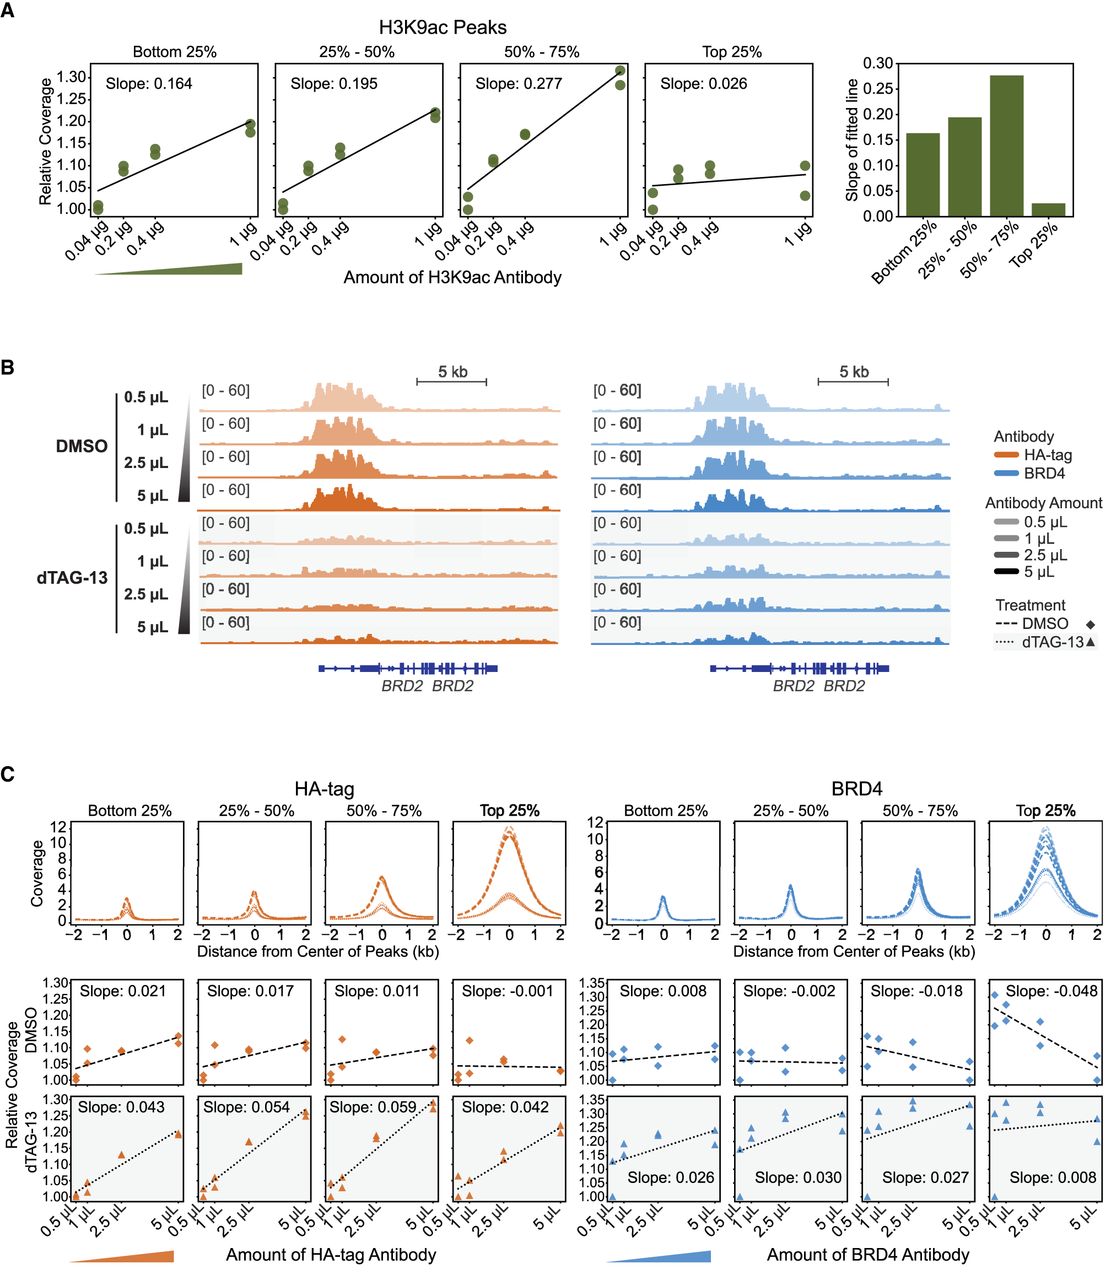
Antibody titration with spa-ChIP-seq reveals that weaker signals are more sensitive to the amount of antibody. (A) Relative total coverage of H3K9ac signal with 0.04 µg, 0.2 µg, 0.4 µg, and 1 µg of antibody for H3K9ac peaks separated into quartiles based on normalized read counts at the peaks (the values are relative to the minimum, which is set to one). Each condition has two technical replicates, with a total of eight ChIP-seq samples. Each plot is fitted with a linear regression line, and the corresponding slope of fitted line is shown in the bar plot on the left. (B) IGV tracks for HA-tag and BRD4 ChIP-seq in dTAG-13- and DMSO-treated HEK293T-BRD4-FKBP12F36V-2xHA cells with 0.5 µL, 1 µL, 2.5 µL, and 5 µL of the HA-tag and BRD4 antibodies, with each amount of antibody performed in replicates for a total of 32 ChIP-seq samples. The tracks of two replicates for each condition are overlaid on one another. (C) Histograms of normalized read coverage for HA-tag and BRD4 antibody titration ChIP-seq signals centered on peaks obtained by using the DMSO samples. The peaks are separated into quartiles according to normalized read counts at the peaks. Relative total coverage of HA-tag and BRD4 signals with 0.5 µL, 1 µL, 2.5 µL, and 5 µL of antibody for each quartile of DMSO peaks shown in the histogram above. The orange and blue triangles represent the increase in the ratio of antibody to cell number in HA-tag and BRD4, respectively. Each condition has two technical replicates.