
Abstract
Genome-wide association studies (GWASs) and expression analyses implicate noncoding regulatory regions as harboring risk factors for psychiatric disease, but functional characterization of these regions remains limited. Here, we perform capture STARR-sequencing of over 70,000 candidate regions to identify active enhancers in primary human neural progenitor cells (phNPCs). We select candidate regions by integrating data from NPCs, prefrontal cortex, developmental timepoints, and GWASs. Over 8000 regions demonstrate enhancer activity in the phNPCs, and we link these regions to over 2200 predicted target genes. These genes are involved in neuronal and psychiatric disease-associated pathways, including neuronal system, nervous system development, and developmental delay. We functionally validate a subset of these enhancers using mutation STARR-sequencing and CRISPR deletions, demonstrating the effects of genetic variation on enhancer activity and enhancer deletion on gene expression. Overall, we identify thousands of highly active enhancers and functionally validated a subset of these enhancers, improving our understanding of regulatory networks underlying brain function and disease.
Neuropsychiatric disorders (NPDs) are among the most common illnesses in the United States, with over 20% of adults and a similar proportion of children being afflicted over their lifetime (Merikangas et al. 2010; Substance Abuse and Mental Health Services Administration 2021). Hundreds of genome-wide association studies (GWASs) have been conducted (Horwitz et al. 2019) to uncover genetic contributors to NPDs, and >1000 associated variants have been identified. The majority of these variants reside in noncoding regions of the genome (Horwitz et al. 2019; Barešić et al. 2020), often enhancers (Davidson et al. 2011; Edwards et al. 2012; Corradin and Scacheri 2014). Initial studies portioning the heritability of both childhood and adult onset disorders into regions of open chromatin and their associated cell types implicate the period of neurogenesis during human fetal brain development as a period of substantial vulnerability (de la Torre-Ubieta et al. 2018; Walker et al. 2019). However, the activity of most of these regions is not well characterized in relevant cell types, limiting these analyses.
To address this gap, we leveraged primary human neural progenitor cells (phNPCs) obtained from human brain in our lab, which have been shown to closely recapitulate early stages of in vivo human fetal brain development (Konopka et al. 2012; Stein et al. 2014). We performed capture self-transcribing active regulatory region sequencing (CapSTARR-seq) (Vanhille et al. 2015) to identify enhancers active during early brain development. The CapSTARR-seq method is a plasmid-based, in vitro approach for large-scale validation of enhancer regions (Vanhille et al. 2015). We leveraged several PsychENCODE data sets, including data from the prefrontal cortex (PFC), NPC lines, and developmental timepoints, to generate a list of putative enhancer regions to investigate using the phNPC model. Whereas other enhancer mapping tools such as massively parallel reporter assays (MPRAs) have been used to identify putative enhancer regions in primary human cortical cells (Deng et al. 2024), human induced pluripotent stem cell (hiPSC)-derived organoids (Capauto et al. 2024; Deng et al. 2024), and human embryonic stem cell (hESC)-derived NPCs (Inoue et al. 2019; Weiss et al. 2021), technical constraints limit the size of candidate enhancer regions to often <200 base pairs (bp) (Klein et al. 2020) despite human enhancers averaging around 800 bp in length (Mulero Hernández and Fernández-Breis 2022). In contrast with MPRA, STARR-seq utilizes a cloning-based approach (Muerdter et al. 2015), allowing for the investigation of longer fragments that have been shown to be essential for enhancer function (Klein et al. 2020). The STARR-seq approach has been used on a genome-wide scale in human cell lines (https://doi.org/doi:10.17989%2FENCSR983SZZ; Liu et al. 2017) but has not yet been used in primary human neuronal cells.
In this study, we interrogated over 70,000 candidate regions for enhancer activity in phNPCs using CapSTARR-seq. We then took a subset of the regions that demonstrated enhancer activity and used CRISPR-based and mutation STARR-seq (MutSTARR-seq) approaches to determine the effects of genetic variation on enhancer activity and gene expression. The overall aim of this work was to characterize the noncoding landscape of the phNPCs in an effort to better understand the regulatory networks involved in neuronal function and disease in a primary human neural cell type.
Results
Selection of candidate regions and panel design for CapSTARR-seq
Panel 1
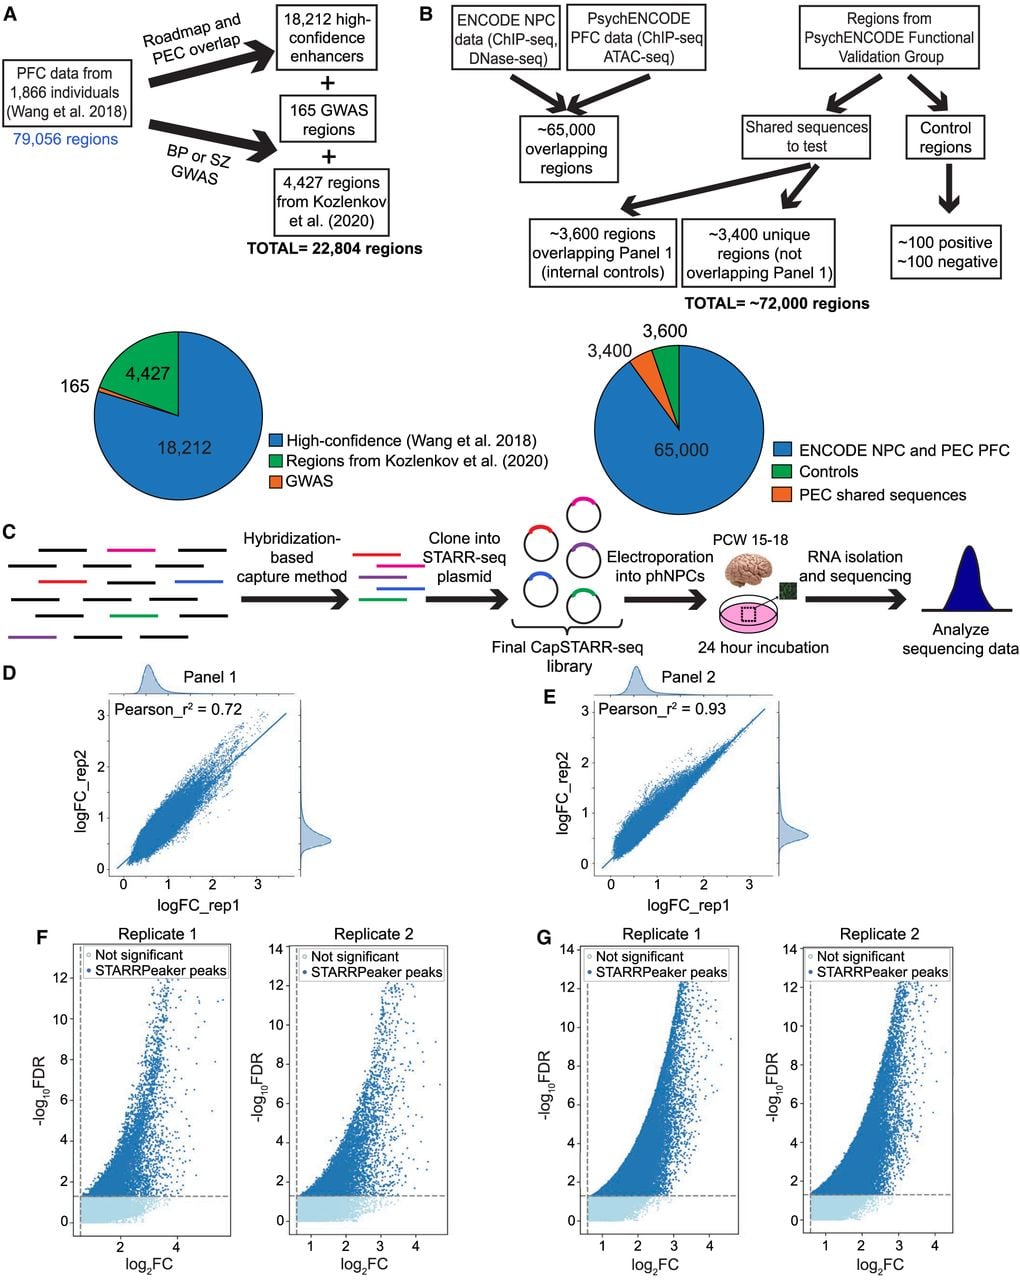
Due to growth constraints of primary cells (Deng et al. 2024), we ran our CapSTARR-seq experiment as two separate panels (Fig. 1). The first panel for CapSTARR-seq was created from a subset of enhancers identified in the first phase of the PsychENCODE program (Wang et al. 2018). Candidate enhancer regions were chosen using a matched filter process as outlined in Sethi et al. (2020). Briefly, PFC samples from the ENCODE (The ENCODE Project Consortium 2012), Roadmap Epigenomics (Roadmap Epigenomics Consortium et al. 2015), and PsychENCODE projects (de la Torre-Ubieta et al. 2018) were analyzed in order to annotate a set of active enhancers in the brain, which identified ∼79,000 brain-specific enhancers (Wang et al. 2018). We identified a high-confidence set of PFC enhancers (18,212 regions) based on strong ATAC-seq and DNase signals, as well as strong H3K27ac signals from both the Roadmap PFC and PsychENCODE PFC ChIP-seq experiments. This set of high-confidence enhancers was included as targets in the first capture panel. We added 165 bipolar or schizophrenia regions from the GWAS catalog overlapping the initial set of 79,000 brain-specific enhancers (Buniello et al. 2019) and a set of 4427 predicted enhancers from Kozlenkov et al. (2020) for a final panel size of 22,804 regions spanning ∼14 Mbp (Fig. 1A).
Panel design and quality control results. (A,B) The process for candidate enhancer selection for Panel 1 (A) and Panel 2 (B). See “Results” for a complete description of candidate selection. (C) The experimental workflow. Sheared genomic DNA was hybridized to probes specific for the candidate enhancer regions. These regions were then cloned into the STARR-seq plasmid and transfected into phNPCs. (D,E) The fold change correlation between the two technical replicates for Panel 1 (D) and Panel 2 (E). Pearson's r2 values are included on the graphs. (F,G) Volcano plots representing the tested enhancer regions. Regions that had significant peaks as determined by STARRPeaker are in dark blue and nonsignificant regions are in light blue. (PFC) prefrontal cortex, (PEC) PsychENCODE Consortium, (BP) bipolar disorder, (SZ) schizophrenia, (GWAS) genome-wide association study, (phNPC) primary human neural progenitor cell, (PCW) postconception week, (FDR) false discovery rate, (FC) fold change.
Panel 2
For the second CapSTARR-seq panel, we combined data from other resources as well as leveraged the deep learning model DECODE (Chen et al. 2021) to identify targets with a high likelihood of being an active enhancer in the brain (Fig. 1B). We made use of existing bulk PFC ATAC-seq data from the HumanFC and BrainGVEX cohorts of PsychENCODE (Bryois et al. 2018; Fullard et al. 2018), which resulted in a total of ∼350,000 candidate enhancers derived from PFC. Next, we used DECODE (Chen et al. 2021) to analyze data from the ENCODE NPC cell line and intersected putative enhancers with results from the ENCODE DECODE analysis and ATAC-seq in PFC (Bryois et al. 2018; Fullard et al. 2018), resulting in ∼72,000 candidate enhancers shared by both data sets. We validated activity of these regions in three independent data sources, including in vivo developing brain (de la Torre-Ubieta et al. 2018; Trevino et al. 2020), which confirmed ∼90% overlap with the designated panel (Supplemental Fig. S1). GWAS and single nucleotide polymorphisms (SNPs) in linkage disequilibrium (LD; r2 > 0.4) (Pers et al. 2015; Ghasemi et al. 2021) were also intersected against the panel design, showing a total of 460 unique GWAS and ∼30,000 total linked SNPs intersecting. The functionality of these putative enhancers was further confirmed by their significant overlap (∼48%) with expression quantitative trait loci (eQTL) (Wang et al. 2018; Walker et al. 2019) and transcriptome-wide association study findings from fetal human brain (Gandal et al. 2018; Walker et al. 2019). Of the resulting panel of ∼72,000 targets, 65,000 were new as compared to Panel 1 and 7000 regions overlapped between the panels. We retained 3600 of the overlapping regions in Panel 2 as internal controls. We also included 3400 targets derived as top scoring candidate cis-regulatory elements (cCREs) from the Weng Lab at the University of Massachusetts Medical School (Fig. 1B).
Quality assessment of CapSTARR-seq data set
Panel 1 targeted a total of 22,314 regions, and Panel 2 targeted a total of 48,507 regions (Table 1) following concatenation of adjacent or overlapping candidate regions (Supplemental Tables S1, S2). The mean region size was 638.92 bp (Panel 1) and 735.36 bp (Panel 2), and the median region size was 448 bp (Panel 1) and 500 bp (Panel 2) (Table 1). These assembled libraries were transfected into a phNPC line derived from a female fetus of Mexican descent (Methods). The same line was used for both technical replicates for both panels. Initial quality control revealed that our sequencing data (Fig. 1C) were of high quality, with over 94% of reads from each panel (both input and output) and replicate aligning with the genome (Table 1). For the input libraries, we successfully captured over 99% of our targeted regions for each panel (Table 1), and over 93% of those regions were sequenced at 10× depth (Supplemental Table S3). For the output libraries, over 92% of regions were sequenced at 10× depth (Supplemental Table S3). The rates of polymerase chain reaction (PCR) duplication ranged from 11.83% to 49.30% across all sequencing data, with the highest levels of duplication coming from the Panel 2 output data (Supplemental Table S3). The higher level of duplicates in Panel 2, particularly of barcoded duplicates, represents high levels of enhancer activity and indicates that our panel was well-designed. We also calculated “on-target” and “off-target” read percentages based on whether the reads fell within our initial target regions. Over 89% of our sequencing reads qualified as “on-target” (Supplemental Table S3).
Quality assessment of CapSTARR-seq data set
| Panel 1 | Panel 2 | |||||
|---|---|---|---|---|---|---|
| Input | Output - replicate 1 | Output - replicate 2 | Input | Output - replicate 1 | Output - replicate 2 | |
| # Targeted regions | 22,314 | – | – | 48,507 | – | – |
| # Tested regions (%) | 22,176 (99.38%) | – | – | 48,488 (99.96%) | – | – |
| Mean region size (bp) | 638.92 | – | – | 735.36 | – | – |
| Median region size (bp) | 448 | – | – | 500 | – | – |
| Primary alignment | 18,218,282 | 38,617,348 | 44,520,086 | 45,352,130 | 48,320,288 | 54,647,238 |
| Properly paired (%) | 18,000,464 (98.8%) | 36,958,904 (95.71%) | 42,253,962 (94.91%) | 45,078,556 (99.40%) | 47,427,054 (98.15%) | 53,626,310 (98.13%) |
| Active enhancers | – | 1137 | 1142 | – | 6202 | 6484 |
| Overlapping enhancers | – | 914 | – | 5698 | ||
| Pearson's r2 value | – | 0.72 | – | 0.93 | ||
[i] The targeted regions represent the number of regions in the capture panel design, whereas the tested elements represent the regions actually captured by the input library. This count is following concatenation of adjacent or overlapping candidate regions. Primary alignment values represent sequencing read counts, with the properly paired value representing the number of reads properly aligning with the genome. Active enhancer regions are designated as regions with a STARRPeaker Q-value ≤ 0.05. The overlap value indicates how many regions were designated active enhancers across both technical replicates of the panel. The Pearson's r2 value (also depicted in Fig. 1D,E) demonstrates the correlation between replicates.
Identification of CapSTARR-seq active enhancer regions
We called peaks from our data set as regions with a STARRPeaker Q-value ≤ 0.05 (Table 1; Supplemental Table S4; Lee et al. 2020), observing a high overlap (914 regions; r2 = 0.72) between replicates in Panel 1 (Fig. 1D–G; Table 1). For Panel 2, 5698 regions overlapped between replicates 1 and 2, producing an r2 value of 0.93 between replicates (Fig. 1D–G; Table 1). Across both panels, we identified 8148 regions with evidence of enhancer activity in at least one replicate. A total of 6612 regions (∼9%) demonstrated strong evidence of enhancer activity in the phNPCs based on their replication in two separate experiments, similar to previous observations in nonneuronal cell lines (∼6%) (Vanhille et al. 2015). Regions that were tested across both panels had a Pearson correlation coefficient of 0.737, representing a strong correlation (Supplemental Fig. S2; Papageorgiou 2022). We compared our STARR-seq active regions with newly generated ATAC-seq data from iPSC-derived NPCs (Wells et al. 2023). Active STARR-seq regions showed higher ATAC-seq signals than either randomly selected regions or low-scoring STARR-seq regions (Supplemental Fig. S3; Supplemental Table S5; Supplemental Methods), providing additional support for these regions being putative enhancers.
Enrichment of transcription factor binding site motifs
We next tested for enrichment of transcription factor binding sites (TFBSs) by using HOMER (Heinz et al. 2010) and MEME-Suite (Bailey et al. 2015) to perform transcription factor (TF) motif enrichment analysis in the putative enhancers for each panel (Table 2). We focused on the high-confidence enhancers that overlapped between the panel replicates and compared enrichment in our active enhancer regions with inactive control regions (see Methods). In Panel 1, the top enriched motifs were JUNB/bZip (P = 1 × 10−61), TP53 (P = 1 × 10⁻²⁹), MITF (P = 1 × 10⁻²¹), and SOX10 (P = 1 × 10⁻¹⁷). In Panel 2, the top enriched motifs were YY1 (P = 1 × 10−609), ELK1/ETS (P = 1 × 10−490), THAP11 (P = 1 × 10−232), SREBF2 (P = 1 × 10−200), and ZNF143 (P = 1 × 10−139). Reported P-values are from HOMER and determined using a hypergeometric distribution P-value test. Several of these TFs have been implicated in NPDs, including drug addiction (JUNB) (Huggett and Stallings 2020) and schizophrenia (SOX10, SREBF2) (Schizophrenia Working Group of the Psychiatric Genomics Consortium 2014; Wockner et al. 2014).
Transcription factor binding site motifs enriched in active enhancers
| Motif consensus sequence | P-value | % of targets | % of background | Known motif | |
|---|---|---|---|---|---|
| Panel 1 |  | 10−61 | 29.98% | 9.36% | JUNB(bZip) |
 | 10−29 | 5.22% | 0.48% | TP53 | |
 | 10−21 | 17.72% | 7.53% | MITF | |
 | 10−17 | 33.01% | 20.21% | SOX10 | |
| Panel 2 |  | <10−100 | 13.05% | 0.75% | YY1 |
 | <10−100 | 23.93% | 4.96% | ELK1(ETS) | |
 | <10−100 | 7.03% | 0.73% | THAP11 | |
 | <10−100 | 14.56% | 4.16% | SREBF2 | |
 | <10−100 | 7.73% | 1.70% | ZNF143 | |
 | 10−95 | 9.46% | 3.32% | NRF1 | |
 | 10−90 | 10.2% | 3.87% | JUNB(bZip) | |
 | 10−74 | 1.97% | 0.16% | ZBTB33 | |
 | 10−58 | 2.23% | 0.32% | TP53 |
[i] The “% of targets” column indicates the percentage of active enhancers from our CapSTARR-seq assay that contain each motif. The “% of background” column indicates the percentage of regions from our CapSTARR-seq assay that did not show enhancer activity and contain each motif (see Methods). The “known motif” column indicates the transcription factors known to bind to the given motif sequence. Reported P-values are from HOMER (Heinz et al. 2010) and calculated using a hypergeometric distribution P-value test.
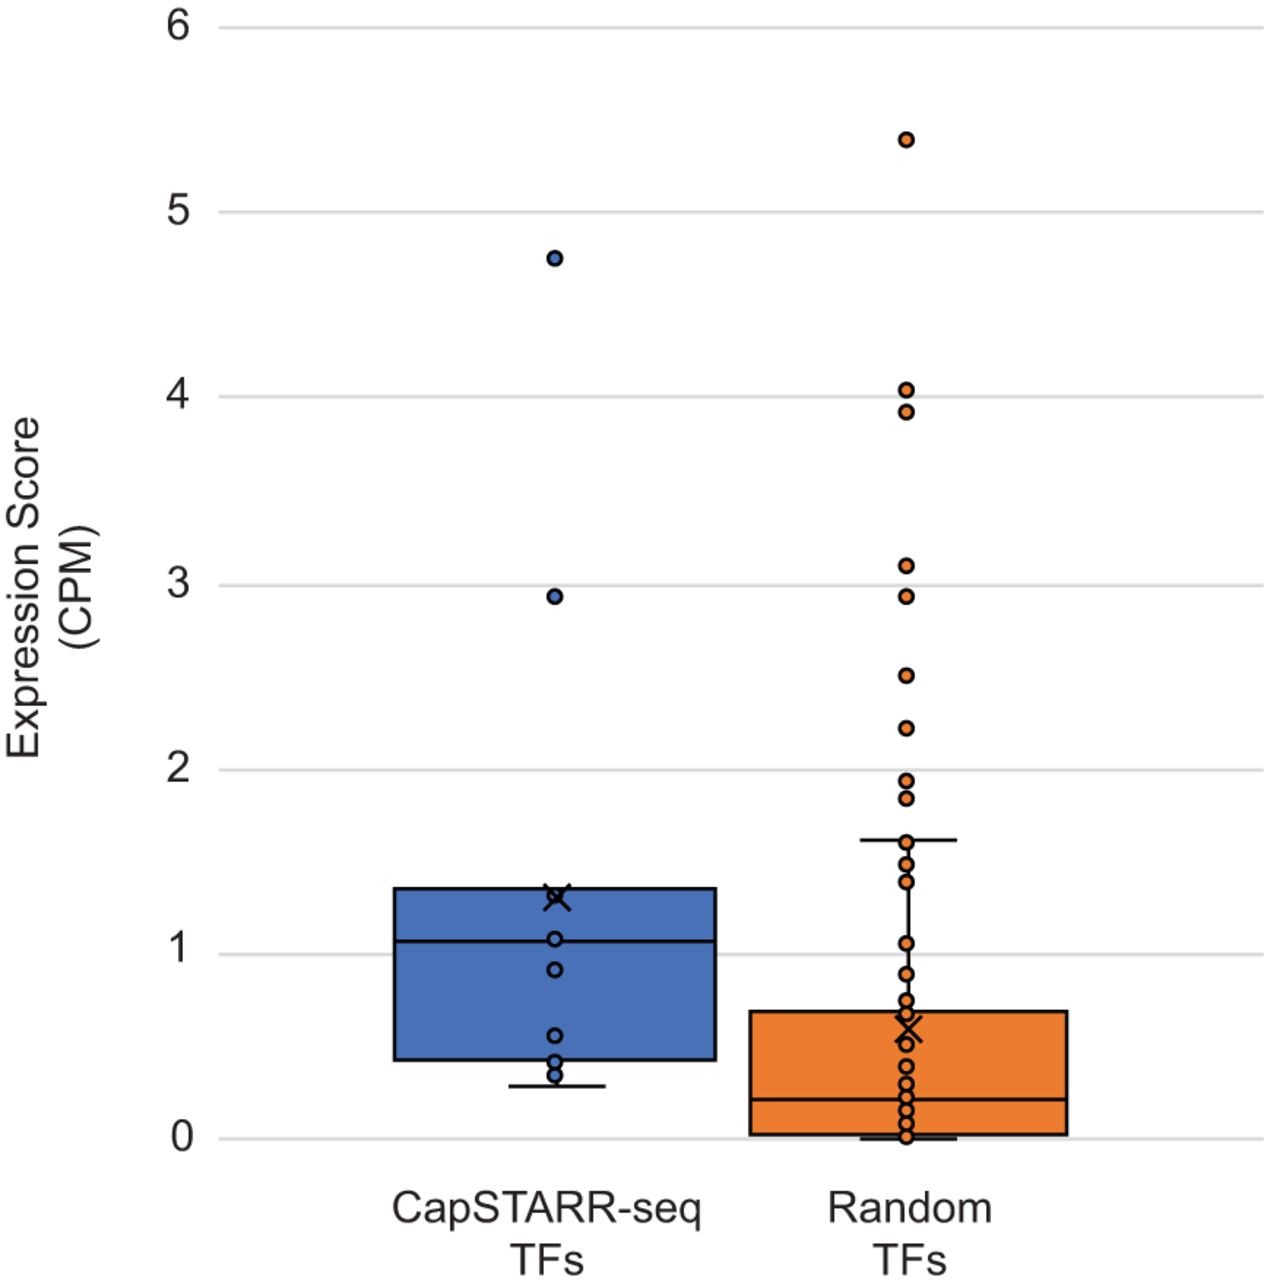
To further validate that the enriched TFBS motifs correlate with TFs that are highly expressed in phNPCs, we analyzed their expression using single-cell RNA-seq (scRNA-seq) data generated in the phNPCs (Supplemental Table S6). We compared expression levels of the TFs from the four high-confidence motif families in Panel 1 and the nine in Panel 2 (Table 2) with 100 randomly selected TFs from Lambert et al. (2018) (see Methods). The enriched TFs from our CapSTARR-seq experiments had significantly higher expression than the randomly selected TFs (two-sample two-tailed P-value = 0.022) (Fig. 2; Supplemental Tables S7, S8). These results demonstrate that the TFs associated with enriched binding site motifs from our active enhancer regions have higher expression in phNPCs than randomly selected TFs. This suggests that these specific TFs may play an important role in gene regulation within the phNPCs, specifically at the active enhancer regions identified through CapSTARR-seq.
Expression of transcription factors (TFs) with enriched binding site motifs. Single-cell RNA sequencing expression score is displayed on the y-axis and measured in counts per million (CPM). A higher expression score indicates a more highly expressed gene. For each plot, the solid line represents the median expression score whereas the “X” represents the mean expression score. Individual TF expression scores are shown as data points on the box plots. Expression scores were compared using a two-sample, two-tailed t-test.
Identification of enhancer target genes and pathway enrichment analysis
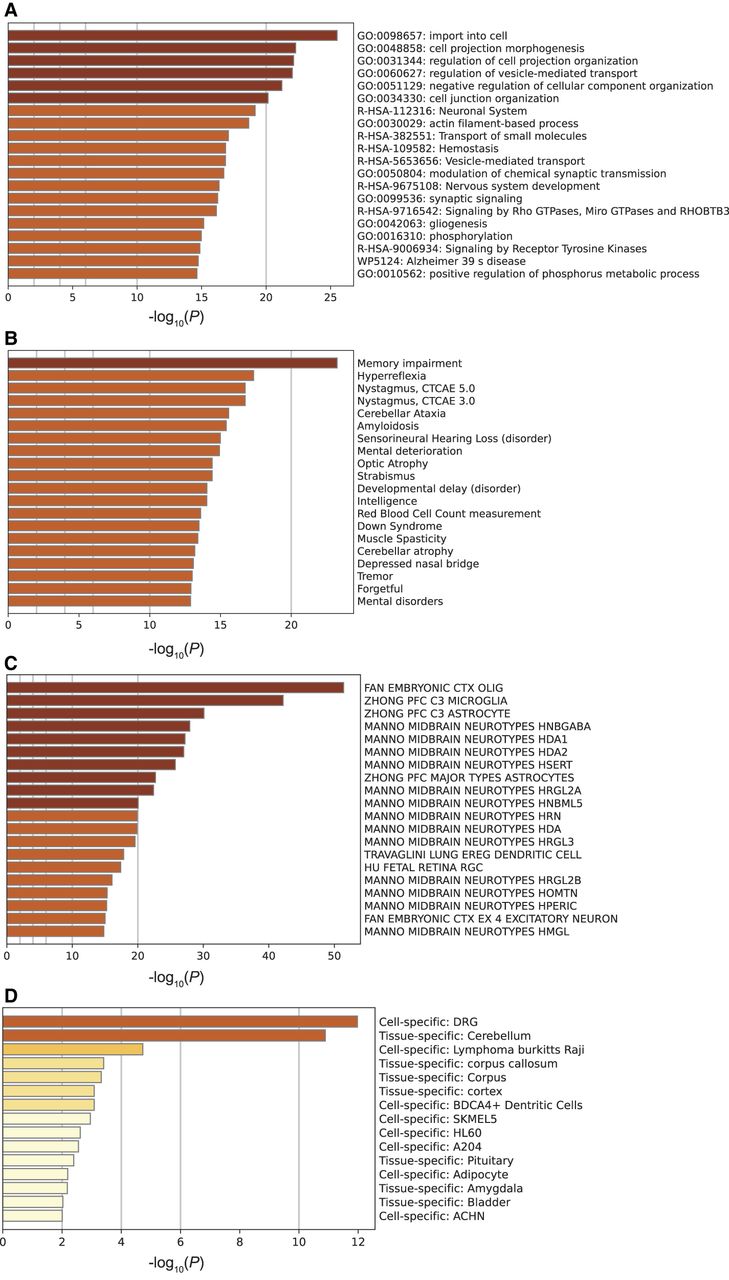
We used gene regulatory networks from adult brain data (Emani et al. 2024) to identify 2288 unique predicted target genes regulated by 427 TFs (Supplemental Figs. S4, S5; Supplemental Table S9; Methods). These genes were associated with 3693 distinct enhancers, with an average of 1.6 enhancers per target gene (Supplemental Table S10). On average, there were 8.5 different cell types associated with these gene linkages, a number significantly higher than that seen for randomly selected control regions (Supplemental Table S10; see Methods). We used Metascape (Zhou et al. 2019) to identify biological pathways, diseases, cell types, and tissue types enriched within our gene set (Fig. 3; Supplemental Table S11). Metascape is an online portal (https://metascape.org/gp/index.html#/main/step1) integrating over 40 different knowledge bases for streamlined analysis of gene set enrichment. Many of the most highly enriched pathways were related to neuronal processes, including neuronal system, modulation of chemical synaptic transmission, nervous system development, and gliogenesis (Fig. 3A). The Metascape analysis also indicated that our gene set was enriched for several brain-related diseases, including memory impairment, mental deterioration, developmental delay, and mental disorders (Fig. 3B). Finally, our gene set was enriched for neuronal and glial cell types and brain-specific tissues (Fig. 3C,D). To ensure that these pathways were not enriched as an artifact of our candidate enhancer selection method, we ran the same set of pathway analyses on randomly selected subsets of genes from our entire candidate list (see Methods). We focused specifically on the brain-related pathways and diseases and found that many of the identified pathways and diseases were significantly more enriched for our CapSTARR-seq gene set than for randomly selected gene subsets (Supplemental Table S12). The enrichment of these target genes for neuronal pathways further supports the functionality of our putative enhancer regions in regulation of human brain development.
Metascape pathway analysis of the 2288 predicted target genes. (A) Pathway and process enrichment results fielded from KEGG Pathway, GO Biological Processes, Reactome Gene Sets, Canonical Pathways, CORUM, WikiPathways, and PANTHER Pathway. P-values were calculated using the cumulative hypergeometric distribution (Zar 1999). (B) Associated diseases as identified through DisGeNET (Piñero et al. 2017). Enriched cell and tissue types are depicted in C (Subramanian et al. 2005) and D (Pan et al. 2013).
Because these predicted genes were based on data from the adult brain, we also explored how our putative enhancers intersected with data from the fetal brain, which might be more relevant to regulatory relationships in phNPCs. We examined the overlap between our enhancer regions and fetal eQTLs from Wen et al. (2024). Of our 8148 putative enhancers, 2284 (28%) overlapped a fetal eQTL corresponding to 3227 predicted target genes (Supplemental Table S13). These genes were enriched for immune-related and metabolic pathways (Supplemental Table S14), both of which have been previously implicated in psychiatric disease (Vancampfort et al. 2015; Werner et al. 2022; Chourpiliadis et al. 2024; Gong et al. 2025). The immune-related pathways include a combination of genes with more general immune functions, such as HLA-A (Anaya et al. 2013), and genes with more direct roles in neuronal development, such as MCM3AP (Ylikallio et al. 2017) and LNPEP (Yeatman et al. 2016; Bernstein et al. 2017). As a comparison, only 404 (5%) enhancer regions overlapped an adult eQTL (Supplemental Table S13; Emani et al. 2024). Of the 404 that overlapped an adult eQTL, 300 also overlapped a fetal eQTL (Supplemental Table S13). Of these 300 enhancers, 135 had the same predicted target gene and the same direction of effect on that target gene (Supplemental Table S15), potentially representing a high-confidence set of brain-specific enhancers across different developmental stages. Pathway analyses of this set of overlapping genes identified immune-related pathways and brain-related diseases, including child developmental disorders, enriched within this gene set (Supplemental Table S16). The implication of these target genes in brain-related diseases provides evidence that these putative enhancers may be involved in disease pathogenesis in both the fetal brain and the adult brain.
Allelic effects on enhancer activity
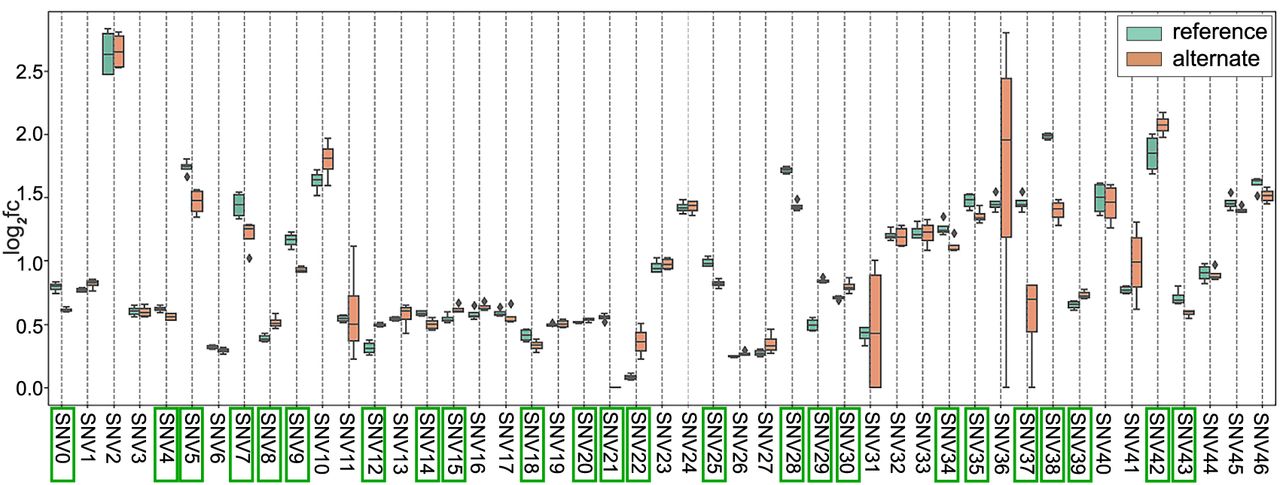
To investigate the allelic effect of eQTLs on enhancer activity, we overlaid our enhancer predictions with single cell eQTL data (Emani et al. 2024). We selected 47 eQTLs to interrogate through MutSTARR-seq in the phNPCs (Supplemental Table S17; see Methods). MutSTARR-seq employs the same techniques as STARR-seq but utilizes synthetic gene fragments that are generated with and without the eQTL variant to observe the allelic effect of the eQTL variant on predicted enhancer activity. We identified 24 variants (51%) that altered enhancer activity across four technical replicates (Fig. 4; Supplemental Table S18). Of these variants, 15 had decreased enhancer activity with the alternate allele, and nine had increased enhancer activity.
MutSTARR-seq results comparing enhancer activity (log2fc) between the reference and alternate alleles. Box plots represent the distribution of activity across four technical replicates. Enhancer activity is defined by log2 fold change, which represents the normalized output/input ratio in log2 space. Variants that had a significant effect on enhancer activity (P < 0.05) are boxed in green. P-values were calculated using a t-test comparing the log2fc(output/input) of the reference and alternate alleles across the replicates. (log2fc) log2 fold change, (SNV) single nucleotide variant.
Eight of the significant eQTL variants occurred within the 17q21.31 locus, a region of extremely high LD (Bowles et al. 2022). The predicted target genes for these eQTLs include AC126544.2, ARL17A, ARL17B, CR936218.1, CRHR1, FAM215B, KANSL1-AS1, KANSL1, LRRC37A, LRRC37A2, MAPT-AS1, and MAPT, with each variant predicted to regulate at least eight of these genes (Supplemental Table S19). For all genes except two, ARL17A and MAPT-AS1, the target gene showed increased expression in individuals with the alternate allele for each variant (Supplemental Table S19). The 17q21.31 locus has been linked to several neurodegenerative diseases, including Alzheimer's disease (Jun et al. 2016), Parkinson's disease (Nalls et al. 2014, 2019; Bowles et al. 2022), frontotemporal dementia (Reus et al. 2021), and progressive supranuclear palsy (PSP) (Höglinger et al. 2011; Cooper et al. 2022).
Functional validation through enhancer knockout
We chose for further functional analysis four active enhancers showing high enrichment in the CapSTARR-seq experiment and associated with NPDs. CRISPR-Cas9 genome editing was used to delete candidate enhancers in phNPCs, with deletions ranging in size from 644 bp to 2525 bp (Supplemental Fig. S6; Supplemental Table S20). Densitometry analysis of genotyping PCR products showed genome editing knockout (KO) efficiency ranging from 19.69% to 44.97% (Fig. 5A–D; Supplemental Table S21).
CRISPR-Cas9 enhancer knockout (KO). (A–D) Left: DNA agarose gel image of the genotyping PCR results after KO of candidate enhancers in phNPCs through ribonucleoprotein (RNP)-mediated CRISPR-Cas9 genome editing. Control cells undergoing the same electroporation without any RNPs showed a clear strong wild-type (WT) band. For enhancer KO samples, besides the higher WT band, there is an additional clearly visible lower band in both BR1 and BR2 samples. The sizes of these lower bands are the same as the expected size of genome edited bands after enhancer KO. (A–D) Right: TaqMan qPCR showed diminished expression level of the target gene after enhancer KO. CT values from triplicates were used to calculate the expression of the target gene relative to control cells using the Pfaffl method. Averages of the BR1 and BR2 and standard deviations are shown as error bars. (A) Left: EH37E1198822 KO genotyping PCR result (WT band: 3375 bp, genome edited band: 850 bp). Right: Relative expression level change of the target gene NGEF after enhancer KO. (B) Left: EH37E1000386 genotyping PCR result (WT band: 1938 bp, genome edited band: 809 bp). Right: Relative expression level change of the target gene RORB after enhancer KO. (C) Left: EH37E0114246 genotyping PCR result (WT band: 1849 bp, genome edited band: 1205 bp). Right: Relative expression level change of the target gene PLEKHO1 after enhancer KO. (D) Left: EH37E0426064 genotyping PCR result (WT band: 3069 bp, genome edited band: 2203 bp). Right: Relative expression level change of the target gene TOM1L2 after enhancer KO. (Cells, +e) cells without RNPs that underwent the same electroporation and served as control, (NTC) PCR no-template control, (BR) biological replicate.
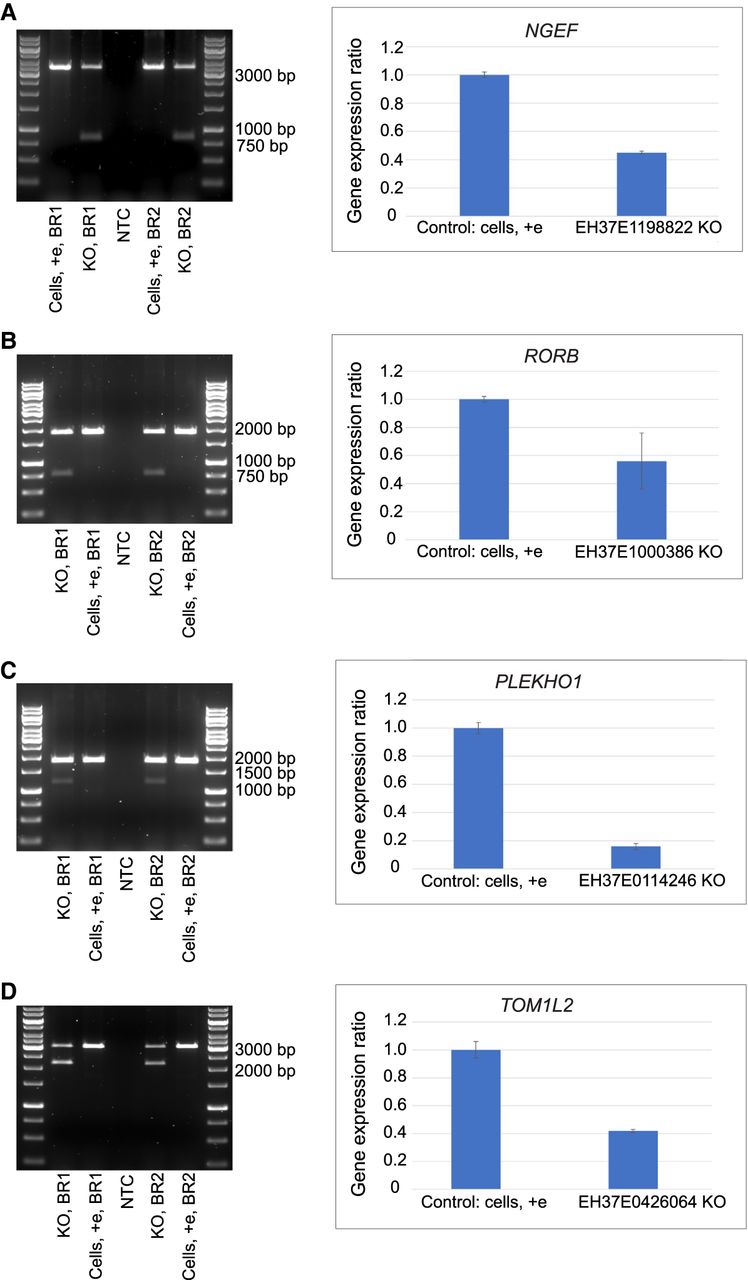
Relative expression levels of target genes were measured by TaqMan real-time quantitative PCR (qPCR) assay. The distribution of original CT values of the triplicates for target genes and reference gene beta-actin (ACTB) showed low standard deviation (SD), indicating that the experimental variability was low (Supplemental Tables S22–S25; Supplemental Figs. S7–S10). The qPCR assay showed that expression of all four target genes was diminished after enhancer knockout (Fig. 5A–D; Supplemental Tables S22–S25; Supplemental Figs. S7–S10): NGEF relative expression level was decreased to 0.45 (SD = ±0.01), RORB decreased to 0.56 (SD = ±0.2), PLEKHO1 decreased to 0.16 (SD = ±0.02), and TOM1L2 decreased to 0.42 (SD = ±0.01). This result demonstrates that these active enhancers do upregulate transcription of the target gene tested. This is consistent with previous results of high enrichment of these enhancers in the CapSTARR-seq experiment revealing strong enhancer activity, which may partially explain the mechanism of the target gene expression knockdown phenotype observed.
Discussion
Moving from computational predictions to functional evidence of gene regulatory activity remains an important and challenging area of modern genomics. Because there is substantial evidence for tissue-specific gene regulation and evidence that genetic risk for brain disorders resides within brain-enriched regulatory regions, maps of regulatory elements in brain-relevant cell types are of substantial value. We utilized a large-scale CapSTARR-seq approach to validate putative enhancer regions and characterize the noncoding genomic landscape of phNPCs. We identified 8148 regions with enhancer activity in phNPCs. Of these regions, 6612 were replicated in two experiments, demonstrating strong evidence of enhancer activity. Additionally, we generated ATAC-seq data in iPSC-derived NPCs and RNA-seq data in the phNPCs, providing further characterization of the noncoding landscape of the developing human brain.
The STARR-seq approach has not been widely used in neuronal tissue. This proof-of-principle experiment in a primary human neuronal cell line indicates that this method is likely applicable to other relevant systems, including hiPSC- and hESC-derived neurons and neuronal organoids. The phNPCs are a particularly valuable model, because they very closely recapitulate the expression patterns and network architecture of the developing human fetal brain (Stein et al. 2014; de la Torre-Ubieta et al. 2018; Liang et al. 2021; Aygün et al. 2024). Moreover, these NPC lines have been extensively validated via their use to develop human neurodevelopmental eQTL and chromatin accessibility (ca) QTL (Liang et al. 2021; Aygün et al. 2024).
The percentage of active regions (∼9%) identified in this study was much higher than that seen in whole-genome STARR-seq experiments (0.06%) (Liu et al. 2017) and similar to that seen in previous CapSTARR-seq studies in nonneuronal cell lines (Vanhille et al. 2015). Our active enhancer regions showed strong overlap with NPC ATAC-seq data (Supplemental Methods), with active STARR-seq regions showing higher ATAC-seq signals than either randomly selected regions or low-scoring STARR-seq regions (Supplemental Fig. S3). They also were enriched for TFBS (Table 2), an established feature of enhancer genomic sequences (Spitz and Furlong 2012; Panigrahi and O'Malley 2021), for highly expressed TFs (Fig. 2). Nearly 400 of our active enhancer regions also overlap active enhancer regions generated through MPRA studies in similar cell types (Supplemental Table S26), including NPCs (Deng et al. 2024) and neuronal organoids (Capauto et al. 2024; Deng et al. 2024). We also saw enrichment for GWAS variants associated with bipolar disorder, schizophrenia, and anorexia nervosa within our active enhancer regions (Supplemental Fig. S11; Supplemental Table S27), supporting a potential relationship between these regions and NPDs. Regions that were not identified as active enhancers in our CapSTARR-seq assay may represent other types of regulatory elements, including promoters, silencers, or insulators. As enhancers are highly dependent on cell type and developmental timepoint, these regions also may be poised enhancer regions that are active in a different cell type or at a different stage of development (Giacoman-Lozano et al. 2022).
To complete our understanding of enhancers, we need to link STARR-seq active regions with genes that these enhancers regulate. Utilizing gene regulatory networks from Emani et al. (2024), we identified 2288 unique predicted target genes. We examined overlap between these target genes and fetal eQTL genes (Supplemental Table S13; Wen et al. 2024) and found 319 overlapping genes enriched for immune-related pathways, like herpes infection and interleukin signaling (Supplemental Table S28). Comparatively, only 49 genes overlapped between our target genes and adult eQTL genes (Supplemental Table S13; Emani et al. 2024), and these genes were enriched for disease-related pathways like Alzheimer's disease and mental deterioration (Supplemental Table S29). We also compared our target gene list to peak-genes identified by Zhu et al. (2023) through RNA-seq and ATAC-seq analyses in postmortem human brain tissues. We found 585 overlapping genes (26%), and these genes were enriched for disease-related pathways including memory impairment, mental deterioration, and mental disorders (Supplemental Table S30). Zhu et al. (2023) examined postmortem brain samples ranging from fetal to adult, so this overlapping set represents enhancer-regulated genes throughout various stages of brain development.
We also utilized MutSTARR-seq to assess whether eQTL variants affect the activity of our putative enhancers. We identified 24 variants (51%) that significantly affected enhancer activity, a proportion higher than similar MPRA studies (Weiss et al. 2021; Cooper et al. 2022; Deng et al. 2024; Farrow et al. 2024) and large-scale eQTL analyses from the Genotype-Tissue Expression (GTEx) project (GTEx Consortium 2017). Eight of the significant variants are located within the 17q21.31 region, which is a 1.5-Mb inversion region (Bowles et al. 2022). Two major haplotypes, H1 and H2, exist in this region, with H1 being the more prevalent haplotype in individuals of European ancestry (∼80%). The H1 haplotype has been associated with a number of neurodegenerative diseases, including Alzheimer's disease (Jun et al. 2016), Parkinson's disease (Nalls et al. 2014, 2019; Bowles et al. 2022), and PSP (Höglinger et al. 2011; Cooper et al. 2022). Although no recent MPRA variant studies investigated our specific significant variants (Weiss et al. 2021; Cooper et al. 2022; Lagunas et al. 2023; Deng et al. 2024; Farrow et al. 2024), Cooper et al. (2022) did identify several other variants within the 17q21.31 locus that significantly affected gene expression. Similar to our study, many of their significant variants led to higher expression from the alternate allele. Further, the extensive implication of this candidate region with NPDs provides insight into how variation within these enhancer regions may contribute to disease development and progression.
CRISPR-mediated deletion of a subset of our candidate enhancers led to decreased expression of their predicted target genes, which have been implicated in brain-related functions and diseases. NGEF encodes a neuronal guanine nucleotide exchange factor (Rodrigues et al. 2000; Shamah et al. 2001) that has been associated with schizophrenia (Wu et al. 2020) and bipolar disorder (Wu et al. 2020; Yao et al. 2021). RORB, a clock gene involved in neurogenesis, stress response, and modulation of circadian rhythms, has been found to have positive associations with the pediatric bipolar phenotype in case-control sample sets (McGrath et al. 2009). A GWAS study identified PLEKHO1, a gene that plays a role in the regulation of the actin cytoskeleton, as a significant bipolar disorder risk locus (Stahl et al. 2019). TOM1L2, a gene encoding a protein putatively involved in intracellular protein transport, has been implicated as an Alzheimer's disease susceptibility gene (Reynolds et al. 2010; Ou et al. 2021; Ge et al. 2023). Collectively, these target genes are important candidates for further functional investigation in the search for the molecular basis of psychiatric disorders.
Whereas our study identified thousands of active enhancer regions in phNPCs, this approach also has a few inherent limitations. STARR-seq, by design, is a plasmid-based, ectopic approach (Muerdter et al. 2015). This design prevents us from investigating the activity of putative enhancers in their endogenous genomic context. CapSTARR-seq also screens candidate enhancers, rather than genome-wide, limiting our potential findings to only regions selected in our panel design. That recognized, we did select our candidate enhancer regions based on endogenous functional genomic data (e.g., ATAC-seq, ChIP-seq) from the human brain. We also note that another very similar plasmid-based reporter assay also shows very high correspondence to endogenous gene regulatory predictions and experimental validation (Cooper et al. 2022), suggesting that there is relatively good correspondence between these out-of-context assays and native genomic loci. Another limitation of our approach is that our Panel 1 design utilized data exclusively from the PFC. Although these data indicate open chromatin and predicted active enhancer regions in the adult brain, they do not directly represent active enhancer regions in NPCs. We addressed this limitation in our Panel 2 design, incorporating data from PFC, NPCs, and the developing human brain, and increased our rate of active enhancers from ∼4% in Panel 1 to ∼12% in Panel 2. Panel 1 transfection conditions were also optimized between replicates 1 and 2, leading to increased transfection efficiency and cell viability. This change in conditions may have caused the lower r2 value for Panel 1 (r2 = 0.72) compared with Panel 2 (r2 = 0.93).
Although we validated several of our active enhancers through MutSTARR-seq and CRISPR-based approaches, we could not conduct these validation experiments on the same number of candidate regions as our initial CapSTARR-seq screen. Our MutSTARR-seq results were in line with other similar studies (Weiss et al. 2021; Cooper et al. 2022; Deng et al. 2024; Farrow et al. 2024), but incorporating fetal eQTL data and data specific to individuals of Mexican ancestry may allow for the identification of additional variants affecting enhancer activity. Additionally, elucidating the function of enhancers through the one enhancer-one target gene pair strategy utilized in our CRISPR experiment is limited by the fact that one enhancer can, in principle, act on multiple genes, or one gene can be regulated by multiple enhancers (Jin et al. 2021). Further experimental validations should be undertaken to achieve a comprehensive matching of enhancers and putative target genes, such as scRNA-seq to reveal the whole transcriptome change after candidate enhancer KO, the establishment of the candidate enhancer KO mouse model, or pooled CRISPR interference (Cooper et al. 2022). Future experiments should also aim to identify the specific TFs involved in gene regulation at these enhancers, potentially by utilizing our TFBS motif analysis to knock down specific TFs in the phNPCs and examine effects on gene expression. Finally, although the phNPCs recapitulate many features of embryonic and fetal corticogenesis and development, they do not mature past the mid-fetal stage (Stein et al. 2014). The open chromatin landscape of the phNPCs (de la Torre-Ubieta et al. 2018) also differs substantially from even closely related model systems like hESC-derived NPCs (https://www.encodeproject.org/experiments/ENCSR278FVO/) (Supplemental Fig. S12; Supplemental Table S31), emphasizing the importance of cell type in enhancer studies. Similar studies should be conducted in models that better recapitulate later stages of brain development and the postnatal brain, such as brain organoids (Gordon et al. 2021).
In this study, we identified over 8000 regions with enhancer activity in a primary human neuronal progenitor cell line. About 30% of these regions overlap with fetal or adult brain eQTLs, which provides a high-confidence group of brain enhancers. Through the integration of several genomic data sets (Supplemental Table S32), we identified candidate enhancers and genes potentially active across different stages of brain development. We also generated iPSC-derived NPC ATAC-seq data and phNPC RNA-seq data, lending additional support to our set of enhancer regions. This study provides a comprehensive data set of active enhancer regions in phNPCs and provides insight into how these enhancer regions may be involved in brain development and function.
Methods
phNPC cell line generation and maintenance
The phNPC line was obtained from Dr. Daniel Geschwind's lab at UCLA. The creation of this line is described in detail in Konopka et al. (2012) and Stein et al. (2014). Briefly, the phNPC line was generated using a neurosphere isolation method from human fetal brains at 15–18 weeks postconception. Following isolation, the cells were established into a monolayer cell culture and maintained using standard culturing protocols (Supplemental Methods). The phNPCs were maintained in an undifferentiated state, and all experiments were done using cells with a low passage number (passage < 20) to ensure cellular integrity (Esquenet et al. 1997). The specific line used for this study was named “3C” and was derived from a female fetus of Mexican descent.
CapSTARR-seq probe design
Probes were designed to capture the target regions using HyperDesign software from Roche Sequencing Solutions. Our regions (human genome hg38) were uploaded into the software using the following settings: maximum close matches = 20, overhang = 30 bp. The regions were consolidated, meaning any overlapping regions were collapsed into a single continuous candidate region. This consolidation resulted in a final panel size of 22,314 regions for Panel 1 and 48,507 regions for Panel 2. The software then designed KAPA Target Enrichment Probes covering the inputted regions. These probes are 120 bp in length and, following hybridization with genomic DNA, can be captured through a bead-based capture method. For Panel 1, the software predicted 98.5% coverage of the candidate regions. For Panel 2, the software predicted 99.3% coverage of the candidate regions. Missing coverage was due to repetitive regions that are often present in noncoding regions of the genome. Following selection through HyperDesign, KAPA Target Enrichment Probes were ordered through Roche Diagnostics. The manufacturer probe design changed between Panels 1 and 2, which resulted in a slightly higher “off-target” rate in Panel 2 (Supplemental Table S3). Our candidate regions had a mean distance of 46,210.4 bp (median = 14,302 bp) to the nearest transcription start site (TSS) (Supplemental Fig. S13).
Input library generation
Human male genomic DNA obtained from Promega (Ref: G1471) was used to generate the input library. Two lots of DNA were used: Lot #0000305466 (concentration = 173 ng/µL) and Lot #0000461400 (concentration = 197 ng/µL). Full library generation is described in the Supplemental Methods. Briefly, DNA was sheared using a Covaris LE220 ultrasonicator and size selected (∼500 bp). Ligation of custom adaptors (Supplemental Table S33) was performed using the NEBNext Ultra Ligation Module for DNA. The resulting fragments were amplified using ligation-mediated polymerase chain reaction (LM-PCR) with Q5 Hot Start High-Fidelity 2× Master Mix (NEB) to allow the addition of homology arms necessary for cloning.
The LM-PCR products were then hybridized to the KAPA Target Enrichment Probes following the KAPA HyperCap Workflow v3.0 (Roche Diagnostics). To adjust this protocol for our cloning purposes, the LM-PCR primers MPI_ORI_F/R (Supplemental Table S33) were used in place of Universal Enhancing Oligos and the Post-Capture PCR Oligos. After hybridization, the captured genomic regions were cloned into the hSTARR-seq_ORI vector (Addgene #99296) (Muerdter et al. 2018; Supplemental Methods). The input library was sequenced on one lane of an Illumina MiSeq at the University of Chicago Genomics Facility using MiSeq Reagent Kit V3 and 75-bp paired-end reads.
Transfection of input library and output library preparation
The input capture library was electroporated into the phNPC line using a BTX AgilePulse MAX large volume transfection system. The passage number and cell counts used for each capture panel are provided in Supplemental Table S34. We transfected 10 µg of the input plasmid library per million cells using BTXpress High Performance Electroporation Solution (100 µL per 5 million cells). Electroporation parameters are detailed in the Supplemental Methods. Transfection efficiency was determined using a pmaxGFP plasmid (Lonza), as this plasmid is similar in size to the hSTARR-seq_ORI vector.
RNA was isolated from the phNPCs 24 h after electroporation using the Qiagen RNeasy Mini Kit and prepared for sequencing (Supplemental Methods). The output library was sequenced on one lane of an Illumina MiSeq at the University of Chicago Genomics Facility using MiSeq Reagent Kit V3 and 75-bp paired-end reads.
Enhancer peak calling
Sequenced CapSTARR-seq libraries were processed using STARRPeaker v1.2, which includes a new feature to restrict peak calling analysis to a supplied capture panel (Lee et al. 2020). Both input DNA and output RNA libraries were aligned to the GRCh38 reference genome (https://www.encodeproject.org/files/GRCh38_no_alt_analysis_set_GCA_000001405.15/) using BWA-MEM v0.7.17 (Li 2013). For alignments within each subreaction, we removed duplicates and filtered for properly aligned paired-end reads. We merged the filtered alignments from 16 subreactions to create a single BAM output file for STARRPeaker peak calling analysis. Default parameters were used for STARRPeaker except for the step size used to bin genome. A window length of 500 bp with a 50-bp step size was used. Capture region was extended by 50 bp in each direction before binning. In addition to genomic input, three covariate tracks were utilized, namely GC-content, mappability, and folding energy prediction, to model the null distribution. We removed ENCODE blacklist regions (ENCFF419RSJ) from the analysis. We identified putative enhancer regions for each capture panel and replicate. This enhancer peak calling method was stringent, potentially filtering out some active enhancer regions. However, it was used as a screening method to identify enhancers to interrogate through additional functional analyses. The identified enhancer peak regions had a mean distance of 24,428.1 bp (median = 483 bp) to the nearest TSS (Supplemental Fig. S13).
Transcription factor binding site analysis
In each panel, we intersected technical replicates and defined them as high-confidence enhancers when there was at least a 20-bp overlap. We used HOMER (Heinz et al. 2010) and MEME-Suite (Bailey et al. 2015) to perform motif enrichment analysis in the putative enhancers for each panel separately. Only those motifs that were detected by both HOMER and MEME-Suite were considered as true signals and used for the downstream analysis. We performed motif discovery in the 200-bp region around the center of the enhancers. For HOMER, the masked version of the genomes was used. We used 20,934 control sequences for Panel 1 and 41,433 control sequences for Panel 2, selected from nonactive regions called by STARRPeaker (input coverage ≥ 20 fragments, fold change bottom 10% quantile). We used the default setting of HOMER (v4.11.1), which allows for zero or one occurrence per sequence. Additional parameters are detailed in Supplemental Methods.
scRNA-seq in phNPCs
The scRNA-seq libraries were prepared using 10x Genomics Chromium, as suggested by the manufacturer (Chromium Next GEM Single Cell 3′ Reagent Kits v3.1). The scRNA-seq data sets were aligned with Cell Ranger from 10x Genomics. The five replicate scRNA-seq data sets were subsequently merged and analyzed using the Seurat v3 package (Stuart et al. 2019). To ensure quality of the data sets, we followed procedures of previous work (Polioudakis et al. 2019) to filter for cells with a low level of mitochondrial genes (<10%) and high but nonexcessive number of genes detected (more than 200 but less than three times of standard deviation from mean). Each data set captured 10,000–13,000 cells after the filter. The expression levels of well-known neural progenitor marker genes were plotted (Supplemental Fig. S14).
For TFBS motifs that were enriched in the putative enhancers, we examined the expression level of their corresponding TFs in the scRNA-seq data set. Because motif matching is a noisy process, we did not limit our analysis to the best match provided by HOMER. For a given enriched sequence, we considered all the similar motifs with a HOMER score of at least 0.85. We then averaged the expression scores of similar motifs. For the background data set, we chose 100 randomly selected TFs from Lambert et al. (2018). We used t-tests to calculate P-values comparing expression levels of associated TFs from Panels 1 and 2 (Supplemental Table S7) with the background data set of random TFs (Supplemental Table S8).
Predicted target genes and pathway analysis
For each of our putative enhancer regions, predicted target gene(s) were identified using gene regulatory networks published in Emani et al. (2024). Open chromatin peaks were intersected with putative enhancers to establish high-confidence enhancer-gene linkages. Of the total 8148 enhancers, we identified a total of 2288 unique linked genes (Supplemental Table S9). We also generated sets of 8148 random genomic regions to be used as control groups for our enhancer list. We intersected our enhancer list and the control groups with the gene regulatory network from Emani et al. (2024) to determine enhancer cell type specificity (Supplemental Table S10). T-tests were used to compare the enhancer set to the control sets. For pathway analyses, we inputted the list of linked genes into Metascape (Zhou et al. 2019) to identify biological pathways and diseases enriched within that gene list. As a comparison, we also generated 10 random subsets of 2288 genes from our entire candidate region list (Supplemental Table S12). We inputted these random gene lists into Metascape to determine background P-values to which our CapSTARR-seq gene set could be compared using a one-sample t-test.
MutSTARR-seq
To further validate the enhancers, we identified a subset of eQTLs from around 150 individuals with genotype and snRNA-seq data intersecting the putative enhancer regions (Emani et al. 2024). eQTLs were identified by using standard linear model approaches with consideration of various covariates (i.e., age, disorder, batch, etc.). Ranking of enhancers to be tested by MutSTARR-seq were prioritized based on the intersecting eQTL's statistical significance, effect size, and cell type ubiquity to maximize functional effect on the enhancer region. A total of 54 enhancers were selected to be mutated according to the alternate allele present in the eQTL. For each enhancer, we created eBlock (IDT) gene fragments with (alternate) and without (reference) the eQTL. Of our candidate regions, seven did not pass complexity and quality control tests by IDT due to repetitive elements. Those regions were excluded from the candidate list so that we tested a total of 47 regions. An additional 15 regions had to be trimmed from either the 5′ or 3′ end to eliminate repetitive regions to allow the sequence to pass quality control tests. For the trimmed regions, we ensured that the eQTL variant was not affected by this trimming. The remaining regions passed complexity and quality control tests during oligo design with IDT software. The final list of regions is in Supplemental Table S17.
MutSTARR-seq input and output library generation was done similarly to the generation of the CapSTARR-seq libraries and is detailed in Supplemental Methods. Libraries were prepared for sequencing using the Illumina MiSeq Reagent Kit V3-600 bp to generate 300-bp paired-end reads. They were sequenced with a 25% PhiX spike-in on two lanes (two replicates per lane) of an Illumina MiSeq at the University of Chicago Genomics Facility. Enhancer peaks were called as described above. Significance was assessed using t-tests comparing the log2fc(output/input) of the reference and alternate alleles across four technical replicates. Variants with a P-value < 0.05 were considered significant.
Candidate selection for CRISPR-Cas9 KO
To prioritize candidate enhancers for further functional validation, we overlapped enriched enhancer regions from Panel 1 of CapSTARR-seq with 165 disease-associated GWAS regions (Buniello et al. 2019) and identified 29 psychiatric disease-associated active enhancers. The target gene of the enhancer was defined as the nearby gene with the shortest distance from TSS to the enhancer. Then, we overlapped these enhancers and nearby genes with the predicted regulatory genes and enhancers identified from cell type–specific gene regulatory networks from the PsychENCODE integrative paper (Emani et al. 2024). Four enhancers (EH37E1198822, EH37E1000386, EH37E0114246, and EH37E0426064) that have the same predicted target gene were selected for the further functional validation (Supplemental Table S35).
KO of top candidate enhancers in phNPCs through ribonucleoprotein (RNP) - mediated CRISPR-Cas9 genome editing
Guide RNA (gRNA) design and RNP complex preparation
For each enhancer tested, a pair of upstream and downstream gRNAs were designed in a 300-bp window of the 5′ and 3′ flanking regions of the enhancer with the IDT gRNA design algorithm (IDT). The gRNAs with an on-target score > 50 and off-target score > 50 were chosen for custom synthesis from IDT (Supplemental Table S20). RNP complexes were generated for each gRNA as described in the Supplemental Methods. For each enhancer KO electroporation reaction, we combined upstream RNP with downstream RNP at equimolar quantity on ice to form an enhancer-specific RNP pair.
Electroporation of RNPs into phNPCs
The phNPC cell line was maintained as described above. Only cells with low passage number (15–17) were used for the electroporation experiments with biological replicates (BR) designated as BR1 and BR2. For the CRISPR-Cas9 protocol, we used the 4D-Nucleofector system and Amaxa P3 primary Cell 4D-Nucleofector X Kit S from Lonza. Specific RNP electroporation conditions are described in the Supplemental Methods. The cells were incubated for 24 h postelectroporation, followed by DNA extraction and RNA isolation.
Enhancer KO genotyping PCR
DNA was extracted from phNPCs with the QuickExtract DNA Extraction Solution (Lucigen). DNA lysate was used as the genotyping PCR template with Q5 Hot Start High-Fidelity 2× Master Mix (NEB) and enhancer-specific genotyping primer pair spanning the upstream and downstream Cas9-guide RNA cleavage sites (Supplemental Table S36). The DNA input amount, the annealing temperature, and PCR cycle numbers needed to be optimized for each enhancer. In general, ∼10 ng DNA was used in PCR with annealing temperature ranging from 66.9°C to 68°C and 25 to 31 PCR cycles.
The uncleaved control wild-type (WT) band and edited band after enhancer KO were separated by agarose gel electrophoresis prepared with SYBR Safe DNA gel stain (Invitrogen) in 1× Tris/acetic acid/EDTA buffer (Thermo Fisher Scientific). Gel images were obtained using a ChemiDoc MP Imaging System (Bio-Rad). The genome editing KO efficiency (percentage) was calculated through densitometric analysis. The DNA band intensities were analyzed using Image Labs software (Bio-Rad) by plotting the band intensities for each lane. The edited bands were cut from the gel and purified with QIAquick Gel Extraction Kit (Qiagen) for Sanger sequencing (Azenta).
Target gene expression assay
RNA extraction from phNPCs and reverse transcription (RT) were performed with Power SYBR Green Cells-to-CT Kit (Invitrogen) according to the manufacturer's instructions. Each predesigned PrimeTime qPCR Probe Assay (IDT) (Supplemental Table S37) for the target of interest was first tested to confirm an amplification efficiency between ∼88% and ∼110%. cDNA was amplified by real time qPCR using PrimeTime Gene Expression Master Mix (IDT) and the PrimeTime qPCR Probe Assay for the target of interest as described in the Supplemental Methods. Resultant quantification threshold cycles (CT) were calculated using the default settings in the QuantStudio Real Time PCR Software v1.3 (Applied Biosystems) (Supplemental Tables S22–S25). Results were analyzed using the Pfaffl mathematical model (Pfaffl 2001), with the control cells undergoing the electroporation simultaneously without any RNPs serving as calibrator.
Data access
The source data generated in this study have been submitted to the NCBI Gene Expression Omnibus (GEO; https://www.ncbi.nlm.nih.gov/geo/) under accession number GSE281139.
Competing interest statement
K.P.W. is a shareholder of Tempus Labs, Inc. and Provaxus, Inc. S.C.G.-G., L.C., M.Shi, M.S., M.F., and J.R.M. are shareholders of Tempus Labs, Inc. All other authors declare that they have no competing interests.
Acknowledgments
We acknowledge the members of the PsychENCODE Consortium for their contributions to this work. The full author list for the PsychENCODE Consortium can be found in the Supplemental Materials. This work was supported by National Institute of Mental Health grant 5U01MH116489 (S.C.G.-G., D.G., K.P.W., and M.G.).
Author contributions: S.C.G.-G., L.C., M.G., D.G., and K.P.W. were responsible for conceptualization of the project. S.C.G.-G., L.C., M.Shi, J.L., G.W., M.S., Q.G., L.Q., M.F., J.R.M., M.G., D.L., and K.P.W. were involved in the design and implementation of the methodology. J.L., G.W., M.W., A.H., M.G., Z.C., Y.C., J.Z., D.L., and M.G. analyzed the data. S.C.G.-G., L.C., J.L., G.W., Q.G., Y.C., and D.L. generated the figures and tables. The original draft was written by S.C.G.-G., L.C., J.L., G.W., Q.G., L.Q., and D.L. The manuscript was reviewed, edited, and approved by all authors.
Notes
[3] Supplementary material [Supplemental material is available for this article.]
[4] Article published online before print. Article, supplemental material, and publication date are at https://www.genome.org/cgi/doi/10.1101/gr.279584.124.
References
- ↵Anaya J-M, Shoenfeld Y, Rojas-Villarraga A, Levy RA, Cervera R. 2013. Autoimmunity: from bench to bedside. El Rosario University Press, Bogotá, Colombia.
- ↵Aygün N, Vuong C, Krupa O, Mory J, Le BD, Valone JM, Liang D, Shafie B, Zhang P, Salinda A, 2024. Genetics of cell-type-specific post-transcriptional gene regulation during human neurogenesis. Am J Hum Genet 111: 1877–1898. 10.1016/j.ajhg.2024.07.015
- ↵Bailey TL, Johnson J, Grant CE, Noble WS. 2015. The MEME Suite. Nucleic Acids Res 43: W39–W49. 10.1093/nar/gkv416
- ↵Barešić A, Nash AJ, Dahoun T, Howes O, Lenhard B. 2020. Understanding the genetics of neuropsychiatric disorders: the potential role of genomic regulatory blocks. Mol Psychiatry 25: 6–18. 10.1038/s41380-019-0518-x
- ↵Bernstein H-G, Müller S, Dobrowolny H, Wolke C, Lendeckel U, Bukowska A, Keilhoff G, Becker A, Trübner K, Steiner J, 2017. Insulin-regulated aminopeptidase immunoreactivity is abundantly present in human hypothalamus and posterior pituitary gland, with reduced expression in paraventricular and suprachiasmatic neurons in chronic schizophrenia. Eur Arch Psychiatry Clin Neurosci 267: 427–443. 10.1007/s00406-016-0757-7
- ↵Bowles KR, Pugh DA, Liu Y, Patel T, Renton AE, Bandres-Ciga S, Gan-Or Z, Heutink P, Siitonen A, Bertelsen S, 2022. 17q21.31 sub-haplotypes underlying H1-associated risk for Parkinson's disease are associated with LRRC37A/2 expression in astrocytes. Mol Neurodegener 17: 48. 10.1186/s13024-022-00551-x
- ↵Bryois J, Garrett ME, Song L, Safi A, Giusti-Rodriguez P, Johnson GD, Shieh AW, Buil A, Fullard JF, Roussos P, 2018. Evaluation of chromatin accessibility in prefrontal cortex of individuals with schizophrenia. Nat Commun 9: 3121. 10.1038/s41467-018-05379-y
- ↵Buniello A, MacArthur JAL, Cerezo M, Harris LW, Hayhurst J, Malangone C, McMahon A, Morales J, Mountjoy E, Sollis E, 2019. The NHGRI-EBI GWAS Catalog of published genome-wide association studies, targeted arrays and summary statistics 2019. Nucleic Acids Res 47: D1005–D1012. 10.1093/nar/gky1120
- ↵Capauto D, Wang Y, Wu F, Norton S, Mariani J, Inoue F, Crawford GE, Ahituv N, Abyzov A, Vaccarino FM. 2024. Characterization of enhancer activity in early human neurodevelopment using Massively Parallel Reporter Assay (MPRA) and forebrain organoids. Sci Rep 14: 3936. 10.1038/s41598-024-54302-7
- ↵Chen Z, Zhang J, Liu J, Dai Y, Lee D, Min MR, Xu M, Gerstein M. 2021. DECODE: a Deep-learning framework for Condensing enhancers and refining boundaries with large-scale functional assays. Bioinformatics 37: i280–i288. 10.1093/bioinformatics/btab283
- ↵Chourpiliadis C, Zeng Y, Lovik A, Wei D, Valdimarsdóttir U, Song H, Hammar N, Fang F. 2024. Metabolic profile and long-term risk of depression, anxiety, and stress-related disorders. JAMA Netw Open 7: e244525. 10.1001/jamanetworkopen.2024.4525
- ↵Cooper YA, Teyssier N, Dräger NM, Guo Q, Davis JE, Sattler SM, Yang Z, Patel A, Wu S, Kosuri S, 2022. Functional regulatory variants implicate distinct transcriptional networks in dementia. Science 377: eabi8654. 10.1126/science.abi8654
- ↵Corradin O, Scacheri PC. 2014. Enhancer variants: evaluating functions in common disease. Genome Med 6: 85. 10.1186/s13073-014-0085-3
- ↵Davidson S, Lear M, Shanley L, Hing B, Baizan-Edge A, Herwig A, Quinn JP, Breen G, McGuffin P, Starkey A, 2011. Differential activity by polymorphic variants of a remote enhancer that supports galanin expression in the hypothalamus and amygdala: implications for obesity, depression and alcoholism. Neuropsychopharmacology 36: 2211–2221. 10.1038/npp.2011.93
- ↵de la Torre-Ubieta L, Stein JL, Won H, Opland CK, Liang D, Lu D, Geschwind DH. 2018. The dynamic landscape of open chromatin during human cortical neurogenesis. Cell 172: 289–304.e18. 10.1016/j.cell.2017.12.014
- ↵Deng C, Whalen S, Steyert M, Ziffra R, Przytycki PF, Inoue F, Pereira DA, Capauto D, Norton S, Vaccarino FM, 2024. Massively parallel characterization of regulatory elements in the developing human cortex. Science 384: eadh0559. 10.1126/science.adh0559
- ↵Edwards AC, Aliev F, Bierut LJ, Bucholz KK, Edenberg H, Hesselbrock V, Kramer J, Kuperman S, Nurnberger JI, Schuckit MA, 2012. Genome-wide association study of comorbid depressive syndrome and alcohol dependence. Psychiatr Genet 22: 31–41. 10.1097/YPG.0b013e32834acd07
- ↵Emani PS, Liu JJ, Clarke D, Jensen M, Warrell J, Gupta C, Meng R, Lee CY, Xu S, Dursun C, 2024. Single-cell genomics and regulatory networks for 388 human brains. Science 384: eadi5199. 10.1126/science.adi5199
- ↵The ENCODE Project Consortium. 2012. An integrated encyclopedia of DNA elements in the human genome. Nature 489: 57–74. 10.1038/nature11247
- ↵Esquenet M, Swinnen JV, Heyns W, Verhoeven G. 1997. LNCap prostatic adenocarcinoma cells derived from low and high passage numbers display divergent responses not only to androgens but also to retinoids. J Steroid Biochem Mol Biol 62: 391–399. 10.1016/S0960-0760(97)00054-X
- ↵Farrow SL, Gokuladhas S, Schierding W, Pudjihartono M, Perry JK, Cooper AA, O'Sullivan JM. 2024. Identification of 27 allele-specific regulatory variants in Parkinson's disease using a massively parallel reporter assay. NPJ Park Dis 10: 44. 10.1038/s41531-024-00659-5
- ↵Fullard JF, Hauberg ME, Bendl J, Egervari G, Cirnaru M-D, Reach SM, Motl J, Ehrlich ME, Hurd YL, Roussos P. 2018. An atlas of chromatin accessibility in the adult human brain. Genome Res 28: 1243–1252. 10.1101/gr.232488.117
- ↵Gandal MJ, Zhang P, Hadjimichael E, Walker RL, Chen C, Liu S, Won H, van Bakel H, Varghese M, Wang Y, 2018. Transcriptome-wide isoform-level dysregulation in ASD, schizophrenia, and bipolar disorder. Science 362: eaat8127. 10.1126/science.aat8127
- ↵Ge Y-J, Ou Y-N, Deng Y-T, Wu B-S, Yang L, Zhang Y-R, Chen S-D, Huang Y-Y, Dong Q, Tan L, 2023. Prioritization of drug targets for neurodegenerative diseases by integrating genetic and proteomic data from brain and blood. Biol Psychiatry 93: 770–779. 10.1016/j.biopsych.2022.11.002
- ↵Ghasemi S, Teumer A, Wuttke M, Becker T. 2021. Assessment of significance of conditionally independent GWAS signals. Bioinformatics 37: 3521–3529. 10.1093/bioinformatics/btab332
- ↵Giacoman-Lozano M, Meléndez-Ramírez C, Martinez-Ledesma E, Cuevas-Diaz Duran R, Velasco I. 2022. Epigenetics of neural differentiation: spotlight on enhancers. Front Cell Dev Biol 10: 1001701. 10.3389/fcell.2022.1001701
- ↵Gong W, Guo P, Liu L, Yan R, Liu S, Wang S, Xue F, Zhou X, Sun X, Yuan Z. 2025. Genomics-driven integrative analysis highlights immune-related plasma proteins for psychiatric disorders. J Affect Disord 370: 124–133. 10.1016/j.jad.2024.10.126
- ↵Gordon A, Yoon S-J, Tran SS, Makinson CD, Park JY, Andersen J, Valencia AM, Horvath S, Xiao X, Huguenard JR, 2021. Long-term maturation of human cortical organoids matches key early postnatal transitions. Nat Neurosci 24: 331–342. 10.1038/s41593-021-00802-y
- ↵GTEx Consortium. 2017. Genetic effects on gene expression across human tissues. Nature 550: 204–213. 10.1038/nature24277
- ↵Heinz S, Benner C, Spann N, Bertolino E, Lin YC, Laslo P, Cheng JX, Murre C, Singh H, Glass CK. 2010. Simple combinations of lineage-determining transcription factors prime cis-regulatory elements required for macrophage and B cell identities. Mol Cell 38: 576–589. 10.1016/j.molcel.2010.05.004
- ↵Höglinger GU, Melhem NM, Dickson DW, Sleiman PMA, Wang L-S, Klei L, Rademakers R, de Silva R, Litvan I, Riley DE, 2011. Identification of common variants influencing risk of the tauopathy progressive supranuclear palsy. Nat Genet 43: 699–705. 10.1038/ng.859
- ↵Horwitz T, Lam K, Chen Y, Xia Y, Liu C. 2019. A decade in psychiatric GWAS research. Mol Psychiatry 24: 378–389. 10.1038/s41380-018-0055-z
- ↵Huggett SB, Stallings MC. 2020. Genetic architecture and molecular neuropathology of human cocaine addiction. J Neurosci 40: 5300–5313. 10.1523/JNEUROSCI.2879-19.2020
- ↵Inoue F, Kreimer A, Ashuach T, Ahituv N, Yosef N. 2019. Identification and massively parallel characterization of regulatory elements driving neural induction. Cell Stem Cell 25: 713–727.e10. 10.1016/j.stem.2019.09.010
- ↵Jin T, Rehani P, Ying M, Huang J, Liu S, Roussos P, Wang D. 2021. scGRNom: a computational pipeline of integrative multi-omics analyses for predicting cell-type disease genes and regulatory networks. Genome Med 13: 95. 10.1186/s13073-021-00908-9
- ↵Jun G, Ibrahim-Verbaas CA, Vronskaya M, Lambert J-C, Chung J, Naj AC, Kunkle BW, Wang L-S, Bis JC, Bellenguez C, 2016. A novel Alzheimer disease locus located near the gene encoding tau protein. Mol Psychiatry 21: 108–117. 10.1038/mp.2015.23
- ↵Klein JC, Agarwal V, Inoue F, Keith A, Martin B, Kircher M, Ahituv N, Shendure J. 2020. A systematic evaluation of the design and context dependencies of massively parallel reporter assays. Nat Methods 17: 1083–1091. 10.1038/s41592-020-0965-y
- ↵Konopka G, Wexler E, Rosen E, Mukamel Z, Osborn GE, Chen L, Lu D, Gao F, Gao K, Lowe JK, 2012. Modeling the functional genomics of autism using human neurons. Mol Psychiatry 17: 202–214. 10.1038/mp.2011.60
- ↵Kozlenkov A, Vermunt MW, Apontes P, Li J, Hao K, Sherwood CC, Hof PR, Ely JJ, Wegner M, Mukamel EA, 2020. Evolution of regulatory signatures in primate cortical neurons at cell-type resolution. Proc Natl Acad Sci 117: 28422–28432. 10.1073/pnas.2011884117
- ↵Lagunas T, Plassmeyer SP, Fischer AD, Friedman RZ, Rieger MA, Selmanovic D, Sarafinovska S, Sol YK, Kasper MJ, Fass SB, 2023. A Cre-dependent massively parallel reporter assay allows for cell-type specific assessment of the functional effects of non-coding elements in vivo. Commun Biol 6: 1151. 10.1038/s42003-023-05483-w
- ↵Lambert SA, Jolma A, Campitelli LF, Das PK, Yin Y, Albu M, Chen X, Taipale J, Hughes TR, Weirauch MT. 2018. The human transcription factors. Cell 172: 650–665. 10.1016/j.cell.2018.01.029
- ↵Lee D, Shi M, Moran J, Wall M, Zhang J, Liu J, Fitzgerald D, Kyono Y, Ma L, White KP, 2020. STARRPeaker: uniform processing and accurate identification of STARR-seq active regions. Genome Biol 21: 298. 10.1186/s13059-020-02194-x
- ↵Li H. 2013. Aligning sequence reads, clone sequences and assembly contigs with BWA-MEM. arXiv:1303.3997 [q-bio.GN]. 10.48550/arXiv.1303.3997
- ↵Liang D, Elwell AL, Aygün N, Krupa O, Wolter JM, Kyere FA, Lafferty MJ, Cheek KE, Courtney KP, Yusupova M, 2021. Cell-type-specific effects of genetic variation on chromatin accessibility during human neuronal differentiation. Nat Neurosci 24: 941–953. 10.1038/s41593-021-00858-w
- ↵Liu Y, Yu S, Dhiman VK, Brunetti T, Eckart H, White KP. 2017. Functional assessment of human enhancer activities using whole-genome STARR-sequencing. Genome Biol 18: 219. 10.1186/s13059-017-1345-5
- ↵McGrath CL, Glatt SJ, Sklar P, Le-Niculescu H, Kuczenski R, Doyle AE, Biederman J, Mick E, Faraone SV, Niculescu AB, 2009. Evidence for genetic association of RORB with bipolar disorder. BMC Psychiatry 9: 70. 10.1186/1471-244X-9-70
- ↵Merikangas KR, He J-P, Burstein M, Swanson SA, Avenevoli S, Cui L, Benjet C, Georgiades K, Swendsen J. 2010. Lifetime prevalence of mental disorders in U.S. adolescents: results from the National Comorbidity Survey Replication‐‐Adolescent Supplement (NCS-A). J Am Acad Child Adolesc Psychiatry 49: 980–989. 10.1016/j.jaac.2010.05.017
- ↵Muerdter F, Boryń ŁM, Arnold CD. 2015. STARR-seq—principles and applications. Genomics 106: 145–150. 10.1016/j.ygeno.2015.06.001
- ↵Muerdter F, Boryń ŁM, Woodfin AR, Neumayr C, Rath M, Zabidi MA, Pagani M, Haberle V, Kazmar T, Catarino RR, 2018. Resolving systematic errors in widely used enhancer activity assays in human cells. Nat Methods 15: 141–149. 10.1038/nmeth.4534
- ↵Mulero Hernández J, Fernández-Breis JT. 2022. Analysis of the landscape of human enhancer sequences in biological databases. Comput Struct Biotechnol J 20: 2728–2744. 10.1016/j.csbj.2022.05.045
- ↵Nalls MA, Pankratz N, Lill CM, Do CB, Hernandez DG, Saad M, DeStefano AL, Kara E, Bras J, Sharma M, 2014. Large-scale meta-analysis of genome-wide association data identifies six new risk loci for Parkinson's disease. Nat Genet 46: 989–993. 10.1038/ng.3043
- ↵Nalls MA, Blauwendraat C, Vallerga CL, Heilbron K, Bandres-Ciga S, Chang D, Tan M, Kia DA, Noyce AJ, Xue A, 2019. Identification of novel risk loci, causal insights, and heritable risk for Parkinson's disease: a meta-genome wide association study. Lancet Neurol 18: 1091–1102. 10.1016/S1474-4422(19)30320-5
- ↵Ou Y-N, Yang Y-X, Deng Y-T, Zhang C, Hu H, Wu B-S, Liu Y, Wang Y-J, Zhu Y, Suckling J, 2021. Identification of novel drug targets for Alzheimer's disease by integrating genetics and proteomes from brain and blood. Mol Psychiatry 26: 6065–6073. 10.1038/s41380-021-01251-6
- ↵Pan J-B, Hu S-C, Shi D, Cai M-C, Li Y-B, Zou Q, Ji Z-L. 2013. PaGenBase: a pattern gene database for the global and dynamic understanding of gene function. PLoS One 8: e80747. 10.1371/journal.pone.0080747
- ↵Panigrahi A, O'Malley BW. 2021. Mechanisms of enhancer action: the known and the unknown. Genome Biol 22: 108. 10.1186/s13059-021-02322-1
- ↵Papageorgiou SN. 2022. On correlation coefficients and their interpretation. J Orthod 49: 359–361. 10.1177/14653125221076142
- ↵Pers TH, Karjalainen JM, Chan Y, Westra H-J, Wood AR, Yang J, Lui JC, Vedantam S, Gustafsson S, Esko T, 2015. Biological interpretation of genome-wide association studies using predicted gene functions. Nat Commun 6: 5890. 10.1038/ncomms6890
- ↵Pfaffl MW. 2001. A new mathematical model for relative quantification in real-time RT-PCR. Nucleic Acids Res 29: e45. 10.1093/nar/29.9.e45
- ↵Piñero J, Bravo À, Queralt-Rosinach N, Gutiérrez-Sacristán A, Deu-Pons J, Centeno E, García-García J, Sanz F, Furlong LI. 2017. DisGeNET: a comprehensive platform integrating information on human disease-associated genes and variants. Nucleic Acids Res 45: D833–D839. 10.1093/nar/gkw943
- ↵Polioudakis D, de la Torre-Ubieta L, Langerman J, Elkins AG, Shi X, Stein JL, Vuong CK, Nichterwitz S, Gevorgian M, Opland CK, 2019. A single-cell transcriptomic atlas of human neocortical development during mid-gestation. Neuron 103: 785–801.e8. 10.1016/j.neuron.2019.06.011
- ↵Reus LM, Pasaniuc B, Posthuma D, Boltz T, International FTD-Genomics Consortium, Pijnenburg YAL, Ophoff RA. 2021. Gene expression imputation across multiple tissue types provides insight into the genetic architecture of frontotemporal dementia and its clinical subtypes. Biol Psychiatry 89: 825–835. 10.1016/j.biopsych.2020.12.023
- ↵Reynolds CA, Hong M-G, Eriksson UK, Blennow K, Wiklund F, Johansson B, Malmberg B, Berg S, Alexeyenko A, Grönberg H, 2010. Analysis of lipid pathway genes indicates association of sequence variation near SREBF1/TOM1L2/ATPAF2 with dementia risk. Hum Mol Genet 19: 2068–2078. 10.1093/hmg/ddq079
- ↵Roadmap Epigenomics Consortium, Kundaje A, Meuleman W, Ernst J, Bilenky M, Yen A, Heravi-Moussavi A, Kheradpour P, Zhang Z, Wang J, 2015. Integrative analysis of 111 reference human epigenomes. Nature 518: 317–330. 10.1038/nature14248
- ↵Rodrigues NR, Theodosiou AM, Nesbit MA, Campbell L, Tandle AT, Saranath D, Davies KE. 2000. Characterization of Ngef, a novel member of the Dbl family of genes expressed predominantly in the caudate nucleus. Genomics 65: 53–61. 10.1006/geno.2000.6138
- ↵Schizophrenia Working Group of the Psychiatric Genomics Consortium. 2014. Biological insights from 108 schizophrenia-associated genetic loci. Nature 511: 421–427. 10.1038/nature13595
- ↵Sethi A, Gu M, Gumusgoz E, Chan L, Yan K-K, Rozowsky J, Barozzi I, Afzal V, Akiyama JA, Plajzer-Frick I, 2020. Supervised enhancer prediction with epigenetic pattern recognition and targeted validation. Nat Methods 17: 807–814. 10.1038/s41592-020-0907-8
- ↵Shamah SM, Lin MZ, Goldberg JL, Estrach S, Sahin M, Hu L, Bazalakova M, Neve RL, Corfas G, Debant A, 2001. EphA receptors regulate growth cone dynamics through the novel guanine nucleotide exchange factor ephexin. Cell 105: 233–244. 10.1016/S0092-8674(01)00314-2
- ↵Spitz F, Furlong EEM. 2012. Transcription factors: from enhancer binding to developmental control. Nat Rev Genet 13: 613–626. 10.1038/nrg3207
- ↵Stahl EA, Breen G, Forstner AJ, McQuillin A, Ripke S, Trubetskoy V, Mattheisen M, Wang Y, Coleman JRI, Gaspar HA, 2019. Genome-wide association study identifies 30 loci associated with bipolar disorder. Nat Genet 51: 793–803. 10.1038/s41588-019-0397-8
- ↵Stein JL, de la Torre-Ubieta L, Tian Y, Parikshak NN, Hernández IA, Marchetto MC, Baker DK, Lu D, Hinman CR, Lowe JK, 2014. A quantitative framework to evaluate modeling of cortical development by neural stem cells. Neuron 83: 69–86. 10.1016/j.neuron.2014.05.035
- ↵Stuart T, Butler A, Hoffman P, Hafemeister C, Papalexi E, Mauck WM, Hao Y, Stoeckius M, Smibert P, Satija R. 2019. Comprehensive integration of single-cell data. Cell 177: 1888–1902.e21. 10.1016/j.cell.2019.05.031
- ↵Subramanian A, Tamayo P, Mootha VK, Mukherjee S, Ebert BL, Gillette MA, Paulovich A, Pomeroy SL, Golub TR, Lander ES, 2005. Gene set enrichment analysis: a knowledge-based approach for interpreting genome-wide expression profiles. Proc Natl Acad Sci 102: 15545–15550. 10.1073/pnas.0506580102
- ↵Substance Abuse and Mental Health Services Administration. 2021. Key substance use and mental health indicators in the United States: results from the 2020 National Survey on Drug Use and Health. HHS Publ No PEP21-07-01-003 NSDUH Ser H-56. https://www.samhsa.gov/data/
- ↵Trevino AE, Sinnott-Armstrong N, Andersen J, Yoon S-J, Huber N, Pritchard JK, Chang HY, Greenleaf WJ, Pasca SP. 2020. Chromatin accessibility dynamics in a model of human forebrain development. Science 367: eaay1645. 10.1126/science.aay1645
- ↵Vancampfort D, Stubbs B, Mitchell AJ, De Hert M, Wampers M, Ward PB, Rosenbaum S, Correll CU. 2015. Risk of metabolic syndrome and its components in people with schizophrenia and related psychotic disorders, bipolar disorder and major depressive disorder: a systematic review and meta-analysis. World Psychiatry 14: 339–347. 10.1002/wps.20252
- ↵Vanhille L, Griffon A, Maqbool MA, Zacarias-Cabeza J, Dao LTM, Fernandez N, Ballester B, Andrau JC, Spicuglia S. 2015. High-throughput and quantitative assessment of enhancer activity in mammals by CapStarr-seq. Nat Commun 6: 6905. 10.1038/ncomms7905
- ↵Walker RL, Ramaswami G, Hartl C, Mancuso N, Gandal MJ, de la Torre-Ubieta L, Pasaniuc B, Stein JL, Geschwind DH. 2019. Genetic control of expression and splicing in developing human brain informs disease mechanisms. Cell 179: 750–771.e22. 10.1016/j.cell.2019.09.021
- ↵Wang D, Liu S, Warrell J, Won H, Shi X, Navarro FCP, Clarke D, Gu M, Emani P, Yang YT, 2018. Comprehensive functional genomic resource and integrative model for the human brain. Science 362: eaat8464. 10.1126/science.aat8464
- ↵Weiss CV, Harshman L, Inoue F, Fraser HB, Petrov DA, Ahituv N, Gokhman D. 2021. The cis-regulatory effects of modern human-specific variants. eLife 10: e63713. 10.7554/eLife.63713
- ↵Wells MF, Nemesh J, Ghosh S, Mitchell JM, Salick MR, Mello CJ, Meyer D, Pietilainen O, Piccioni F, Guss EJ, 2023. Natural variation in gene expression and viral susceptibility revealed by neural progenitor cell villages. Cell Stem Cell 30: 312–332.e13. 10.1016/j.stem.2023.01.010
- ↵Wen C, Margolis M, Dai R, Zhang P, Przytycki PF, Vo DD, Bhattacharya A, Matoba N, Tang M, Jiao C, 2024. Cross-ancestry atlas of gene, isoform, and splicing regulation in the developing human brain. Science 384: eadh0829. 10.1126/science.adh0829
- ↵Werner MCF, Wirgenes KV, Shadrin A, Lunding SH, Rødevand L, Hjell G, Ormerod MBEG, Haram M, Agartz I, Djurovic S, 2022. Immune marker levels in severe mental disorders: associations with polygenic risk scores of related mental phenotypes and psoriasis. Transl Psychiatry 12: 38. 10.1038/s41398-022-01811-6
- ↵Wockner LF, Noble EP, Lawford BR, Young RM, Morris CP, Whitehall VLJ, Voisey J. 2014. Genome-wide DNA methylation analysis of human brain tissue from schizophrenia patients. Transl Psychiatry 4: e339. 10.1038/tp.2013.111
- ↵Wu Y, Cao H, Baranova A, Huang H, Li S, Cai L, Rao S, Dai M, Xie M, Dou Y, 2020. Multi-trait analysis for genome-wide association study of five psychiatric disorders. Transl Psychiatry 10: 209. 10.1038/s41398-020-00902-6
- ↵Yao X, Glessner JT, Li J, Qi X, Hou X, Zhu C, Li X, March ME, Yang L, Mentch FD, 2021. Integrative analysis of genome-wide association studies identifies novel loci associated with neuropsychiatric disorders. Transl Psychiatry 11: 69. 10.1038/s41398-020-01195-5
- ↵Yeatman HR, Albiston AL, Burns P, Chai SY. 2016. Forebrain neurone-specific deletion of insulin-regulated aminopeptidase causes age related deficits in memory. Neurobiol Learn Mem 136: 174–182. 10.1016/j.nlm.2016.09.017
- ↵Ylikallio E, Woldegebriel R, Tumiati M, Isohanni P, Ryan MM, Stark Z, Walsh M, Sawyer SL, Bell KM, Oshlack A, 2017. MCM3AP in recessive Charcot-Marie-Tooth neuropathy and mild intellectual disability. Brain 140: 2093–2103. 10.1093/brain/awx138
- ↵Zar J. 1999. Biostatistical analysis, 4th ed. Prentice Hall, Englewood Cliffs, NJ.
- ↵Zhou Y, Zhou B, Pache L, Chang M, Khodabakhshi AH, Tanaseichuk O, Benner C, Chanda SK. 2019. Metascape provides a biologist-oriented resource for the analysis of systems-level datasets. Nat Commun 10: 1523. 10.1038/s41467-019-09234-6
- ↵Zhu K, Bendl J, Rahman S, Vicari JM, Coleman C, Clarence T, Latouche O, Tsankova NM, Li A, Brennand KJ, 2023. Multi-omic profiling of the developing human cerebral cortex at the single-cell level. Sci Adv 9: eadg3754. 10.1126/sciadv.adg3754