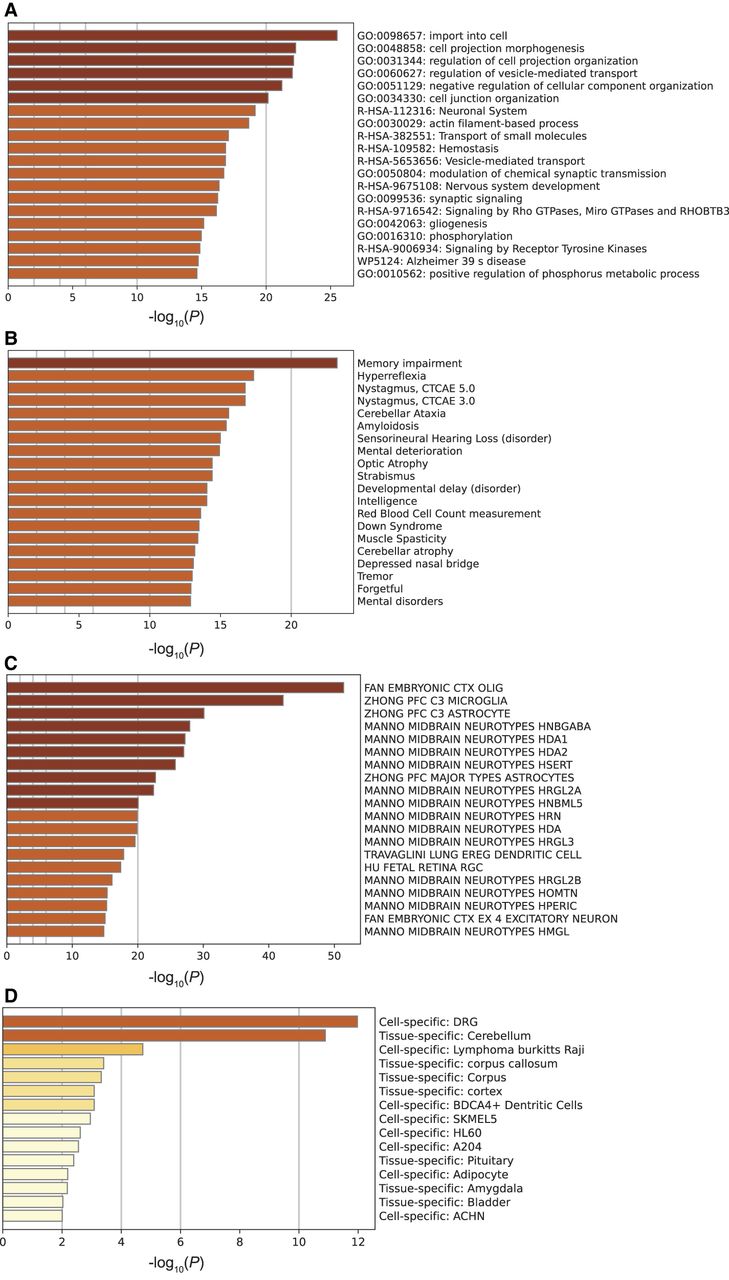
Figure 3.
Metascape pathway analysis of the 2288 predicted target genes. (A) Pathway and process enrichment results fielded from KEGG Pathway, GO Biological Processes, Reactome Gene Sets, Canonical Pathways, CORUM, WikiPathways, and PANTHER Pathway. P-values were calculated using the cumulative hypergeometric distribution (Zar 1999). (B) Associated diseases as identified through DisGeNET (Piñero et al. 2017). Enriched cell and tissue types are depicted in C (Subramanian et al. 2005) and D (Pan et al. 2013).