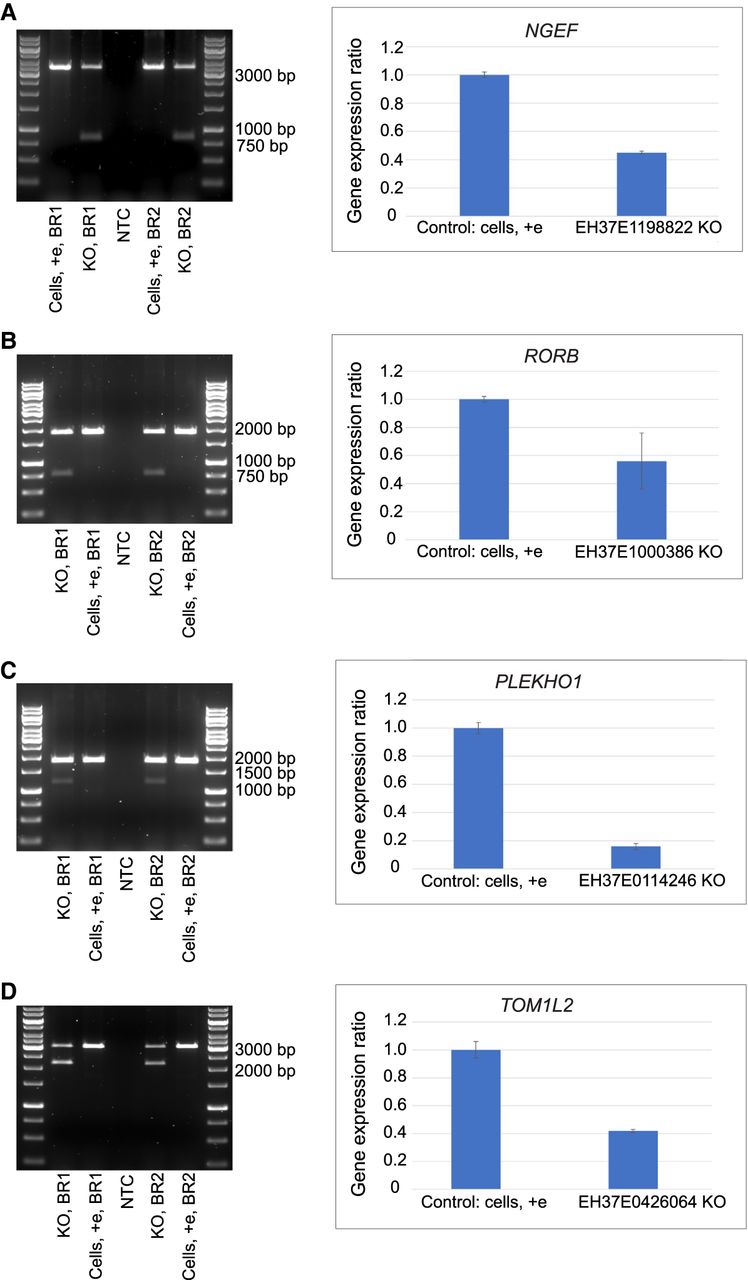
CRISPR-Cas9 enhancer knockout (KO). (A–D) Left: DNA agarose gel image of the genotyping PCR results after KO of candidate enhancers in phNPCs through ribonucleoprotein (RNP)-mediated CRISPR-Cas9 genome editing. Control cells undergoing the same electroporation without any RNPs showed a clear strong wild-type (WT) band. For enhancer KO samples, besides the higher WT band, there is an additional clearly visible lower band in both BR1 and BR2 samples. The sizes of these lower bands are the same as the expected size of genome edited bands after enhancer KO. (A–D) Right: TaqMan qPCR showed diminished expression level of the target gene after enhancer KO. CT values from triplicates were used to calculate the expression of the target gene relative to control cells using the Pfaffl method. Averages of the BR1 and BR2 and standard deviations are shown as error bars. (A) Left: EH37E1198822 KO genotyping PCR result (WT band: 3375 bp, genome edited band: 850 bp). Right: Relative expression level change of the target gene NGEF after enhancer KO. (B) Left: EH37E1000386 genotyping PCR result (WT band: 1938 bp, genome edited band: 809 bp). Right: Relative expression level change of the target gene RORB after enhancer KO. (C) Left: EH37E0114246 genotyping PCR result (WT band: 1849 bp, genome edited band: 1205 bp). Right: Relative expression level change of the target gene PLEKHO1 after enhancer KO. (D) Left: EH37E0426064 genotyping PCR result (WT band: 3069 bp, genome edited band: 2203 bp). Right: Relative expression level change of the target gene TOM1L2 after enhancer KO. (Cells, +e) cells without RNPs that underwent the same electroporation and served as control, (NTC) PCR no-template control, (BR) biological replicate.