
Charting the regulatory landscape of TP53 on transposable elements in cancer
- Xuan Qu1,2,4,
- Yonghao Liang1,2,4,
- Colin McCornack1,2,
- Xiaoyun Xing1,2,
- Heather Schmidt1,2,
- Chad Tomlinson3,
- Catrina Fronick3,
- Edward A. Belter Jr.3,
- Juan F. Macias-Velasco1,2,3 and
- Ting Wang1,2,3
- 1Department of Genetics, Washington University School of Medicine, St. Louis, Missouri 63110, USA;
- 2Edison Family Center for Genome Sciences and Systems Biology, Washington University School of Medicine, St. Louis, Missouri 63110, USA;
- 3McDonnell Genome Institute, Washington University School of Medicine, St. Louis, Missouri 63108, USA
-
↵4 These authors contributed equally to this work.
Abstract
The relationship between TP53 and transposable elements (TEs) has been obscure. Given the important role of TEs in oncogenesis, a comprehensive profiling of TE expression dynamics under the regulation of TP53 provides valuable resources for more clarity in TP53's roles in cancer. In this study, we characterized the TE transcriptomic landscape using long-read RNA-seq and short-read RNA-seq in three cancer cell lines varying only in TP53 genetic status. To identify transcripts that use TEs as potential promoters, we developed a computational pipeline, TEProf3, and identified in total 1942 transcripts with high confidence. Among these TE-derived transcripts, 239 are activated by TP53 and 221 are repressed by TP53. These TP53-responsive TE-derived transcripts are mainly driven by members of the ERV and LINE families. Following knockdown of wild-type (WT) TP53 expression, rescuing WT TP53 expression allows for partial recovery of the TE expression profile observed in the context of chronic TP53 expression. TP53 mutations R175H and R273H manifest their oncogenic characteristic partially through activating TE promoters in a cell type–specific manner. Lastly, we identified important sequence motifs that help govern the interactions between TEs and TP53, where TP53 activates TEs with TP53 binding motifs through direct binding and represses TEs indirectly via other pathways. Overall, we present a comprehensive profiling of the impact of TP53 on the activity of TE-derived promoters in isogenic cancer cell lines and provide a high-confidence TE expression atlas of TE promoters that are direct and indirect targets of TP53.
About half of the human genome is made up of transposable elements (TEs) (Burns 2017; Deniz et al. 2019). Throughout evolution, TEs have been exapted as cis-regulatory elements and can be used as promoters, enhancers, and insulators, providing fundamental building blocks for gene regulatory networks (Lamprecht et al. 2010; Babaian et al. 2016; Chuong et al. 2017; Sundaram and Wysocka 2020; Karttunen et al. 2023; Lawson et al. 2023; Shah et al. 2023; Liang et al. 2024). In normal and developed tissues, TEs are often suppressed by epigenetic mechanisms such as DNA methylation, repressive histone marks, and RNA and protein products such as the PIWI-interacting RNAs (piRNA) and the Krüppel-associated box (KRAB)-containing zinc finger protein (KZFP) family proteins (Liang et al. 2024). Disruption of this controlled regulation happens in disease conditions such as cancer, resurrecting the promoter activities of TEs that contribute to the overexpression of oncogenes (Babaian et al. 2016; Jang et al. 2019; Liang et al. 2024). Recent works have shown that TEs are exapted as alternative promoters in cancer, initiating tumor-specific transcription products and opening up opportunities for pan-cancer treatments (Shah et al. 2023; Jang et al. 2024; Liang et al. 2024). Characterization of the underexplored mechanisms of TE regulation in cancer is needed to comprehensively understand the gene regulatory network of the cancer genome.
One of the most important and well-studied guardians of genomic integrity, TP53 (protein product of TP53, also known as p53), leverages regulatory opportunities provided by TEs for its function. One group of TE families, human endogenous retroviruses (ERVs), contains one third of all TP53 binding sites in the human genome (Wang et al. 2007). Furthermore, TP53 has been shown to directly bind to the ORF1 region in long interspersed nuclear elements-1 (LINE-1) elements (Tiwari et al. 2020). In addition to physical interactions, activation of TP53 increases expression of ERVs and LINEs (Harris et al. 2009; Zhou et al. 2021; Peuget et al. 2024), with discordant evidence suggesting a suppressive effect of TP53 over LINEs (Wylie et al. 2016; Jung et al. 2018), highlighting the complex nature of the TP53-TE regulation dynamics. In cancer, tumors lacking wild-type (WT) TP53 are correlated with stronger TE-derived promoter activity (Shah et al. 2023). However, the combined complexity of the relationship between TP53 and TEs and past technological limitations made a comprehensive mapping of TP53's interactions with TEs challenging. In this study, we seek to provide clarity in the regulatory relationship between TP53 and TEs in cancer, focusing on the coopted promoter activity of TEs and transcript production.
Results
Leveraging LR-RNA-seq to identify TE loci with promoter potential
Using long-read RNA sequencing (LR-RNA-seq) and short-read RNA sequencing (SR-RNA-seq), we confidently identified bona fide promoters embedded in TE sequences at genomic locus level resolution (Fig. 1A). To aid in this identification, we developed a computational pipeline called TE-derived Promoter Finder 3 (TEProf3) to identify TE-derived promoters (TE promoters) and the resultant TE-derived transcripts from LR-RNA-seq and SR-RNA-seq data (Supplemental Fig. S1; Methods; Jang et al. 2019; Shah et al. 2023; Jang et al. 2024). We applied TEProf3 on SR-RNA-seq and LR-RNA-seq data from three immortalized cancer cell lines of colorectal and lung cancer, each with either wild-type or knockout (KO) TP53 and treated with DMSO, and identified 12,621 transcripts initiated from TE sequences, which we termed TE-derived transcripts (or TE transcripts) (Supplemental Table S1; Methods). Eight hundred eleven (6.4%) TE-derived transcripts from 487 TE loci were identified by both LR-RNA-seq and SR-RNA-seq, which we defined as Tier One transcripts with the highest discovery confidence (Fig. 1B). Three hundred five (2.4%) TE-derived transcripts from 231 TE loci were discovered only in LR-RNA-seq (Tier Two transcripts), and 11,505 (91.2%) TE-derived transcripts from 9242 TE loci were discovered only in SR-RNA-seq (Tier Three transcripts) (Fig. 1B). Next, we evaluated the authenticity of the identified TE promoters via assay for transposase-accessible chromatin using sequencing (ATAC-seq) and whole genome bisulfite sequencing (WGBS) (Fig. 1A), with the assumption that any active promoters would have locally accessible chromatin and loss of DNA methylation. Seventy-six percent of Tier One transcripts had accessible chromatin signal over promoter regions, whereas only 58% and 16% of Tier Two and Tier Three transcripts had open chromatin support, respectively (Fig. 1C). Tier One transcripts had the highest representation in lowly methylated promoters, and Tier Three transcripts had the highest representation in highly methylated promoters (Fig. 1D). These results demonstrated the high specificity of our TE-derived transcript discovery pipeline and the benefit of including LR-RNA-seq.
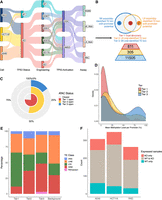
LR-RNA-seq and SR-RNA-seq identify TE loci with promoter potential. (A) Schematics of experiment design. (B) Schematics showing definition and count for three tiers of TE-derived transcripts identified across three cancer cell lines, with or without WT TP53, under DMSO treatment. (C) Percentage of TE-derived promoters (TSS ± 500 bp) that overlap with open chromatin signal from ATAC-seq across three tiers of TE-derived transcripts. (D) Density plot of average DNA methylation level over promoter region (TSS ± 0.5 kb) of TE-derived transcripts across three tiers of TE-derived transcripts. (E) Distribution of the associated TE class of each TE-derived transcript in each tier of identified TE-derived transcripts. (F) Count of TE-derived transcripts with TPM > 1 identified in cells with different TP53 genetic status.
Among Tier One transcripts, 54% and 30% of TE-derived transcripts were derived from long terminal repeat (LTR) and LINE elements, respectively, encompassing 84% of all Tier One transcripts and recapitulating previous findings (Fig. 1E; Shah et al. 2023). The increased percentage of SINE-derived transcripts in Tier Two and Tier Three transcripts are possibly technical artifacts of incomplete transcripts derived from intronic SINEs (Fig. 1E; Supplemental Fig. S2A; Sela et al. 2007; Elbarbary et al. 2016; Shao and Wang 2021; Gualandi et al. 2022). Across all three transcript tiers, we observed similar subfamily enrichment, particularly with LTRs like ERV1, suggesting that even with lower specificity in Tier Two and Tier Three transcripts, true positive signals were still captured (Supplemental Fig. S2B).
We next quantified the expression of Tier One transcripts using SR-RNA-seq (Methods). Around 300 TE-derived transcripts were identified in each cell line, with ∼15% specific to cells expressing WT TP53 and ∼22% specific to cells without WT TP53 (Fig. 1F). We found more TE-derived transcripts exclusive to KO TP53 cells than in WT TP53 cells, which supported TP53's suppressive role over TEs and was consistent with our previous study showing higher levels of TE-derived transcripts in tumors lacking WT TP53 (Fig. 1F; Shah et al. 2023). However, the presence of many WT TP53-specific transcripts underscored TP53's complex effects on TEs.
In summary, using TEProf3 with both LR- and SR-RNA-seq, we generated an atlas of over 10,000 TE loci with promoter activity and annotated their epigenomic profiles including chromatin accessibility and DNA methylation. We showed that LINEs and LTRs, especially ERV1s, served as active promoters for TE-derived transcripts and identified instances of TP53-mediated transcriptional initiation or repression over TE-derived promoters.
TP53 activation has a dualistic effect on TE-derived promoters
To more closely mimic cell stress conditions in tumors, we assessed the impact of doxorubicin activation of TP53 on TE-transcript expression and identified 22,210 TE-derived transcripts from 16,577 TE loci (Fig. 2A; Supplemental Table S2). Among these transcripts, 1278 (5.8%) TE-derived transcripts, from 959 TE loci, were supported by both LR-RNA-seq and SR-RNA-seq (Tier One transcripts). Differences between WT and KO cells in Tier One transcripts were more pronounced after doxorubicin treatment, with WT TP53 cells responding more to doxorubicin as compared to KO TP53 cells (Supplemental Fig. S3A,B). Expression of downstream targets of TP53, such as BAX, was upregulated upon doxorubicin treatment (Supplemental Fig. S4), validating successful activation of TP53. To delineate TP53-activation effects from those of doxorubicin treatment, we intersected TE-derived transcripts from doxorubicin-treated WT and KO TP53 cells and focused on WT-specific TE-derived transcripts (Fig. 2B). Upon TP53 activation, the number of TE-derived transcripts expressed exclusively in WT TP53 increased, indicating that TP53 activation enhances TE expression overall (Fig. 2B). This is further supported when comparing WT TP53 cells with and without doxorubicin treatment, where 399 of the 1578 Tier One transcripts were exclusively detected upon TP53 activation, and only 31 transcripts expressed exclusively in the control condition (Supplemental Fig. S3C). Next, using quantification information from SR-RNA-seq, we investigated the transcriptional dynamics of Tier One TE-derived transcripts as a function of the genetic and activation status of TP53 (Fig. 2C). The total number of differentially expressed TE-derived transcripts (DETs) between cells with WT and KO TP53 increased upon TP53 activation, including both upregulated and downregulated transcripts (Supplemental Fig. S3D). We categorized transcripts that were differentially highly expressed in WT cells as upregulated by TP53 and transcripts that were differentially highly expressed in KO cells as downregulated by TP53. The majority of DETs between WT and KO TP53 cells were unique to either control (DMSO) or doxorubicin treatment condition. Contrary to previous studies that suggest TP53 represses LINE elements and activates LTR elements, we observed both activation and repression of LINE- and LTR-derived transcripts by TP53 in the three cancer cell lines (Fig. 2C; Supplemental Fig. S3E,F; Harris et al. 2009; Wylie et al. 2016; Tiwari et al. 2020; McDonald et al. 2021; Zhou et al. 2021). Chromatin accessibility at the promoter regions of DETs was positively correlated with their expression in both control and doxorubicin conditions (Fig. 2C; Supplemental Fig. S3E,F). There was no difference in chromatin accessibility at the DET promoter regions between WT and KO cells in the control and doxorubicin treatment conditions, except for increased chromatin accessibility in upregulated TE-derived transcripts upon TP53 activation (Fig. 2D). Alongside previous studies demonstrating pioneer factor characteristics of TP53 (Sammons et al. 2015; Nishimura et al. 2022), these observations indicate that activated TP53 potentially functions as a pioneer factor over TE sequences, driving the promoter activity of TEs (Fig. 2D).
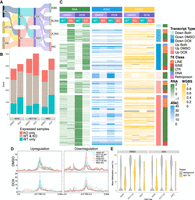
Doxorubicin-induced TP53 activation augments TE-derived transcription events. (A) Schematics of differential expression analysis setup for investigating TE-derived transcripts expression in WT and KO cells under control and TP53-activation. (B) Number of TE-derived transcripts with TPM > 1 that are present only in WT cells, only in KO cells, or in both WT and KO cells under control (DMSO)- or doxorubicin-treated conditions. Updated Tier One reference is created from both DMSO- and DOX-treated WT and KO cells across three cell lines. (C) Heat map showing the expression profile (z-score of TPM), chromatin accessibility (RPKM of area under the peak at promoter region [TSS ± 0.5 kb]), and DNA methylation (mean methylation level at promoter region [TSS ± 0.5 kb]) for differentially expressed transcripts (P-value < 0.05, abs(log2FC) > 2) in A549. Differential expression analysis was set up to compare WT versus KO in each condition. Differentially expressed transcripts (DETs) were grouped into up- or downregulated only in DMSO or DOX, and up- or downregulated in both DMSO and DOX. DETs were further subgrouped by TE class. (D) Profiles of ATAC-seq normalized density around TSS ± 3 kb for upregulated DETs and downregulated DETs in DMSO or DOX. (E) Mean methylation levels for TE loci that drive DETs and background TE loci, grouped by condition. TE subfamilies were filtered for those that contain at least 10 CpG islands, and each TE locus was filtered for those that contain at least one CpG island. DOX, doxorubicin.
Unlike chromatin accessibility, DNA methylation did not vary concordantly with expression of DETs across samples and treatment condition (Fig. 2C; Supplemental Fig. S3E,F). Among CpG island-containing TE loci, those located in background DNA (non-DET loci) had high DNA methylation, whereas DET TE loci had overall lower DNA methylation than the genomic background for all three cell lines in both control and doxorubicin conditions (Fig. 2E; Supplemental Fig. S3G,H; Supplemental Table S3). There was minimal overlap between differentially methylated regions (DMRs) and DET promoter regions in all three cell lines (Supplemental Fig. S3I). In overlapping regions of DMRs and DET promoters, downregulated transcripts were mostly hypermethylated, and upregulated transcripts had a higher proportion of hypomethylated regions (Supplemental Fig. S3I).
In summary, TP53 induces a specific TE-derived transcriptional profile, with active transcription-initiating TE loci mainly residing in LINE and LTR elements. Upon doxorubicin-induced TP53 activation, we observed a more transcriptionally active landscape, with a higher number of DETs between KO and WT and more open chromatin regions. The chromatin accessibility landscape distinguished between TP53 genetic and activation status responded closely alongside TE-derived transcriptional landscape. We did not observe strong global correlations between differential DNA methylation and differential TE-derived transcript expression as a function of TP53 but noted that low levels of DNA methylation could prime the promoter potential in TE loci.
MER61 and LTR10 subfamilies are universally enriched as driver promoters
To assess whether certain TE subfamilies were preferentially adopted as potential promoters and regulated by TP53, we conducted enrichment analysis over TE subfamilies associated with DETs between cells with WT and KO TP53 (Methods). Without TP53 activation, THE1D was enriched in HCT116 and RKO; whereas MER44B, LTR10F, and HERVH-int were enriched in A549 and HCT116 (Fig. 3A). Among TP53-upregulated transcripts, MER61C was significantly enriched across all three cell lines; whereas LTR7Y, LTR33, and HERVH-int were commonly enriched in both A549 and HCT116. In both control and TP53-activation conditions, MER61C was the only strongly enriched TE subfamily in upregulated transcripts, and THE1D was the only commonly enriched TE subfamily associated with downregulated transcripts in the two colon cancer cell lines (Fig. 3A,B). Following TP53 activation, ERV1-family members LTR27B, LTR10C, and LTR10B, as well as DNA transposon MER44B, were commonly enriched in upregulated transcripts in all three cell lines (Fig. 3B). Additionally, TE subfamilies in ERV1 (LTR8A, LTR12C, LTR10F), ERV3 (LTR41B, LTR18A, LTR108c_Mam), LTR5_Hs, and MER119 were enriched as TP53-downregulated transcript promoters in at least two cell lines.
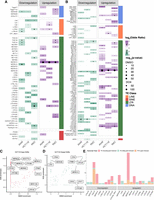
MER61 and LTR10 subfamilies are universally enriched as driver promoters. (A,B) TE subfamily enrichment profile for upregulated and downregulated DETs under either DMSO (A) or doxorubicin (DOX) treatment (B). (C,D) TE subfamily enrichment for open DARs (C) and closed DARs (D) in either DMSO or DOX treatment in HCT116. (E) Numbers of different TE-derived promoters and corresponding transcripts initiated from each TE subfamilies, colored by type of genes with which each transcript is associated.
Based on our previous observation of the concordance of chromatin accessibility and TE-derived transcript expression, we assessed TE subfamily enrichment across differentially accessible regions (DARs). In regions that differentially opened in WT TP53 cells, LTRs such as MER61C, MER61E, LTR10B1, LTR10B2, MER61D, LTR10E, LTR10C, LTR13, and MLT1H were robustly enriched in all three cell lines upon TP53 activation (Fig. 3C,D; Supplemental Fig. S5). LINEs showed the second highest representation in DARs, with L2a, L2b, L2c, L2, and L3 enriched among DARs regardless of activation, and L1PA15-16, L1M1, L1MA3, and L1PB1 enriched in DARs upon TP53 activation. DARs that closed in the presence of WT TP53 did not show shared patterns in TE subfamily enrichment across cell lines (Fig. 3D; Supplemental Fig. S5). Commonly shared TE subfamilies also showed transcript class-dependent promoter activity (Fig. 3E). For example, LTR41B, MER119, LTR8A, LTR5_Hs, LTR108c_Mam, L2d2, and LTR10E were associated with coding gene transcripts, whereas THE1D, MER61A, LTR12C, MER61C, and MER44B mainly associated with noncoding gene transcripts and TE alone transcripts. Overall, active transcription-initiating TE loci mainly reside in LTR and LINE, especially ERV1, ERV3, L1, and L2 families.
Taken together, enrichment assessment on differential transcriptional identities and chromatin accessibility profiles provided greater insight into the subfamilies regulated by TP53, with subfamilies in MER61 and LTR10 groups preferentially adopted as potential active promoters and exhibiting differential transcription activities as a function of TP53.
Rescue of TP53 partially restores the TE expression profile
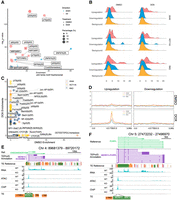
TP53 is often lost early in tumorigenesis due to its important function as a tumor suppressor (Olivier et al. 2010). Restoration of the WT TP53 in both human and mouse tumor cells that originally lack WT TP53 was shown to lead to tumor regression in vivo (Ventura et al. 2007; Xue et al. 2007). Previous work found that the number of TE-derived transcripts increases with absence of WT TP53, suggesting that loss of WT TP53 may have phenotypic consequences to changes in TE-derived transcript expression (Shah et al. 2023). Here, we sought to investigate whether restoring WT TP53 expression could recover the TE expression landscape. Whereas the original tumor cell lines all express WT TP53, for the restoration experiment we used corresponding cell lines with a KO TP53 background, performing lentiviral transduction to introduce either WT TP53 (KOWT) or a control empty vector (KOEV) (Fig. 4A). Due to differences in tolerance across cell lines, restoration of TP53 through this method resulted in varying TP53 expression compared to their parental TP53 WT cells, with A549 having the lowest restored expression and RKO exhibiting the highest expression restoration (Fig. 4B; Supplemental Fig. S4A,B). Despite this difference, all three cell lines resumed stable proliferation 4 weeks post-transduction, and TP53 was properly translated and phosphorylated upon activation in both the WT and KOWT cells (Fig. 4C; Supplemental Fig. S4D,E). Expression of known TP53 direct downstream targets was upregulated in both WT and, to a lesser extent, KOWT cells (Supplemental Fig. S4C,F). These observations collectively demonstrate the successful re-introduction of WT TP53 in KO cells.
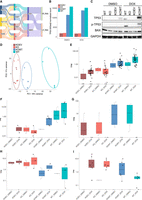
Short-term restoration of WT TP53 partially recovers parental DET profile. (A) Schematics of experiment design in this section. (B) Expression level of TP53 in WT, KO, KOWT, and KOEV cells in DMSO and doxorubicin (DOX) conditions. Data shown here is from HCT116. (C) Protein expression level of TP53, phosphorylated TP53, and BAX in WT, KO, KOWT, and KOEV cells in DMSO and DOX. Data shown here are from HCT116. (D) Principal component analysis using expression information of Tier One TE-derived transcripts. (E–I) Different patterns of DET expression in response to TP53 genetic and activation status. TPM for each transcript in each cell line are plotted. All three cell lines are included in each plot.
Using the expression profile of Tier One TE-derived transcripts as input, we observed sample clustering based on the genetic status of TP53 (Fig. 4D; Supplemental Fig. S4G,H). Importantly, restoration of TP53 expression in KOWT cells partially recovered the TE-derived transcription landscape and more closely resembled WT cells with chronic WT TP53 expression (Fig. 4D; Supplemental Fig. S4G,H). Despite incomplete rescue of TP53 expression, restoration still activated similar downstream TE-derived transcripts and TE-derived DET profiles, allowing us to investigate how TP53 individually regulates TE expression.
TP53 genetic status and activity results in a bidirectional effect on TE promoters
To dissect the complex interaction between TP53 and TEs, we crosschecked the TE expression profiles of cells with different genetic status, expression level, and activity of TP53 and delineated five sets of TE-derived transcripts with distinct expression patterns as a function of TP53. The first and most common set of transcripts were those that were only expressed with activated TP53 upon doxorubicin treatment (Fig. 4E). Similar to what is shown in Figure 2C, these transcripts were driven by TE copies of both LTRs and LINEs, including LTR10C, MER61C, MER44B, LTR3B, MER61D, MER61E, L1MCa, L1PA16, L2a, LTR10B2, LTR12C, MER115, L1PA2, and L2c. The second set of transcripts was activated by TP53 expression and responsive to TP53 activation (Fig. 4F). As TP53 availability increased following expression rescue, indicated by the expression of downstream target genes of TP53 (Supplemental Fig. S4C,F), we observed an increase in these transcripts’ expression correlated primarily with TP53 transcription and secondarily with TP53 activation, suggesting potential direct regulation and activation by TP53. TE-subfamilies associated with these transcripts were MER61C, LTR10B2, LTR10E, and L1MA3, which are known to be directly bound by TP53 (Bourque et al. 2008). The third set of transcripts, driven by MIRb and MER90, was upregulated by TP53 but repressed by the treatment of doxorubicin, making inference of the mechanism of their activity non-trivial (Fig. 4G). The fourth set of TE-derived transcripts is repressed by TP53 regardless of doxorubicin-activation, driven by LTR10F and AluSx copies (Fig. 4H). The last set of transcripts were those transcribed only with doxorubicin and repressed by TP53 and are associated with LTR33B, MIRb, AluJb, MLT1K, LTR10F, and LTR8A subfamilies of TEs (Fig. 4I).
Our findings demonstrated regulatory interactions between TP53 and individual TE locus governed by mechanisms beyond TE class, with factors such as the strength of the TP53 binding motif likely playing a significant role. Overall, we observed different families of TEs responded differently to TP53 and activation of TP53, with more TE-derived transcripts upregulated by TP53 than repressed by TP53.
TP53 mutations affect TE regulation in a cell type–specific manner
TP53 mutations are prevalent across cancers (Rivlin et al. 2011; Peuget et al. 2024). Mutated forms of TP53 usually no longer possess the original function and instead adopt stabilized and activated forms that favor tumor progression in the tumor stress environment (Mantovani et al. 2019). Due to potential de novo functions of mutated TP53, we sought to investigate whether TP53 mutants exert their effects through interactions with TEs. The two TP53 mutants we investigated, R175H and R273H, have the highest frequency in cancer among all TP53 mutations, and each represents a different mutation mechanism. R175H is a conformational mutation that deactivates the transactivating domain and provides oncogenic functions by enabling the mutated TP53 to interact with other proteins (Chiang et al. 2021). R273H is a contact mutation that enables the mutated TP53 to specifically drive AKT signaling and enhances cancer cell survivability (Tan et al. 2015; Vaddavalli and Schumacher 2022). TP53 mutant expressing cells were generated via lentiviral transduction in TP53 KO cells, which we refer to as KO175 and KO273 cells (Fig. 5A). Unlike WT TP53, which hindered cell proliferation when introduced, neither mutant affected cell proliferation, indicating that both mutants have lost their tumor suppressive function. Additionally, mutated TP53 was expressed at a higher level than WT TP53 when being transduced at the same viral titer, consistent with previous reports (Supplemental Fig. S6A; Dolma and Muller 2022). Upon doxorubicin treatment, only WT TP53-expressing cells showed activation of TP53 downstream targets, supporting the functional differences between WT and mutated TP53 (Supplemental Fig. S6A).
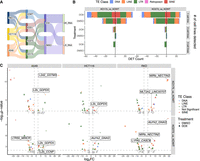
TP53 mutations R175H and R273H affect TE-derived promoter activity in a cell type–specific manner. (A) Schematics of TE-derived transcript experiment design for two TP53 mutants, R175H and R273H. (B) Distribution of numbers of DETs (P value < 0.001) that were up- or downregulated in either mutants, grouped by number of cell lines they were detected in. (C) Volcano plots for mutant specific DETs in each cell line. Labels indicate potential TE promoter and gene for transcripts that are mentioned in the text.
As with our previous samples, we generated LR-RNA-seq and SR-RNA-seq on cell lines with mutated TP53 (Fig. 5A) and identified 1942 Tier One TE-derived transcripts (Supplemental Table S4). In line with our findings in WT and KO cells, roughly 200 DETs were found across three cell lines when comparing the TP53 mutants with KOWT cells, indicating that mutated TP53 has functional differences compared to WT TP53 in terms of interactions with TEs (Figs. 2B, 5B). However, there was poor concordance of DETs across cell lines (P-value < 0.001) (Fig. 5B). Although some subfamilies were recurrently enriched across three cell lines, such as L2b driving DET transcription in KO175 of all three cell lines under both control and doxorubicin treatment conditions, the majority of differentially active TE copies compared to KOWT were unique to each cell line with mutated TP53 (Fig. 5B,C). There were zero and six TE loci with promoter potential shared by three and two cell lines in KO175 and KO273, respectively (Fig. 5B). KO273 did not have shared TE subfamilies across all three cell lines among their upregulated transcripts. In KO273 cells, we observed AluYk1 driven transcription of GNAI2 in HCT116 and RKO, and L2b driven transcription of GDPD5 in A549 and HCT116 (Fig. 5C). Genes associated with some of the mutant-specific upregulated transcripts were previously shown to be oncogenic, such as GSTM3 in urinary tract tumors, MINCR in lymphoma, CCNP in colon cancer, NECTIN2 in ovarian cancer, LINC00707 in colorectal cancer, and CASC9 in bladder cancer, indicating that mutant TP53’s oncogenicity may, in part, be due to TE-oncogene chimeric transcript production (Doose et al. 2015; Sánchez-Botet et al. 2018; Bekes et al. 2019; Wang et al. 2019, 2020; Zhan et al. 2020). These TE-oncogene chimeric transcripts, like other TE-derived transcripts, had inconsistent expression across three cell lines, possibly attributed to the availability of the “partners in crime” of mutated TP53. Our investigation of the genetic status and expression level of transcription factors directly bound by mutated TP53 indeed showed a cell type–specific expression landscape (Supplemental Fig. S6B; Kim and Lozano 2018; Sabapathy and Lane 2018).
Taken together, TP53 mutants R175H and R273H exhibited divergent TE expression profiles in a cell line-specific manner. Many TE-derived transcripts activated by mutated TP53 were associated with oncogenes across various cancer types. We hypothesize that TP53 R175H and R273H mutations exert their impact on TE promoter activity in a cell type–specific manner depending on the availability of their binding partners.
TP53–TE network is governed by TP53 binding motifs
To understand the mechanisms governing TE promoter activities as a function of TP53, we conducted motif enrichment analysis of the associated TE loci of DETs between WT and KO cells with and without doxorubicin. We observed robust motif enrichment of TP53 transcription factor family in DETs upregulated by TP53 for both control and doxorubicin conditions (Fig. 6A). Roughly 25% of upregulated DETs contained TP53 motif(s) in the promoter regions (Fig. 6A). TE loci of upregulated DETs with TP53 binding motif(s) were primarily LTRs, including LTR10B2, LTR10C, MER61C, MLT1A1, and MLT1H (examples shown in Fig. 6E,F; Supplemental Fig. S7A). Downregulated DETs had overall weaker motif enrichment than upregulated DETs, except for ZNF675 motif enriched in both control and doxorubicin conditions, consistent with previous findings demonstrating the repressive function of ZNF675 in TE activity (Fig. 6A; Garton et al. 2015; Imbeault et al. 2017). The TP53 binding motif was not enriched in TE loci among downregulated TE-derived transcripts. Among TE sequences containing at least one TP53 binding motif, TEs activated by TP53 had higher density of TP53 binding motifs compared to downregulated TEs and background, suggesting the importance of TP53 motif clusters in guiding TP53 binding and activation (Fig. 6B). We next evaluated the motifs enriched in DARs between WT and KO cells to examine whether activated TP53 acts as a pioneer factor in a TE-specific or a genome-wide manner (Fig. 6C). The TP53 motif was enriched across all three cell lines in open DARs upon doxorubicin treatment in WT cells (Fig. 6C). Collectively, these observations reinforced the well-known role of TP53 as a transcriptional activator and demonstrated that TP53 activated TE-derived transcription activities in addition to non-TE derived promoters (Raj and Attardi 2017).
TP53 – TE network is dictated by TP53 binding motifs. (A) HOMER motif enrichment over promoter regions of DETs. WT versus KO DETs from three cell lines were merged together to single sets of transcripts that are either upregulated or downregulated in response to TP53 in either DMSO or doxorubicin (DOX) condition. Pink indicates upregulated DETs and blue indicates downregulated DETs. Square indicates control condition, and circle indicates doxorubicin treatment condition. Size of each shape is proportional to percent presence of this motif in its sample group. Top motif matrices are listed on the right. (B) Density plot of TP53 transcription factor family motif frequency in either upregulated or downregulated transcripts or background TE-derived transcripts that are not differentially expressed. (C) HOMER motif enrichment over open DARs in either control or doxorubicin treatment condition for each cell line. (D) TP53 ChIP-seq occupancy over upregulated or downregulated DET TSS ± 3 kb depicted as average TP53 binding score profile in three cell lines under control and doxorubicin treatment. (E,F) WashU Epigenome Browser of TE-derived transcript MER61C-AC093866.1 in HCT116 (E) and MER61C-PURPL in A549 (F) with bigWig tracks for WT and KO under doxorubicin treatment of SR-RNA-seq, ATAC-seq, and ChIP-seq.
To validate the direct binding of TP53 to TE sequences with TP53 motifs, we conducted chromatin immunoprecipitation sequencing (ChIP-seq) on TP53 in WT and KO cells. By profiling TP53-binding activities 3 kb upstream of and downstream from DETs’ transcription start sites (TSSs), we observed weak and noisy binding evidence over upregulated and downregulated transcripts in the control condition and clear TP53-binding signals in upregulated but not in downregulated DETs following doxorubicin treatment (Fig. 6D). This further confirmed our interpretation from RNA-seq and ATAC-seq that TP53 directly binds to TEs to activate the TE promoter activities.
Given the important role of transcription factor binding motifs governing TE-derived transcription, we explored how other transcription factor motifs potentially influence transcriptional differences (Supplemental Fig. S7A,B; Jang et al. 2024). For example, both upregulated and downregulated transcripts can be initiated from LTR7C in A549. However, LTR7C-derived promoters activated by TP53 enriched for ZNF85, ZN449, RXRB, KLF1, HXA13, and GATA3 motifs, whereas LTR7C-derived promoters negatively responsive to TP53 enriched for IRF4 and IRF8 motifs (Supplemental Fig. S7A,B). Similarly, in L2b, loci associated with upregulated transcripts enriched for ZN257, whereas loci associated with downregulated transcripts enriched for JUND and FOSB (Supplemental Fig. S7A,B). In the RKO cell line, THE1A elements were enriched in both upregulated and downregulated transcripts, with downregulated, but not upregulated, transcripts enriched for MYC, IRF4, IRF8, and ETS2 motifs (Supplemental Fig. S7A,B).
We concluded that TP53 upregulates the promoter activities of TEs, including LTR10 and MER61, through direct binding, while repressing other TE subfamilies, such as L1, L2, and THE1A, through intermediate or indirect pathways. The density of TP53 binding motifs in the promoter region was also important in mediating potent TP53 activation of TE sequences. Additionally, we observed individual TE subfamilies acting in both activating and repressing manners depending on the TF binding motifs within the TE locus.
Discussion
TEs provide a diverse frame for cis-regulatory resources in our genome (Sundaram et al. 2014; Chuong et al. 2017). Having shown their functional capability as promoters, we sought to understand the principles and pathways of their regulation in the cancer genome, focusing specifically on the relationship of TP53 with TEs (Jang et al. 2019; Shah et al. 2023). Using a combination of SR-RNA-seq and LR-RNA-seq, we created a TE-derived transcript atlas, detailing TE loci with potential promoter activity in different TP53 expression and activation contexts. We found SR-RNA-seq, though robust in transcription quantification, can create false positives of TE-promoter loci, due to either inaccurate 5′ extended or fragmented de novo transcript assembly. By capturing full-length transcripts, LR-RNA-seq improved the fidelity of our annotation of TE-derived transcripts, allowing robust detection of TE loci coopted as promoters (Maeng et al. 2023). With our goal to identify TE-derived transcripts with the highest confidence, we eventually narrowed down to TE loci with active promoter activity by combining support from both LR- and SR-RNA-seq. Though we believe the transcripts we identified were true and comprehensive, we acknowledge the limitation that our reference was solely based on three in vitro cell line systems. One way to combat this limitation is to profile more cell line pairs of WT and KO TP53. Nonetheless, we believe our study design aligns with and meets our goal, which is to derive general principles rather than focusing on individual exceptions.
Although widely used and invariant between our comparisons, these cell lines nevertheless contain unwanted mutations in addition to TP53. To understand this potential confounding source of variation, we leveraged our WGBS data to investigate the extent to which this could affect our interpretation (Supplemental Fig. S8A). Across the non-isogenic cell lines, we found that 9293–50,726 (20%–42%) SNVs were specific to the cell lines, underscoring the high background genetic variations across cancer cell lines (Supplemental Fig. S8B). However, between the isogenic cell lines (comparing TP53 WT and KO), there were only 1–1621 (0%–1%) SNVs that were not shared between the isogenic pairs (Supplemental Fig. S8C). This result suggests that even though mutations accumulate over time after isogenic cell lines are established, background genetic variations remain two orders of magnitude higher than newly acquired mutations.
Although TP53 has a rather extensive and complex regulatory network, we seem to have unveiled a simple principle from both transcriptional and epigenomic aspects: TP53 activated promoter activities of TEs through direct binding to TE loci with TP53 binding motifs and indirectly repressed TEs via intermediate partners. Previous work suggests that TP53 binding events did not necessarily correlate with transactivation of nearby genes, and TP53 frequently accesses closed chromatin regions (Su et al. 2015). We investigated TP53-mediated TE activation and repression by first identifying actively transcribed transcripts and subsequently looking for potential regulation by TP53. Epigenomic evidence suggested that ∼70% of the DET promoters had accessible chromatin. Among CpG-island-containing TE-derived promoter regions, DNA methylation was lower in those driving DETs than non-DETs. Whereas DET promoters often colocalized with accessible chromatin and lowly methylated regions, DARs had strong enrichment in LTR subfamilies and universal enrichment for TP53 binding motifs in the presence of activated TP53. ChIP-seq further supported this observation by providing direct binding evidence in TE subfamilies including LTR10 and MER61. In summary, active and accessible epigenomic regions facilitate direct regulation of TP53 on its TE targets.
Nearly one third of TP53 binding sites across the genome overlap with TEs, and TEs contain more robust binding motifs than non-TE regions for TP53 (Wang et al. 2007; Su et al. 2015). However, TP53-TE subfamily specificity had remained unexplored. Upon acute TP53 expression restoration, promoters originating from MER61C elements were universally enriched by all cell lines. Upon doxorubicin treatment, additional TE subfamilies that were enriched in chronic WT TP53-expressing cells in control became enriched in TP53-restored cells. The same TE subfamilies can act as potential promoters in both activated and repressed transcripts due to sequence variations across copies, leading to the presence of different transcription factor binding motifs and divergent regulatory functions.
We also found that MER61C drove several previously discovered direct TP53-downstream noncoding transcripts, such as PINCR, PURPL, and AC093866.1 (Chaudhary et al. 2017; Li et al. 2017; Guo et al. 2021). These noncoding transcripts, activated by TP53, were oncogenic in nature and have been shown to play important roles in tumorigenesis. In contrast, none of the classic TP53 DNA damage pathway targets, despite being upregulated in our model, adopted TE promoters. Thus, we propose that TEs function as potential partners-in-crime with oncogenes, which leverage the large reservoir of TP53 binding motifs in TEs to bypass TP53-mediated cell death pathways (Jang et al. 2019; Shah et al. 2023; Ivancevic et al. 2024).
Although LR-RNA-seq provided a confident profile of TE-derived promoters and transcripts, other short-read sequencing-based epigenetics profiling, such as DNA methylation and chromatin accessibility, were still limited by the repetitive nature of TEs, especially for young TE subfamilies. For example, the absence of young LINE subfamilies in the differential chromatin accessibility analysis could possibly be attributed to the removal of multi-mapped reads (Supplemental Fig. S9). We hope technology advancement can help us overcome this long-standing hurdle for studying young TE elements in the future.
Overall, we present three cancer cell line systems and a TE-derived transcript atlas as a function of TP53 genetic and activation status. We identified, in total, 1942 high-confidence transcripts using TEs as their potential promoters. We hope this comprehensive, high-confidence profiling can provide clarity in TP53's regulatory relationship with TE and can help launch future investigations on applications of these targets in disease contexts.
Methods
Cell culture
A549 cells (purchased from abcam: TP53-WT: ab255450; TP53-KO: ab276092) were cultured in F-12K (GIBCO, 21127022) supplemented with 10% FBS and 1% Pen/Strep (P/S). HCT116 cells (Sur et al. 2009) (gift from Z. Andrysik and J.M. Espinosa from the Department of Pharmacology, University of Colorado Anschutz Medical Campus: TP53-WT and TP53-KO) were cultured in McCoy's 5A modified (GIBCO, 16600082) supplemented with 10% FBS and 1% P/S. RKO cells (purchased from Horizon Discovery: TP53-WT: HD PAR-077; TP53-KO: HD 106-002 [Sur et al. 2009]) were cultured in RPMI 1640 (GIBCO, 21875034) supplemented with 10% FBS and 1% P/S. Pharmaceutical activation of TP53 was done by culturing cells in 1 μM doxorubicin in DMSO for 24 h, with 0.1% DMSO as control.
Plasmids
Lentiviral expression constructs were generated from the following plasmids kindly provided as a gift from Bernard Futscher (Junk et al. 2008): pLenti6/V5-TP53_wt TP53 (Addgene plasmid #22945; http://n2t.net/addgene:22945; RRID:Addgene_22945); pLenti6/V5-TP53_R175H (Addgene plasmid #22936; http://n2t.net/addgene:22936; RRID:Addgene_22936); pLenti6/V5-TP53_R273H (Addgene plasmid #22934; http://n2t.net/addgene:22934; RRID:Addgene_22934). The pLenti6/V5 empty vector (EV) was generated by deleting the WT TP53 out of the pLenti6/V5-TP53_wt TP53 plasmid. All plasmids were confirmed by sequencing.
Lentiviral production
Lentivirus was generated by performing PEI transfection on HEK293T with a mix of target plasmid, envelope plasmid pMD2.G-VSVG, and packaging plasmid psPAX2 in Opti-MEM (Gibco, 31985070). Supernatant was collected from each plate and spun down at 1200g for 5 min at 4°C 3 days after transfection, followed by filtering through a 0.45 µm filter. Lenti-X Concentrator (Clontech, 631232) was then added to the filtrate and incubated at 4°C for 4 h. Mixture was then harvested and centrifuged at 1500g for 45 min at 4°C. After supernatant aspiration, the pellet was resuspended in 10% of the original medium volume of PBS at 4°C, aliquoted, and stored at −80°C.
Western blot
Whole-cell lysates were extracted with RIPA buffer (abcam, ab156034) supplemented with PMSF (Thermo Fisher Scientific, 36978) and protease inhibitor cocktail (abcam, ab65400) by incubation on ice for 15 min, followed by centrifugation. Supernatants were then collected and quantified with BCA assay (Thermo Fisher Scientific, A55864). Protein was then denatured with Blue Loading Buffer Pack (Cell Signaling Technology, 7722S) and loaded into 10% or 16% Tris-Glycine Mini Gels (Thermo Fisher Scientific, XP00105BOX, XP00165BOX). To detect TP53 and its downstream targets, we used anti-TP53 antibody (proteintech, 10442-1-AP), anti-phospho-TP53 antibody (Cell Signaling Technology, 9284), anti-p21 (CDKN1A) antibody (proteintech, 10355-1-AP), and anti-BAX antibody (Cell Signaling Technology, 2772). All primary antibodies were diluted at 1:300. Secondary antibodies used were anti-rabbit and anti-mouse (Cell Signaling Technology, 7074, 7076; 1:2000 dilution). The Western blot was developed with Thermo Fisher Scientific myECL Imager (Thermo Fisher Scientific, 62236).
Library preparation for ONT cDNA long-read sequencing
Total RNA was extracted with the RNeasy mini kit (Qiagen, 74104). Two hundred nanograms of total RNA was input into the PCR-cDNA Barcoding kit (Oxford Nanopore Technologies, SQK-PCB111.24). A custom primer was added to the RT and the template switching oligo with a UMI was incorporated. The RT reaction was split into 2–4 sec strand PCR reactions, depending on the number of libraries being multiplexed per sequencing run. Fourteen cycles of PCR with 8-min extensions was performed. The PCR reactions were pooled together and purified by a bead cleanup as outlined by the manufacturer. Unique barcoded adaptors were ligated per samples, and a bead purification of each library was performed. The barcoded libraries were pooled in equal molar rations, and ∼40 fmol were loaded per PromethION flow cell (R9.4.1, Oxford Nanopore Technologies, FLO-PRO002). Sequence data were generated on the PromethION P-24 instrument. Data were collected for ∼72–80 h generating >100 m reads per run.
Data processing for ONT cDNA long-read sequencing
All ONT cDNA-seq data were first basecalled using the Guppy basecaller, version 6.4.6+ae70e8f, in conjunction with the dna_r9.4.1_450bps_sup_prom.cfg basecalling model. A demultiplexing schema based upon the LAST aligner (Eccles 2022), version 1454, is used to further filter out ONT reads that are chimeric, lacking a barcode sequence, or that contain the incorrect barcode sequence. Pychopper developed by Oxford Nanopore Technologies, version 2.5.0, was then used to trim barcodes and adaptors and to orient the reads. An additional step of poly(A) tail trimming was done using cutadapt (Martin 2011). Alignment was done using minimap2 (Li 2018), version 2.26, assisted with known junction BED in hg38. Secondary and supplemental reads, as well as those with a quality score below 40, were filtered out before inputting into StringTie2 (Kovaka et al. 2019), version 2.2.1, long-read mode, for de novo assembly. StringTie2, version 2.2.1, quantification mode was used to estimate known transcript-level and gene-level expression using GENCODE v36 hg38 primary assembly as reference.
Library preparation and data processing for cDNA short-read sequencing
Total RNA was extracted with the RNeasy mini kit (Qiagen, 74104). The cDNA libraries were prepared using a TruSeq Stranded Total RNA Library Prep kit with Ribo-Zero Gold (Illumina) according to the manufacturer's instructions. Paired-end (2 × 150 bp) sequencing was performed on NovaSeq 6000 (Illumina). Reads were aligned with STAR v2.6.1b (Dobin et al. 2013). De novo assembly was then conducted in StringTie2 (Kovaka et al. 2019), version 2.2.1 unguided mode, and quantification was done in StringTie2 using quantification mode with GENCODE v36 hg38 primary assembly as reference. Differential analysis was carried out using DESeq2 v1.26.0 (Love et al. 2014).
TE-derived transcript discovery pipeline and downstream data analysis
The procedures to identify transcripts derived from transposable elements (i.e., transcripts with transcription start sites/promoters embedded in TE sequences) have been previously described (Shah et al. 2023; Jang et al. 2024). We have evaluated that when the transcription start sites overlap with TE sequences, the associated promoters will also be in the same TE copy by using a operational definition of promoter (the genomic interval from 50 bp upstream of to 50 bp downstream from the transcription start sites) (Supplemental Fig. S1D–F; Cooper et al. 2006; Haberle and Stark 2018). In this study, we refined and adjusted these procedures to enhance both sensitivity and specificity. Furthermore, we have integrated the utilization of long-read RNA-seq data into the process. The resulting pipeline, named Transposable element-derived promoter finder 3 (TEProf3) has been wrapped as a Python package available on GitHub (see Data access). Here, we provide a concise summary of the outlined procedures (Supplemental Fig. S1A):
-
Assembly and annotation of transcripts
BAM files were used as input for de novo transcript assembly using StringTie version 2.2.1 (Kovaka et al. 2019). Transcription start site of each transcript was intersected to RepeatMasker (https://www.repeatmasker.org) to identify transcripts initiating from TE sequences. Transcripts then were intersected with GENCODE v36 gene annotation (Frankish et al. 2021) to determine if the TE-derived transcription was associated with any annotated gene sequences. Transcripts initiated from TE sequence were categorized into the following four groups depending on the associated genes: (1) TE coding gene transcripts, where TEs splice into annotated protein-coding gene transcripts; (2) TE noncoding gene transcript, where TEs splice into annotated noncoding gene transcripts; (3) TE no gene transcripts, where TEs do not splice into any annotated gene sequences, but the transcripts extend or splice to sequence outside of the TE copy that initiate transcription; (4) TE transcripts, where TEs do not splice into any annotated gene sequences, and the full transcripts are within the TE copy that initiate transcription (Supplemental Fig. S1B).
-
Filtering TE-derived transcripts
To mitigate noise in the de novo transcript assembly step, we implemented per-sample-based filters to augment the specificity of TE-derived transcripts discovery: (1) A 0.5 TPM cutoff for multi-exon transcripts. To maximize the specificity in this study, we removed all mono-exonic transcripts; (2) a requirement for more than two reads capturing the splice junction from TE-derived exon to the next downstream exon; (3) a cutoff of 0.5 for ratio between number of reads that capture the splicing events between the first exon of TE-derived transcripts and any upstream sequences and reads capturing the splice junction between the first and second exon of TE-derived transcripts. Ensuring a ratio less than 0.5 will minimize transcripts representing internal, incomplete transcript assemble; (4) to remove transcripts with retained introns, we intersected each exon of TE-derived transcripts with annotated exons on GENCODE v36 gene annotation. Transcripts with any exon that overlaps with three or more annotated exons were excluded. We removed transcripts with retained introns for the following reasons. The first one was technical accuracy. The detection of retained intron can be inaccurate and sometimes results from technical artifacts, such as DNA contamination due to ineffective DNase treatment or the presence of pre-mature mRNA, which was especially true when the long-read and short-read RNA-seq data in this manuscript were generated with total RNA (Broseus and Ritchie 2020). The second reason was biological variation. Intron retention can occur due to various reasons, including mutations at splice motif sites or malfunctioning of the spliceosome (Faustino and Cooper 2003; Scotti and Swanson 2016). Given that the three cancer cell lines we profiled in our study had different alternative splicing landscapes, it was essential to retain only mature, fully processed mRNAs in the reference of TE-derived transcripts to ensure more consistent and comparable results across the three different cancer cell lines; (5) assessment of TE-derived transcripts with exon 1 overlapping with exon 1 of an annotated transcript. We compared the transcription start sites of the TE-derived transcript and the annotated transcript. Only when both TSSs were located within the same TE copy did we keep the transcripts for downstream analysis (Supplemental Fig. S1C).
-
Generating a consensus reference transcriptome
TACO v0.7.3 (Niknafs et al. 2017) was used to create a consensus annotation of TE-derived transcripts that were discovered in each sample. Filters (4) and (5) from step 2 were applied to the consensus TE-derived transcripts.
-
Transcript-level quantification
To determine the expression level of TE-derived transcript, we used StringTie quantification with a customized transcript reference consisting of the GENCODE V36 gene annotation and the consensus annotation of TE-derived transcripts. Duplicated transcripts sharing the same intron chain between GENCODE and the consensus TE-derived transcript annotations were removed from GENCODE.
Only polyexonic transcripts were considered in the downstream analysis. Specific genomic coordinates of each TE loci identified by TEProf3 were used for comparison across assemblies. Raw counts calculated from short-read RNA-seq using the reference generated from long-read RNA-seq were used as input into DESeq2 for transcriptomic analysis. Transcripts that were not present in any of the samples in a cell line were excluded in that cell line's profile.
TE subfamily enrichment analysis in DETs
Each TE subfamily background frequency was calculated as the total length in bases of that subfamily across the whole genome over the entire genome length. Each subfamily's frequency in DETs is calculated as the number of DETs that uses that TE subfamily as a potential promoter. Fisher's exact test was conducted. P-values and odds ratios were extracted to characterize enrichment.
Whole-genome bisulfite sequencing library preparation and data processing
Genome DNA was extracted using the Quick-DNA Microprep kit (Zymo Research, R3020). Sheared DNA fragments were then bisulfite-converted using an EZ DNA Methylation-Gold kit (Zymo, D5005) for subsequent WGBS library construction with an xGen Methyl-Seq DNA Library Prep kit (IDT, 10009860). WGBS libraries were sequenced on Illumina NovaSeq 6000 platform. WGBS analysis followed steps in a previous publication (Russell et al. 2023). Briefly, reads were aligned to the hg38 bisulfite-converted genome using Bismark v0.20.0 (Krueger and Andrews 2011), followed by deduplication using (deduplicate_bismark), and DNA methylation levels were calculated using (bismark_methylation_extractor). DMRs were called using DSS (Park and Wu 2016), v2.43.2 with a two-group comparison via “DMLtest” and “callDMR”.
To calculate average methylation over subfamilies, we filtered out genome regions that do not contain any CpGs. Average methylation over each subfamily was calculated by taking the mean of methylation values over that TE region. TE subfamilies loci that do not contribute to DETs were considered background for that subfamily.
ATAC-seq library preparation and data processing
All ATAC-seq data were generated according to the methods described in our previous publication (Wu et al. 2020). Raw reads were aligned with v0.11.9. Bowtie 2 (Langmead and Salzberg 2012), v2.3.4.1 (bowtie2 ‐‐very-sensitive -p 4 -X 2000). Duplicates were removed using Picard (available online at https://broadinstitute.github.io/picard/), v2.8.1. Low quality and unpaired reads were also removed. MACS2 v2.2.1 (Gaspar 2018) was used to call peaks (macs2 callpeak ‐‐nomodel ‐‐shift 37 ‐‐extsize 73 -B ‐‐keep-dup all). Blacklist peaks were then removed. Biological replicate peak calls were combined using IDR (available online at https://github.com/nboley/idr). IDR peaks and BAM files were input into DiffBind v2.14.0 (https://bioconductor.org/packages/release/bioc/html/DiffBind.html), to identify DARs (abs[Fold] > 1 and FDR < 0.05).
Enrichment of TE subfamily with open chromatin was conducted by annotating each significantly open DAR with TE and then counting each subfamily's frequency. Next, background was created by shuffling genomic regions with the same size and number composition from the DARs for 1000 permutations. Each shuffled background was annotated with RepeatMasker annotation, and the mean of 1000 permutation for each subfamily was calculated as its background frequency. The enrichment for each subfamily was calculated as the ratio of that subfamily's frequency in DARs over that subfamily's frequency in background. Motif enrichment over DARs was carried out using HOMER (findMotifsGenome.pl) (Heinz et al. 2010).
ChIP-seq library construction, sequencing, and data processing
HCT116, A549, and RKO cells were crosslinked in 1% formaldehyde in PBS at room temperature for 15 min; the fixation was stopped with glycine at room temperature for 5 min. Fixed cells were washed once using PBS, and cell pellets were stored at −80°C before use. TP53 ChIP-seq was performed using the iDeal ChIP-seq kit for Transcription Factors (Diagenode, C01010055) and 1 µg TP53 antibody (Diagenode, C15410083) for each IP of 5 million cells. The chromatin was sheared for 10 min at 4°C under the condition of 30 sec on and 30 sec off using a Bioruptor sonicator. The de-crosslinking DNA was used for sequencing library preparation with an Ultra II DNA Library Prep kit (NEB, E7645) following the manufacturer's instructions. Paired-end ChIP-seq libraries were sequenced on an Element AVITI machine.
Raw reads were aligned with Bowtie 2 (Langmead and Salzberg 2012) v2.3.4.1 (bowtie2 ‐‐very-sensitive-local ‐‐no-unal ‐‐no-mixed ‐‐no-discordant ‐‐phred33 -I 10 -X 700). Duplicates were removed using Picard (available online at https://broadinstitute.github.io/picard/), v2.8.1. Low quality and unpaired reads were also removed. MACS2 v2.2.1 (Gaspar 2018) was used to call peaks (macs2 callpeak -f BAMPE -q 0.01 ‐‐keep-dup all). Blacklist peaks were then removed.
Motif enrichment
Motif enrichment over DET promoter regions (TSS ± 0.5 kb) was carried out using HOMER (findMotifsGenome.pl) (Heinz et al. 2010). Promoter sequences were scanned for known motifs in the HOCOMOCO database (HOCOMOCOv11_core_HUMAN_mono_meme_format.meme) via FIMO (Grant et al. 2011) MEME Suite, v.5.4.1. Tier One TE-derived transcripts that were not differentially expressed were used as background transcripts. Motif analysis for each TE subfamily was done with AME (McLeay and Bailey 2010) MEME suite, v.5.4.1 with shuffled sequences as background.
Read alignment quality evaluation
We focused on ATAC-seq data and tried to investigate the relationship between alignment quality and the age of the associated subfamily of each read. Reads were aligned to the reference genome (hg38) before performing the analysis for quality check. The mapping quality metrics used for the analysis were the commonly used mapping quality score generated by Bismark/Bowtie 2 (Krueger and Andrews 2011; Langmead and Salzberg 2012). The putative age (divergence to the consensus sequence) was calculated based on the number of substitutions in each copy compared to the consensus sequences following a previous study (Choudhary et al. 2020). We used this substitution rate as an estimation of age for each copy, followed by benchmarking (Khan et al. 2006).
Single nucleotide variant (SNV) identification
We performed genetic variant calling utilizing the whole-genome bisulfite sequencing data, which is a shotgun DNA sequencing method that can provide the information of genetic variants like whole-genome sequencing (WGS) except for CpG sites. We used BISCUIT to call SNVs against hg38 and compared SNVs found in each sample (Zhou et al. 2024). In each comparison, we only considered SNVs that have coverage over 20× in both samples to minimize the false negative identification of SNVs due to insufficient sequencing depth. We used allele frequency of 0.3 to have a more stringent and confident identification of SNVs.
Software availability
Source code used to perform analysis presented in this study has been compiled and submitted as Supplemental Code. Source code of TE promoter finder 3 (TEProf3) can also be found at GitHub (https://github.com/Yonghao-Holden/TEProf3).
Data access
All raw and processed sequencing data generated in this study have been submitted to the NCBI Gene Expression Omnibus (GEO; https://www.ncbi.nlm.nih.gov/geo/) under the accession numbers GSE262051, GSE262052, GSE262053, and GSE262054. The RNA-seq data generated in this study have been submitted to the NCBI BioProject database (https://www.ncbi.nlm.nih.gov/bioproject/) under the accession number PRJNA1090549.
Competing interest statement
The authors declare no competing interests.
Acknowledgments
We thank Z. Andrysik and J.M. Espinosa from the Department of Pharmacology, University of Colorado Anschutz Medical Campus, Aurora, CO for the generous gift of the TP53-KO HCT116 cell line. We thank all the Ting Wang laboratory members for the insightful discussion. X.Q., Y.L., X.X., H.S., and T.W. are supported by National Institutes of Health grants R01HG007175, R01AG078958, U24NS132103, and U01HG013227. X.Q. is also supported by Roy and Diana Vagelos Division of Biology and Biomedical Sciences International Student Fellowship at Washington University in the St. Louis School of Medicine.
Author contributions: X.Q., Y.L., and T.W. conceived and implemented the study; X.Q., Y.L., C.M., C.T., C.F., E.A.B., and J.F.M.-V. contributed to the computational analysis; X.Q., X.X., and H.S. generated the epigenetic and transcriptomic profiles of the cell lines; and X.Q., Y.L., C.M., and T.W. prepared and revised the manuscript with input from all authors.
Footnotes
-
[Supplemental material is available for this article.]
-
Article published online before print. Article, supplemental material, and publication date are at https://www.genome.org/cgi/doi/10.1101/gr.279398.124.
-
Freely available online through the Genome Research Open Access option.
- Received March 23, 2024.
- Accepted April 4, 2025.
This article, published in Genome Research, is available under a Creative Commons License (Attribution-NonCommercial 4.0 International), as described at http://creativecommons.org/licenses/by-nc/4.0/.


