
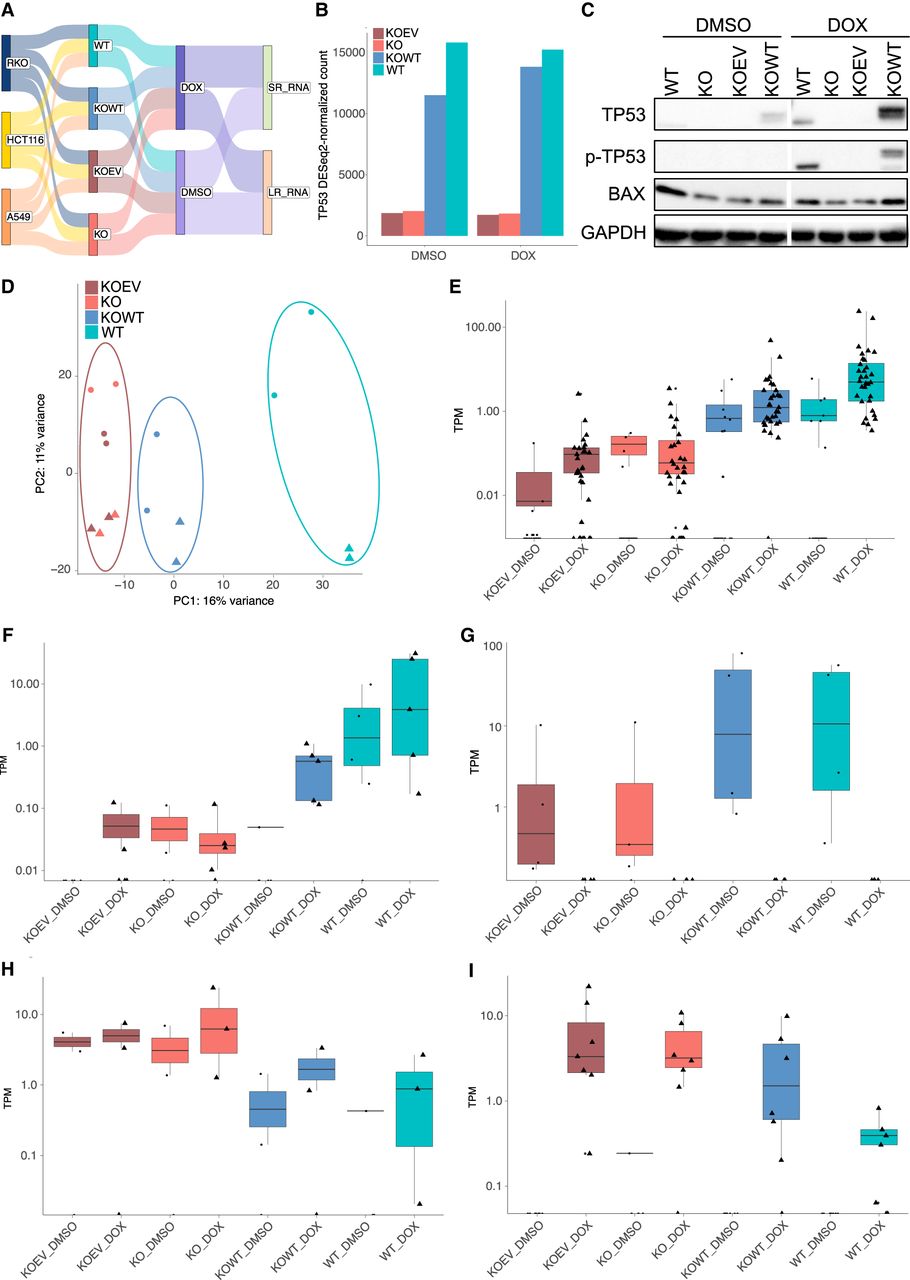
Short-term restoration of WT TP53 partially recovers parental DET profile. (A) Schematics of experiment design in this section. (B) Expression level of TP53 in WT, KO, KOWT, and KOEV cells in DMSO and doxorubicin (DOX) conditions. Data shown here is from HCT116. (C) Protein expression level of TP53, phosphorylated TP53, and BAX in WT, KO, KOWT, and KOEV cells in DMSO and DOX. Data shown here are from HCT116. (D) Principal component analysis using expression information of Tier One TE-derived transcripts. (E–I) Different patterns of DET expression in response to TP53 genetic and activation status. TPM for each transcript in each cell line are plotted. All three cell lines are included in each plot.


