
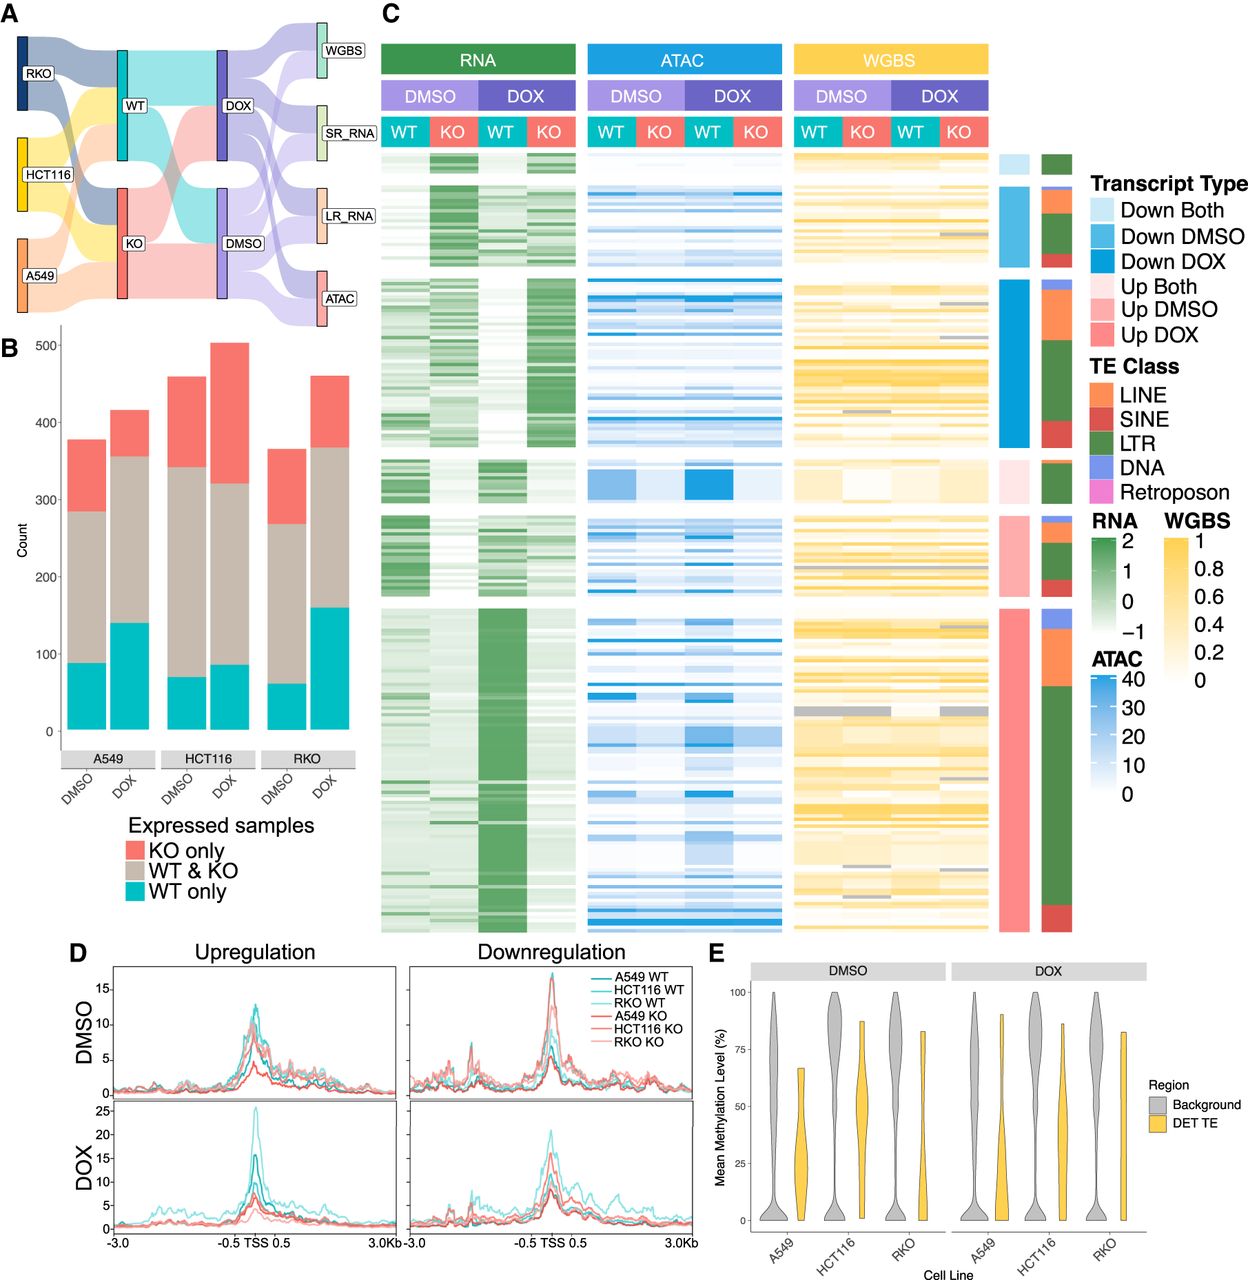
Doxorubicin-induced TP53 activation augments TE-derived transcription events. (A) Schematics of differential expression analysis setup for investigating TE-derived transcripts expression in WT and KO cells under control and TP53-activation. (B) Number of TE-derived transcripts with TPM > 1 that are present only in WT cells, only in KO cells, or in both WT and KO cells under control (DMSO)- or doxorubicin-treated conditions. Updated Tier One reference is created from both DMSO- and DOX-treated WT and KO cells across three cell lines. (C) Heat map showing the expression profile (z-score of TPM), chromatin accessibility (RPKM of area under the peak at promoter region [TSS ± 0.5 kb]), and DNA methylation (mean methylation level at promoter region [TSS ± 0.5 kb]) for differentially expressed transcripts (P-value < 0.05, abs(log2FC) > 2) in A549. Differential expression analysis was set up to compare WT versus KO in each condition. Differentially expressed transcripts (DETs) were grouped into up- or downregulated only in DMSO or DOX, and up- or downregulated in both DMSO and DOX. DETs were further subgrouped by TE class. (D) Profiles of ATAC-seq normalized density around TSS ± 3 kb for upregulated DETs and downregulated DETs in DMSO or DOX. (E) Mean methylation levels for TE loci that drive DETs and background TE loci, grouped by condition. TE subfamilies were filtered for those that contain at least 10 CpG islands, and each TE locus was filtered for those that contain at least one CpG island. DOX, doxorubicin.


