
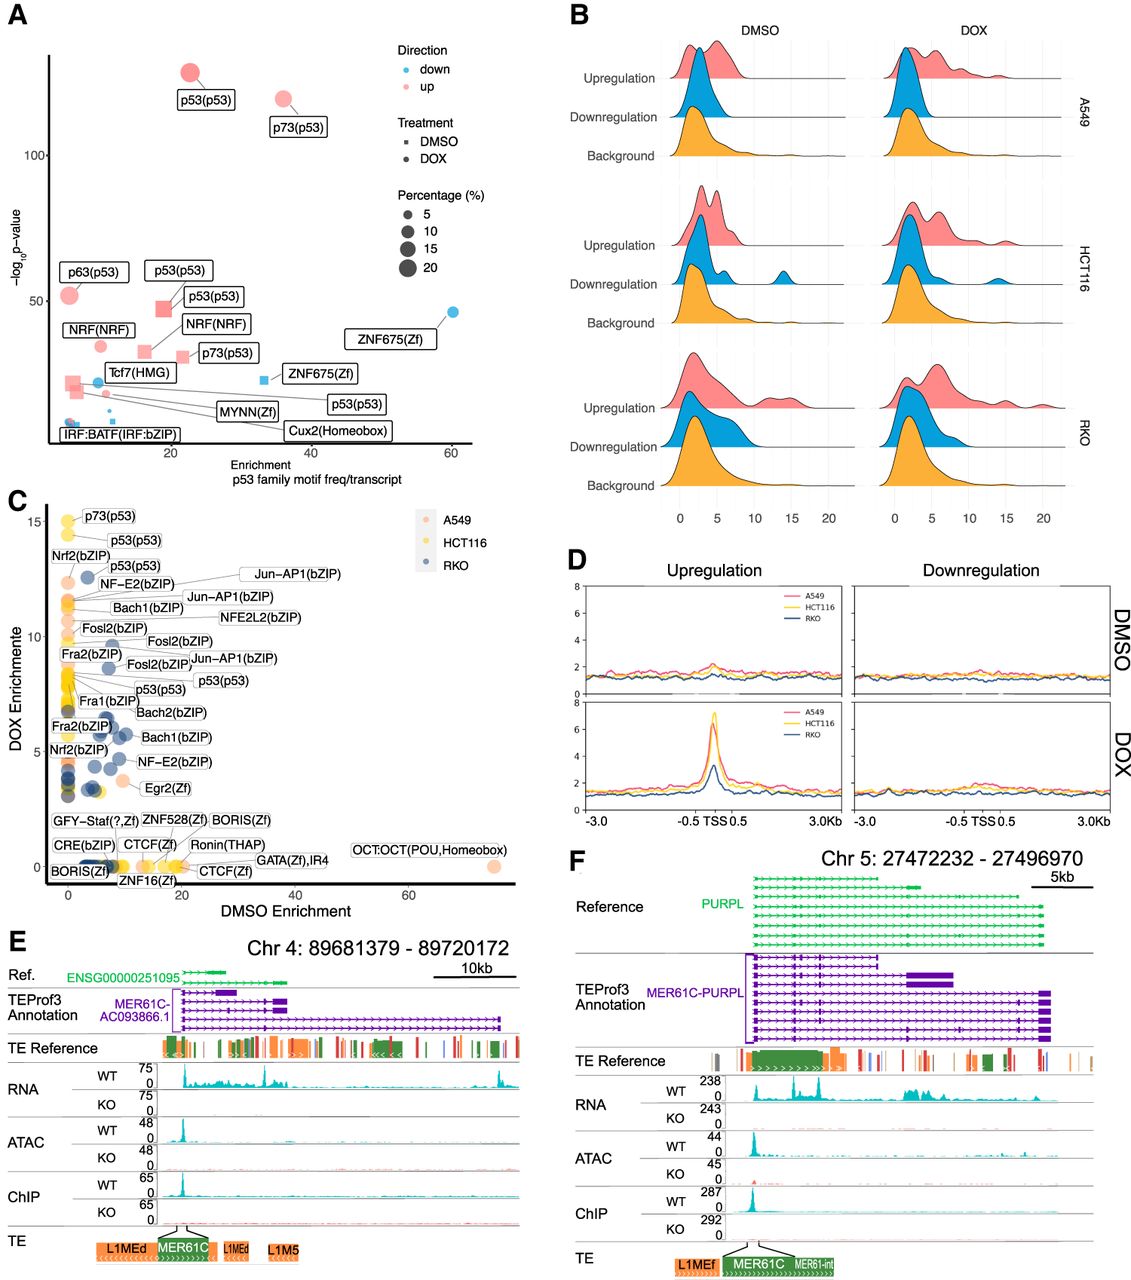
TP53 – TE network is dictated by TP53 binding motifs. (A) HOMER motif enrichment over promoter regions of DETs. WT versus KO DETs from three cell lines were merged together to single sets of transcripts that are either upregulated or downregulated in response to TP53 in either DMSO or doxorubicin (DOX) condition. Pink indicates upregulated DETs and blue indicates downregulated DETs. Square indicates control condition, and circle indicates doxorubicin treatment condition. Size of each shape is proportional to percent presence of this motif in its sample group. Top motif matrices are listed on the right. (B) Density plot of TP53 transcription factor family motif frequency in either upregulated or downregulated transcripts or background TE-derived transcripts that are not differentially expressed. (C) HOMER motif enrichment over open DARs in either control or doxorubicin treatment condition for each cell line. (D) TP53 ChIP-seq occupancy over upregulated or downregulated DET TSS ± 3 kb depicted as average TP53 binding score profile in three cell lines under control and doxorubicin treatment. (E,F) WashU Epigenome Browser of TE-derived transcript MER61C-AC093866.1 in HCT116 (E) and MER61C-PURPL in A549 (F) with bigWig tracks for WT and KO under doxorubicin treatment of SR-RNA-seq, ATAC-seq, and ChIP-seq.


