
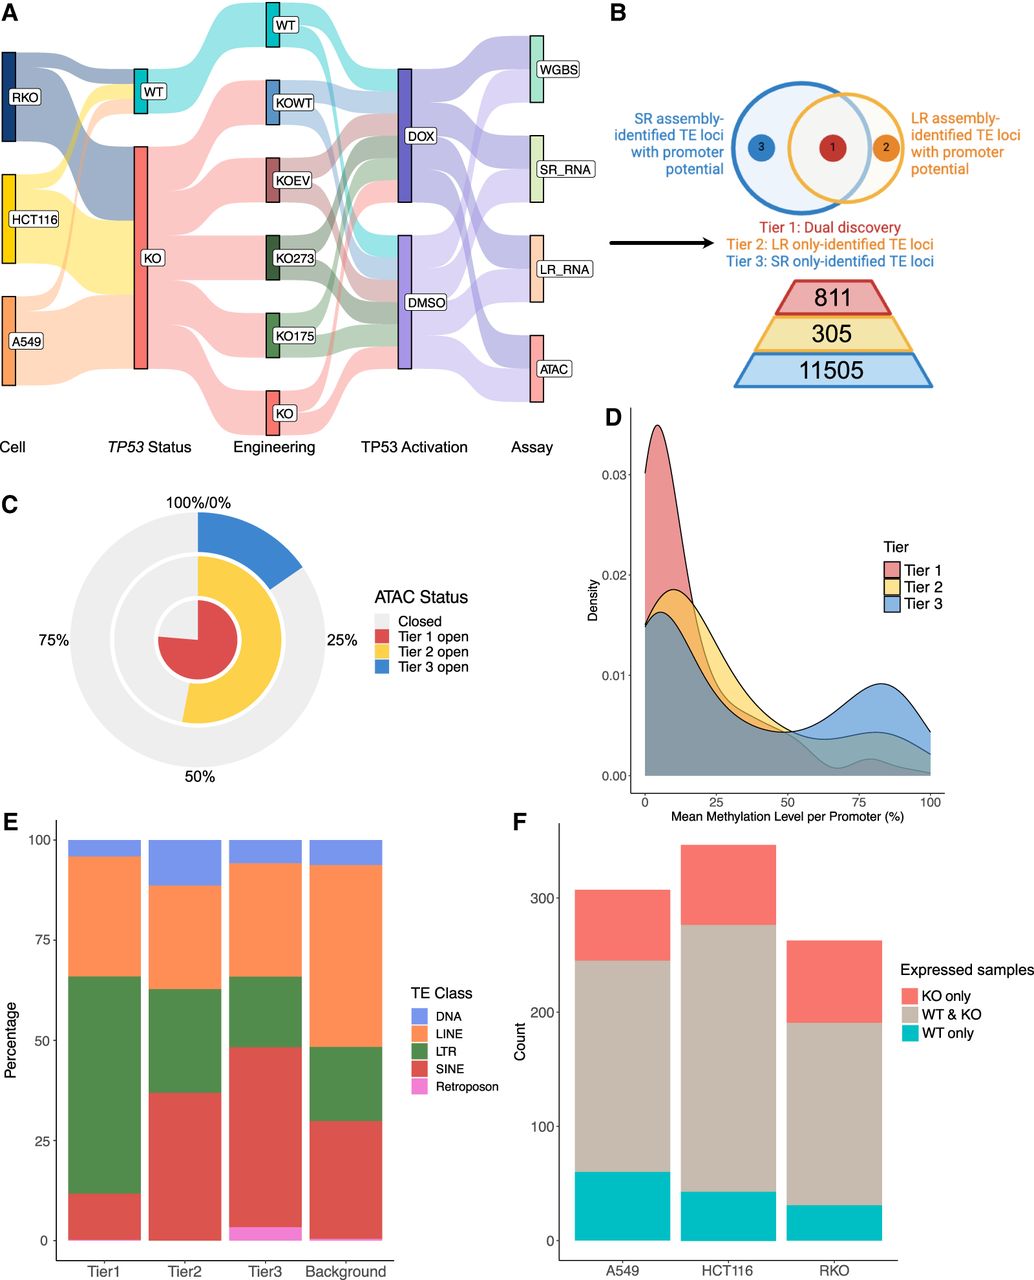
LR-RNA-seq and SR-RNA-seq identify TE loci with promoter potential. (A) Schematics of experiment design. (B) Schematics showing definition and count for three tiers of TE-derived transcripts identified across three cancer cell lines, with or without WT TP53, under DMSO treatment. (C) Percentage of TE-derived promoters (TSS ± 500 bp) that overlap with open chromatin signal from ATAC-seq across three tiers of TE-derived transcripts. (D) Density plot of average DNA methylation level over promoter region (TSS ± 0.5 kb) of TE-derived transcripts across three tiers of TE-derived transcripts. (E) Distribution of the associated TE class of each TE-derived transcript in each tier of identified TE-derived transcripts. (F) Count of TE-derived transcripts with TPM > 1 identified in cells with different TP53 genetic status.


