
Abstract
Deep learning models can accurately reconstruct genome-wide epigenetic tracks from the reference genome sequence alone. But it is unclear what predictive power they have on sequence diverging from the reference, such as disease- and trait-associated variants or engineered sequences. Recent work has applied synthetic regulatory genomics to characterized dozens of deletions, inversions, and rearrangements of DNase I hypersensitive sites (DHSs). Here, we use the state-of-the-art model Enformer to predict DNA accessibility and RNA transcription across these engineered sequences when delivered at their endogenous loci. At a high level, we observe a good correlation between accessibility predicted by Enformer and experimental data. But model performance is best for sequences that more resembled the reference, such as single deletions or combinations of multiple DHSs. Predictive power is poorer for rearrangements affecting DHS order or orientation. We use these data to fine-tune Enformer, yielding significant reduction in prediction error. We show that this fine-tuning retains strong predictive performance for other tracks. Our results show that current deep learning models perform poorly when presented with novel sequences diverging in certain critical features from their training set. Thus, an iterative approach incorporating profiling of synthetic constructs can improve model generalizability and ultimately enable functional classification of regulatory variants identified by population studies.
Most genetic associations with human diseases and traits lie within noncoding regulatory DNA (Maurano et al. 2012). Genome-scale methods to analyze the function of noncoding regulatory elements within their relevant context would improve our ability for direct assessment of disease-associated variation. Profiling of allelic transcription factor (TF) activity across multiple cell and tissue types has shown that both genomic and tissue contexts modulate the penetrance of noncoding variants (Halow et al. 2021), but direct biochemical assessment of each variant in every relevant cell type and state remains impractical.
An alternative approach is to train machine learning models on reference genomic sequence and then apply them to genetic variation data. Recent machine learning models including gkmSVM (Lee et al. 2015), DeepSEA (Zhou and Troyanskaya 2015), Enformer (Avsec et al. 2021a), and BPNet (Avsec et al. 2021b) have demonstrated impressive performance in predicting functional genomic signals such as expression and DNA accessibility from sequence alone. Those models were trained on large functional genomic data sets (e.g., DNase-seq or CAGE) across a wide variety of human and mouse cell and tissue types generated by large projects such as ENCODE (Meuleman et al. 2020; The ENCODE Project Consortium et al. 2020), the Roadmap Epigenomics Mapping Project (Roadmap Epigenomics Consortium et al. 2015), and FANTOM (The FANTOM Consortium and the Riken PMI and CLST (DGT) et al. 2014). Analysis of current models on inter-individual genetic variation data has yielded little improvement relative to more parsimonious approaches (Maurano et al. 2015; Dey et al. 2020; Toneyan et al. 2022; Huang et al. 2023; Karollus et al. 2023; Sasse et al. 2023). The opacity of the more complex models reduces their contribution to mechanistic understanding and could mask overfitting, resulting in degraded performance under new circumstances. Furthermore, training sequence is universally drawn from the human or mouse reference genomes, whose genomic features can be highly correlated, particularly for long-range interactions (Xi and Beer 2018; Whalen and Pollard 2019). Such an approach limits the explored sequence space owing to constraints imposed by evolution and could reduce model performance on mutations and engineered sequences diverging significantly from reference. In principle, genomic sequences from different species (Kelley 2020; Cochran et al. 2022) or random sequence (de Boer and Taipale 2024) could expand the sequence space for training. Thus, the problem remains how to generate sufficient functional data to reflect function at the endogenous genomic locus.
Sources of training data beyond the reference sequence are limited by the scale of sequence amenable to manipulation, as well as its relevance to the regulation architecture of the endogenous locus. Massively parallel reporter assays (MPRAs) transiently transfected plasmids or randomly integrated sequences with little genomic context and thus cannot accurately model the effect of surrounding regulatory sites at the endogenous locus (Kircher et al. 2019; Kosicki et al. 2025). Large-scale CRISPR-Cas-based genome engineering strategies including saturation genomic editing overcome the inability of MPRAs to reproduce accurate genomic context (Findlay et al. 2014; Martyn et al. 2025). However, each CRISPR guide provides control over a limited genomic range (100–1000 bp). Thus, these approaches are more suited to the deletion of existing sequence than its rearrangement or the addition of novel sequence and are difficult to use for multistep engineering of diploid cells. Training on allelic variation in expression (Sasse et al. 2023), chromatin accessibility (Maurano et al. 2015; Halow et al. 2021), or genome-wide association study variants (Mostafavi et al. 2023) are limited by the standing genetic variation and the effects of selection. A synthetic regulatory genomic approach is uniquely able to uncover novel biology, and these new technologies will move the field toward consideration of regulatory function at a locus scale.
Recent work applying synthetic regulatory genomics has highlighted the influence of genomic context on enhancer function (Ribeiro-Dos-Santos et al. 2022; Brosh et al. 2023), as well as the discrepancy between reporter assays and function at the endogenous locus (Brosh et al. 2023). The Big-IN platform enables targeted integration of large BACs upward of 160 kb into human and murine embryonic stem cells, overcoming previous limitations of scalability and portability across genomic loci and cellular contexts (Brosh et al. 2021). Integration of a modular landing pad (LP) enables subsequent recombinase-mediated cassette exchange (RMCE) of large payloads and efficient positive/negative selection for correct clones. Hundreds of different payloads have been delivered to these cell lines at multiple loci (Brosh et al. 2021, 2023; Mitchell et al. 2021; Pinglay et al. 2022; Zhang et al. 2023; Ordoñez et al. 2024). Compared with editing methods such as saturation genome editing, synthetic regulatory genomics is not limited to derivatization of the reference sequence but can deliver a nearly unlimited set of sequences.
Here, we explore the application of deep learning models to predict regulatory features at loci engineered through synthetic regulatory genomics. We evaluate the ability of these models to predict the functional behavior of regulatory elements when subject to complex deletions and rearrangements. Further, we evaluate the model prediction of functional genomics for novel synthetic sequences and long-range regulatory element interaction. Finally, we demonstrate the potential design for iterative improvement of such models by integrating synthetic regulatory data set. Our work suggests a key role for synthetic regulatory genomics in training future genomic deep learning models.
Results
Enformer performance predicting synthetic payloads
To probe the varied performance of deep learning models across different regimes, we analyzed the Enformer model owing to its high accuracy and wide receptive field that allows investigation of large regulatory landscapes (Avsec et al. 2021a). Based on previous work showing that Enformer retains most of its predictive performance with shorter input windows (Karollus et al. 2023), we adapted the published Enformer model to use flexible input and output lengths to enable capturing relevant regulatory elements while maintaining high computational efficiency, as well as outputting predictions for large synthetic payloads (Methods). We confirmed the adapted model produces nearly identical results to the published version, including at different input window sizes (Supplemental Figs. S1, S2).
We then evaluated the predictive power of Enformer on synthetic sequences related to the reference genome but differing in significant aspects. We started with a published analysis that dissected the Sox2 locus in mouse embryonic stem cells (mESCs) (Brosh et al. 2023). Eighty synthetic payloads were delivered, replacing either the full 143 kb locus or 43 kb locus control region (LCR) required for Sox2 expression in mESCs, and included multiple categories of variation, such as deletions, duplications, rearrangements, inversions, and surgical TF site deletions (Fig. 1A). As the published Enformer model did not include CAGE predictions in mESCs (Avsec et al. 2021a), we trained Enformer on publicly available CAGE data produced at Riken (Methods) (Supplemental Fig. S3). We then predicted transcription at the Sox2 transcription start site (TSS) for the synthetic payloads (Supplemental Fig. S4A). However, comparison with measured expression showed no correlation, and in particular, Enformer did not predict the effect of deleting the LCR, which should result in total ablation of Sox2 expression in mESCs (Li et al. 2014; Zhou et al. 2014). We focused on the 70 payloads delivered replacing the LCR. We predicted DNA accessibility at the LCR for each payload using Enformer and summed the accessibility at the LCR DNase I hypersensitive sites (DHSs) 19–28 as a proxy for the overall LCR activity (Supplemental Tables S1, S2). Predicted LCR accessibility showed a good correlation with experimentally measured Sox2 expression, confirming that accessibility can serve as a good proxy for expression in this context (Fig. 1B).
Assessment of Enformer performance on synthetic sequences. (A) Schematic of Sox2 locus showing DNase-seq in mouse embryonic stem cells (mESCs) and Enformer prediction-engineered CAST/B6 mESCs harbor a Big-IN landing pad (LP) replacing one allele of the Sox2 LCR for delivery of multiple synthetic payloads (Brosh et al. 2023). Locus control region (LCR) is highlighted in gray. DHSs are indicated by blue boxes. DHS deletions are indicated by dashed boxes. (B) Sox2 expression was characterized by allele-specific qRT-PCR. Each point represents experimentally measured Sox2 expression and Enformer prediction of a synthetic payload (N = 70). Engineered Sox2 allele expression was scaled between zero (ΔSox2) and one (WT). LCR activity was measured as the summed accessibility over all LCR (DHSs 19–28) in mESC_CJ7. (C) Schematic of hemoglobin alpha locus showing DNase-seq of mouse fetal liver (mfLiver), Enformer predictions, and hemoglobin alpha locus engineering strategy by CRISPR-Cas9 editing and characterization using qRT-PCR (Blayney et al. 2023). Enhancers R1–R4 are indicated by blue boxes. Deleted regions are represented by dashed boxes. (D) Hba expression of the resulting cells was profiled by qRT-PCR, normalized to Hbb, and scaled as a proportion of WT expression. Each point represents experimentally measured Hba expression and Enformer prediction of an enhancer configuration (N = 17). Hba expression was measured by qRT-PCR, normalized to Hbb, and scaled as a proportion of WT expression. Predicted enhancers (R1–R4) activity was measured as the sum of maximum predicted accessibility at enhancers R1 to R4. Blue lines indicate linear regressions (B,D).
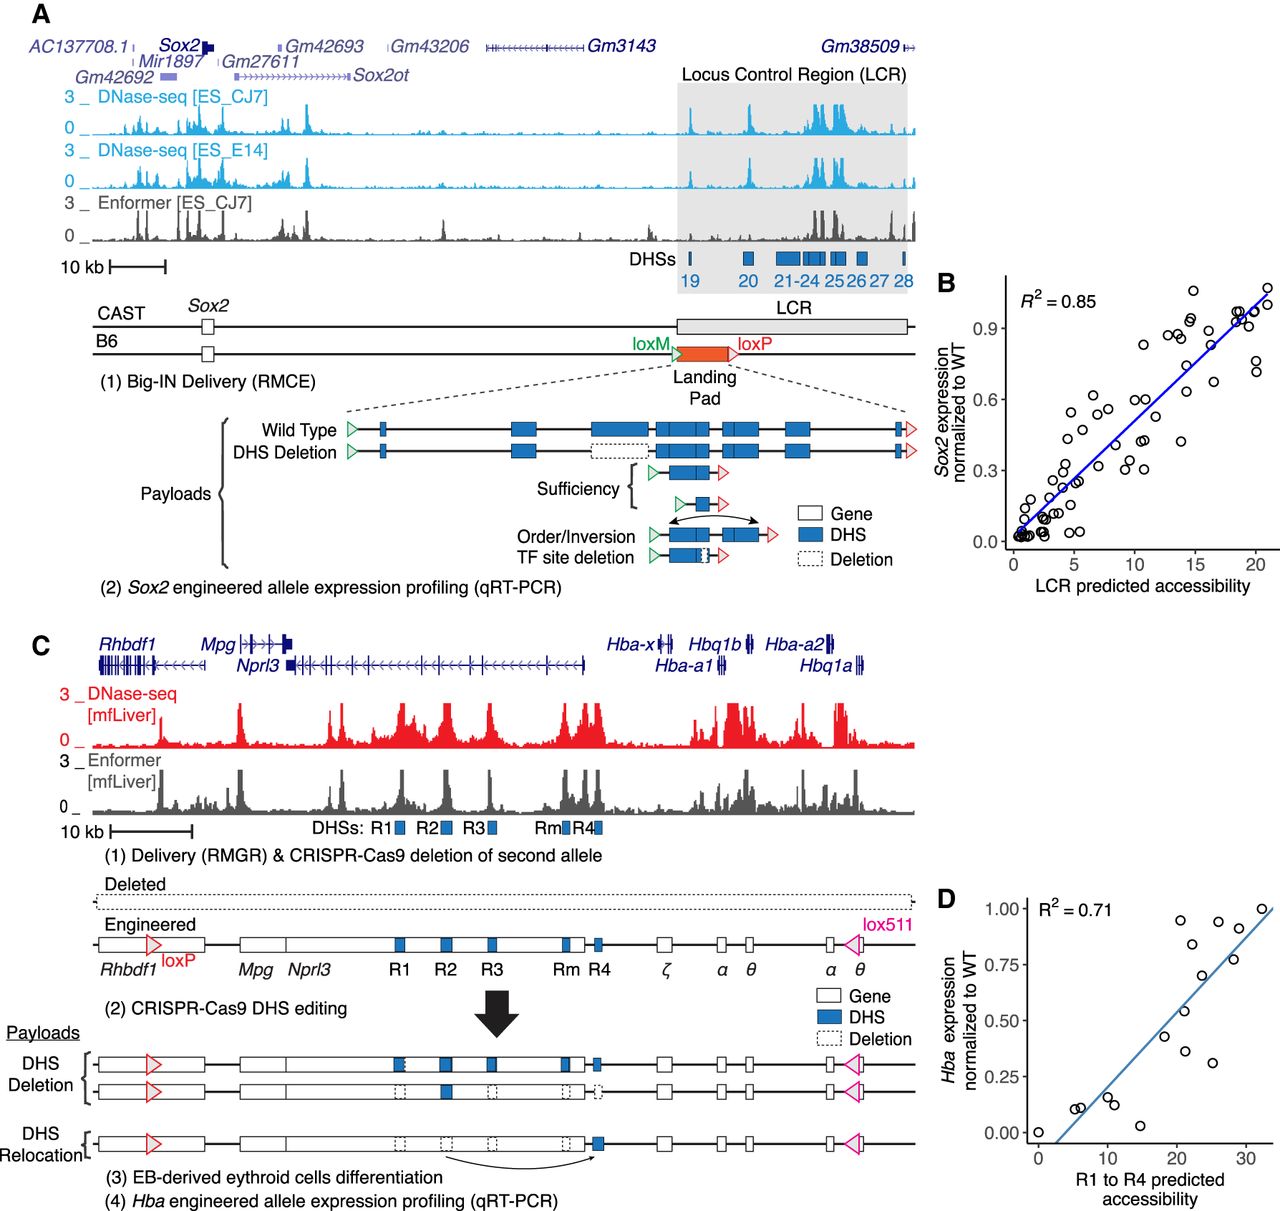
To evaluate our accessibility prediction approach on a different locus and cell type, we analyzed a series of enhancer deletions and relocations at the α-globin locus (Supplemental Table S1) characterized in mouse embryonic body–derived erythroid cells (Fig. 1C; Blayney et al. 2023). Starting in mESCs, one α-globin allele was deleted using CRISPR-Cas9, whereas the other was engineered to support subsequent delivery of engineered hemoglobin alpha (Hba) payloads ranging up to 85 kb through recombinase-mediated genomic replacement (RMGR). Enhancer deletions and relocations were then engineered with CRISPR-Cas9. We verified that Enformer accessibility predictions matched the previously published experimentally measured ATAC-seq tracks (Supplemental Fig. S5). Similarly to the predictions on the Sox2 data set, the sum of predicted accessibility of all five enhancers (Supplemental Table S2) presented a good correlation to experimentally measured Hba expression (Fig. 1D).
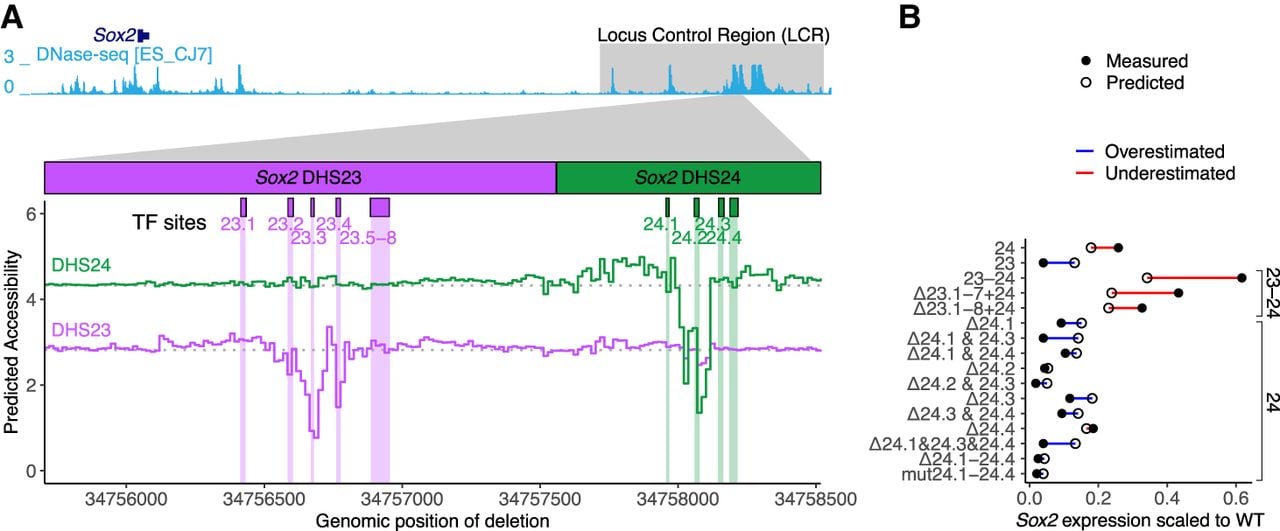
We then investigated predictive performance for individual TF recognition sequences identified within Sox2 LCR DHSs 23–24 (Brosh et al. 2023). We used Enformer to perform an in silico scanning deletion analysis of those DHSs replacing 16 bp with N's (Fig. 2A). The accessibility predictions correctly identified two regions identified as essential in the experimental analysis. However, Enformer completely missed a key cluster of TF recognition sequences (TF sites 23.5–23.8) (Fig. 2A), which experimental deletion analysis showed to be essential (Brosh et al. 2023). Furthermore, published analysis has shown that DHSs 23 and 24 have positive synergy, in that the activity of one DHS is greatly increased by the presence of another DHS in superadditive fashion (Brosh et al. 2023). Enformer predicted no synergy between DHSs 23 and 24 as deletions in one DHS were predicted to have no effect on accessibility of the neighboring DHS (Fig. 2A). We compared Enformer predictions to specific payloads harboring single and multiple TF site deletions or mutations within DHSs 23 and 24. Although Enformer predicted the activity payloads with fully disabling deletions, its worst prediction was for the DHS23–DHS24 pair, and it overestimated the activity of medium-effect TF site deletions (Fig. 2B), suggesting it had difficulty quantitatively predicting the relationship between multiple TF sites. Finally, the CAGE model failed to predict an effect for any deletions (Supplemental Fig. S4B). Thus, although deep learning models can recapitulate gross features of synthetic sequences derived from genomic reference sequence, their performance has gaps, most notably the synergy among neighboring regulatory elements.
Enformer poorly models individual TF recognition site deletions. (A) In silico scanning deletion analysis of Sox2 DHS23 and DHS24 accessibility. Enformer was used to predict accessibility (mESC_CJ7 DNase-seq) for a series of DHS23–DHS24 virtual payloads replacing the Sox2 LCR. Sixteen basepair deletions were encoded by replacing the payload sequence with N's sliding across the length of DHS23 and DHS24. Colored lines indicate the DHS accessibility for each deletion location (x-axis). Shown are DHS23 and DHS24 accessibility according to deletion position represented by the purple and green lines, respectively. Horizontal dotted lines indicate baseline accessibility. Boxes above indicate relevant TF recognition sequences. (B) Comparison of experimentally measured and predicted accessibility at payloads including DHSs 23 and/or 24 with TF recognition sequences deleted (Δ) or mutated (mut), delivered in place of the Sox2 LCR, and profiled for expression (Brosh et al. 2023). Difference between measured (closed circle) and predicted (open circle) accessibility is shown by a line and colored by direction of difference. Predicted expression was scaled to WT using a linear regression fitted to all payload examples in Figure 1B.
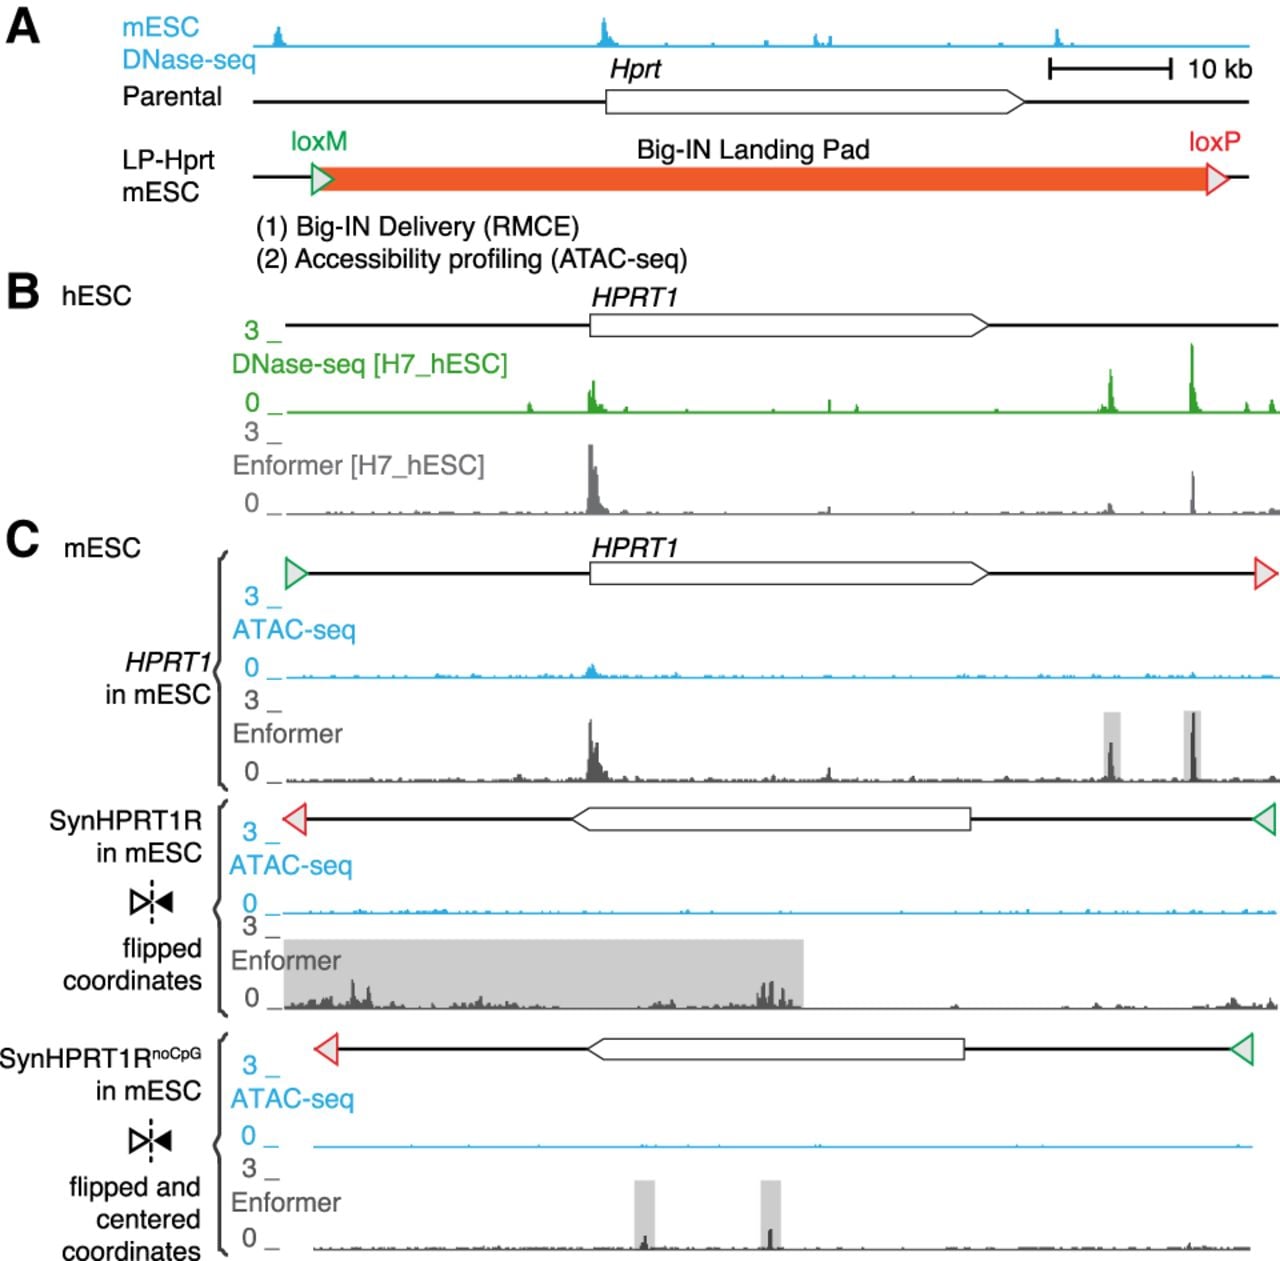
Finally, to explore performance of deep learning models on sequences even further diverged from the reference genome, we investigated a synthetic “backward” sequence in which the HPRT1 gene sequence was reversed but not complemented (Camellato et al. 2024). This synthetic sequence shares many features with the native HPRT1 (e.g., base composition, homopolymer runs, and other short repeats) but disrupts higher-order features such as coding sequence and TF recognition sites (except palindromes). mESCs were engineered to replace the endogenous mouse Hprt1 locus with three synthetic payloads ranging from 95 kb to 101 kb (Fig. 3A): (1) HPRT1 containing the native human sequence, (2) SynHPRT1R containing its reversed but not complemented sequence, and (3) SynHPRT1RnoCpG wherein all CpG sites were removed (Supplemental Table S1). For the HPRT1 payload in native hESCs, Enformer correctly predicted activity at two experimentally observed DHSs (Fig. 3B). We then compared Enformer predictions to experimentally measured DNA accessibility (ATAC-seq) in mESCs for all three payloads (Fig. 3C). The HPRT1 payload only showed accessibility by ATAC-seq at the gene promoter, and both the reversed payloads (SynHPRT1R and SynHPRT1RnoCpG) showed no accessibility at all. In comparison, Enformer predicted false-positive peaks in both HPRT1 and SynHPRT1RnoCpG payloads, and it predicted above background accessibility throughout SynHPRT1R (Fig. 3C). The false-positive peaks in HPRT1 corresponded to peaks observed in the experimental data for hESCs but not mESCs, suggesting that the same sequence behaves differently in the two cellular contexts and that the Enformer predictions do not accurately reflect the mESC trans-regulatory environment. These SynHPRT1R false positives might be related to sequence CpG content, because they were absent in SynHPRT1RnoCpG. These results reinforce model limitations when assessing novel synthetic sequences.
Limited predictive performance on novel synthetic sequences. (A) Schematic of mouse Hprt1 locus and synthetic payload profiling strategy (Camellato et al. 2024). mESC DNase-seq is shown at top. mESCs were engineered to replace their Hprt1 locus with Big-IN LP, which was used to deliver three synthetic payloads: human HPRT1 locus, SynHPRT1R (reversed but not complemented human HPRT1 locus), and SynHPRT1RnoCpG (SynHPRT1R with all CpG removed) payloads. Engineered cells were characterized by ATAC-seq. (B) Schematic of human HPRT1 locus. Shown is DNase-seq of human H7_hESC and corresponding Enformer prediction. (C) ATAC-seq and Enformer accessibility predictions for engineered mESCs. Shown synthetic payloads (HPRT1, SynHPRT1R, and SynHPRT1RnoCpG) profiled and predicted accessibility. Schematics of each synthetic payload are shown above the accessibility tracks. Reversed payloads (SynHPRT1R and SynHPRT1RnoCpG) are flipped horizontally, and SynHPRT1RnoCpG was centered to match HPRT1 coordinates. Enformer false-positive predictions are highlighted in gray.
Enformer does not accurately model distal promoter–enhancer regulation
Previous reports have shown that activation of Sox2 by its LCR decreases with enhancer-gene distance (Zuin et al. 2022). We tested whether Enformer was able to replicate the LCR-Sox2 distance-dependence curve by simulating placement of the Sox2 LCR at 10 kb intervals both downstream from and upstream of the Sox2 promoter. For each placement, we predicted the mESC CAGE at the Sox2 promoter and DNase-seq signal at the promoter and LCR (Fig. 4A). We found that predicted accessibility remained mostly unchanged and was independent of enhancer-gene distance (Fig. 4B; Supplemental Fig. S6). To evaluate the impact of genomic distances in a different sequence context, we flanked the Sox2 proximal region with two copies of SynHPRT1RnoCpG (upstream and downstream) and again evaluated the impact of inserting the whole Sox2 LCR at 10 kb intervals (Fig. 4C). This experiment yielded similar results, in that Enformer did not predict a significant distance effect (Fig. 4D). In contrast to predictions at the endogenous locus, the presence of the LCR at any position in SynHPRT1RnoCpG was predicted to increase Sox2 promoter accessibility above the ΔLCR background. Thus, Enformer incorrectly predicts no effect of distance between the Sox2 promoter and LCR, inconsistent with the experimental data. This is consistent with other reports that existing transformer models do not effectively model long-range interactions despite their wide receptive fields (Karollus et al. 2023).
Enformer does not predict effect of LCR relocation on Sox2 accessibility or expression. (A,C) Schematics of relocation simulation of the Sox2 LCR in 10 kb intervals surrounding the promoter in its endogenous locus (A) or neutral synthetic sequence (SynHPRT1RnoCpG; C). Red rectangles indicate Sox2 promoter; blue rectangles, LCR DHSs 19–28. (B,D) Enformer predictions for a 249.6 kb window encompassing the whole virtual locus, and any remaining space was filled with N's. Each point represents predicted accessibility of Sox2 promoter (top) or LCR (middle) or promoter CAGE signal (bottom) for a given distance between Sox2 TSS and LCR. Promoter CAGE signal and accessibility were measured as the site maximum predicted signal; LCR accessibility, as the sum of DHSs 19–28 maximum predicted signal. The vertical black dotted line indicates the endogenous LCR distance to TSS. Horizontal dotted blue lines indicate prediction when LCR was replaced by a SynHPRT1RnoCpG fragment of the same size. Solid blue lines show LOESS fits.

High-level Enformer predictions depend on background sequence properties
This lack of distance dependence contrasts with a prior report that Enformer predicts a key role for enhancer–promoter distance (Toneyan and Koo 2024). To explore this apparent inconsistency, we reproduced the effect of the position of their 74 candidate enhancers on CAGE signal at their target promoter in K562 cells. We built a virtual sequence for each enhancer–promoter pair by extracting a 196,608 bp window centered at the targeted gene TSS from the human reference genome. We randomly shuffled dinucleotides within the targeted region sequence and restored the TSS block (defined as the central 5 kb region). We then generated a series of virtual sequences by inserting the candidate enhancer in 10 kb intervals from the TSS. The TSS CAGE signal was measured for each TSS–enhancer position by averaging the signal of 10 random dinucleotide shuffles. Consistent with the published analysis, all promoter–enhancer pairs showed a steep reduction of CAGE signal with increasing TSS–enhancer distance (Supplemental Fig. S7A).
We reasoned that the contrast with the Sox2 distance analysis might be related to the choice of background sequences. Thus, we repeated the experiment using 10 randomly generated background sequences based on the dinucleotide content of SynHPRT1RnoCpG. In this context, we observed a selective distance response on TSS CAGE signal, with many DHS relocations producing little to no impact on TSS CAGE signal (Supplemental Fig. S7B). We confirmed all promoter/enhancer pairs were still expressed in this background (Supplemental Fig. S7C). Thus, we observed completely different responses depending on the sequence context. To more specifically attribute this context dependence to sequence features, we investigated the nucleotide composition at the endogenous loci used. We found that sites with G+C content <47% showed the same distance dependence regardless of context, whereas the sequences that differed when tested in SynHPRT1RnoCpG all had G+C ≥47% (Supplemental Fig. S7D). Notably, the human and mouse reference genomes, as well as SynHPRT1RnoCpG, all had lower G+C (41%, 42%, and 38%, respectively), suggesting the in silico distance dependence is disrupted by a mismatch in nucleotide composition. This highlights the importance of background generation strategy and the impact of key genome sequence parameters such as G+C content on evaluation of model predictions.
Deep learning models struggle to predict cell type–selective DHSs
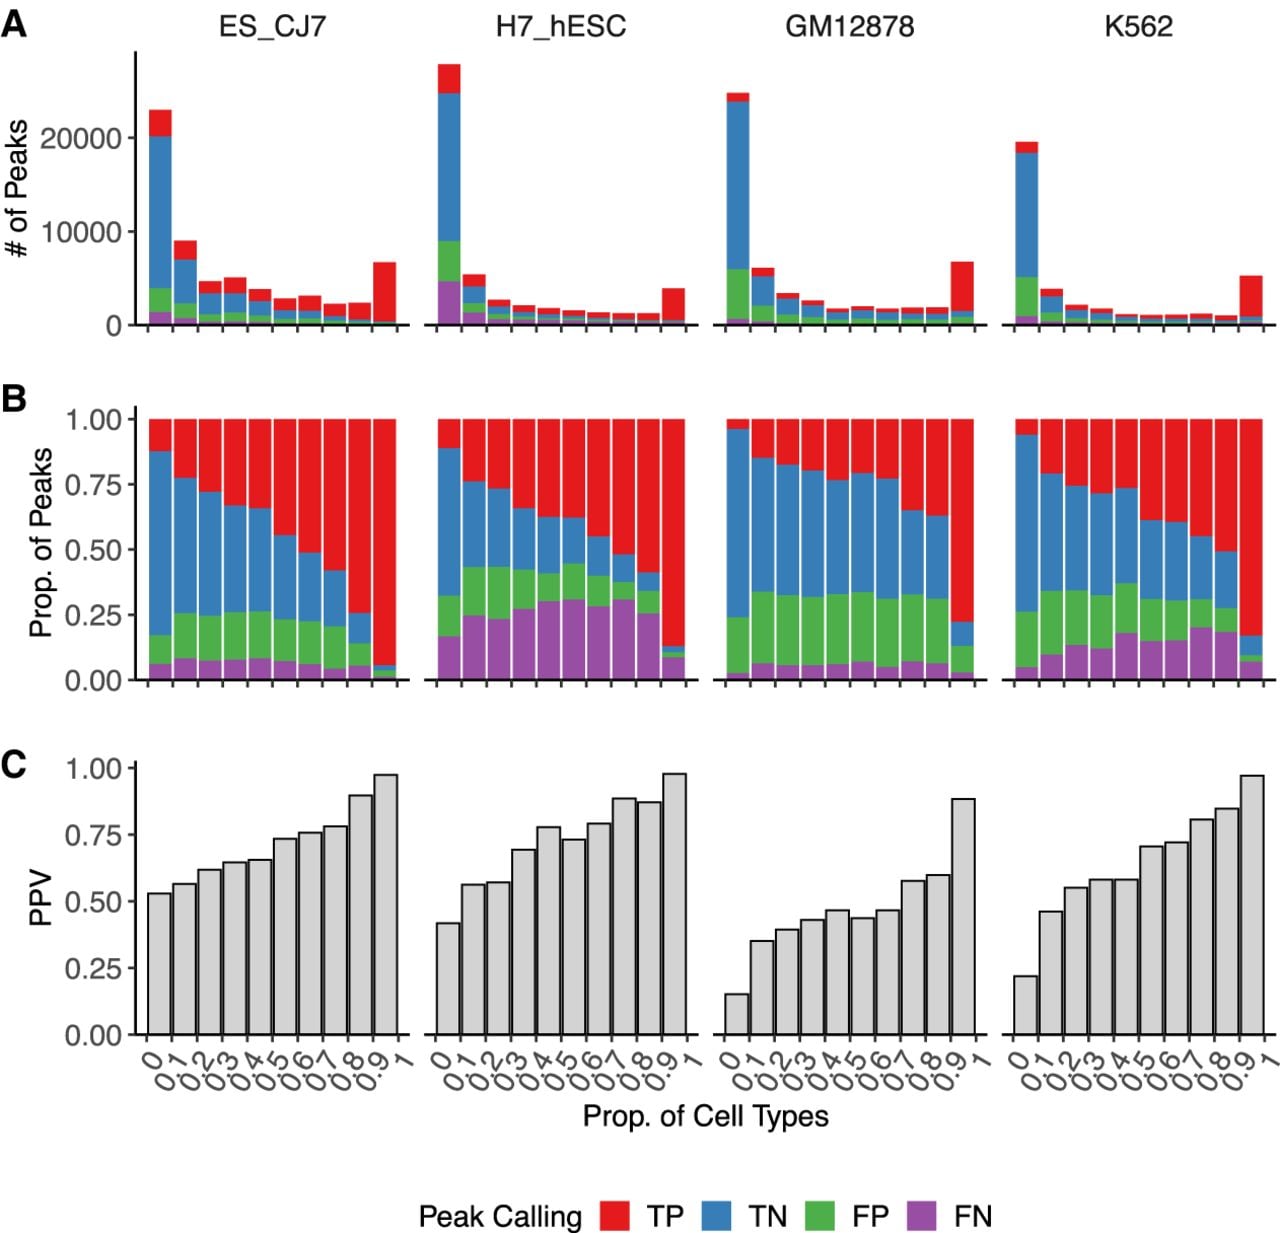
Current deep learning models are trained to predict multiple regulatory tracks (i.e., cell types) at the same time (Kelley et al. 2016, 2018; Avsec et al. 2021b). We reasoned that this multitask strategy could favor detection of pervasive regulatory sites present across multiple cell types to the detriment of more cell-selective features (Schreiber et al. 2020; Kathail et al. 2024). We compared peaks called from Enformer-predicted accessibility against matching experimental DNase-seq peaks. Peaks were partitioned according to their activity across 141 cell and tissue types from reference DNase-seq data sets that included 105 human tracks and 36 mouse tracks (Supplemental Table S3). This analysis showed that tissue-specific peaks were highly enriched for false positives, whereas true positives tended to be constitutively active sites (Fig. 5A,B). Enformer presented increasingly higher positive predictive values (PPVs) with decreasing tissue specificity (Fig. 5C). Similar trends were observed when investigating mESC promoter, CTCF, and non-CTCF sites (Supplemental Fig. S8), suggesting the lack of sensitivity to cell type–selective sites is not limited to particular classes of genomic regulatory elements. The relatively low proportion of false-positive sites among the more cell type–specific sites suggests that some of them can be explained by features bleeding through from other training tracks.
Enformer favors detection of shared regulatory sites. (A–C) Peak-calling comparison between mESC_CJ7, H7_hESC, GM12878, and K562 DNase-seq and their respective Enformer predictions (for details, see Methods). Peaks were binned according to the proportion of cell types represented in a collection of mouse (N = 36) and human (N = 105) reference DNase-seq data sets (Supplemental Table S3). Peaks are classified as true positive (TP) when found in both reference DNase-seq and Enformer predictions, as true negative (TN) when not found in either, as false positive (FP) when found only in Enformer predictions, and as false negative (FN) when found only in reference DNase-seq. A 25.6 kb input window was used for predictions. (A) Total number of peaks colored by category. (B) Relative proportion of categories per bin. (C) Positive predictive value (PPV) per bin.
Fine-tuning on synthetic regulatory genomic data sets improves predictive performance
We then developed a fine-tuning strategy to improve model performance through incorporation of synthetic regulatory genomic data sets. We added a new independent output layer that uses the baseline Enformer feature extraction trunk to predict Sox2 expression (Fig. 6A). The new output layer is composed of a self-attention layer to capture relevant features independently of position and a dense layer to combine the resulting signal into a single expression prediction value. This allowed us to fine-tune Enformer internal feature extraction without affecting mouse or human regulatory track heads. We evaluated three configurations of the new output self-attention layer: SingleHead 64/64, SingleHead 64/128, and MultiHead 64/64 (for details, see Methods). They all presented similar performances, and any can be considered an adequate architecture.
Improved model prediction by incorporating synthetic regulatory genomics data. (A) Enformer fine-tuning architecture. (B) Data set augmentation and training strategy. (C,D) Predictive performance of baseline and fine-tuned Enformer models on training (C) Brosh et al. (2023) and held-out test (D) Ordoñez et al. (2025) sets. Expression was estimated either by summing the maximum predicted accessibility of all LCR DHS (accessibility) or by taking directly from the new output head (expression). MSE, mean-squared error. Results presented for overall data set and payload categories containing more than two payloads. Horizontal dotted lines show baseline performance. (E) Experimental and predicted mESC DNase-seq at the Jph3 locus. Shown is DNase-seq of the prediction target (mESC_CJ7), a technical replicate, an independent cell line (mESC_E14), and accessibility predictions made with baseline and fine-tuned Enformer models. (F,G) Genome-wide predictive performance showing experimental mESC replicates to indicate maximum performance. Error bars indicate ±1 SD. (F) Mean correlation (r) with the prediction target mESC_CJ7 at peaks. Peak signal was measured as the maximum at bins overlapping each hotspot. (G) Mean peak-calling accuracy from predicted signal.
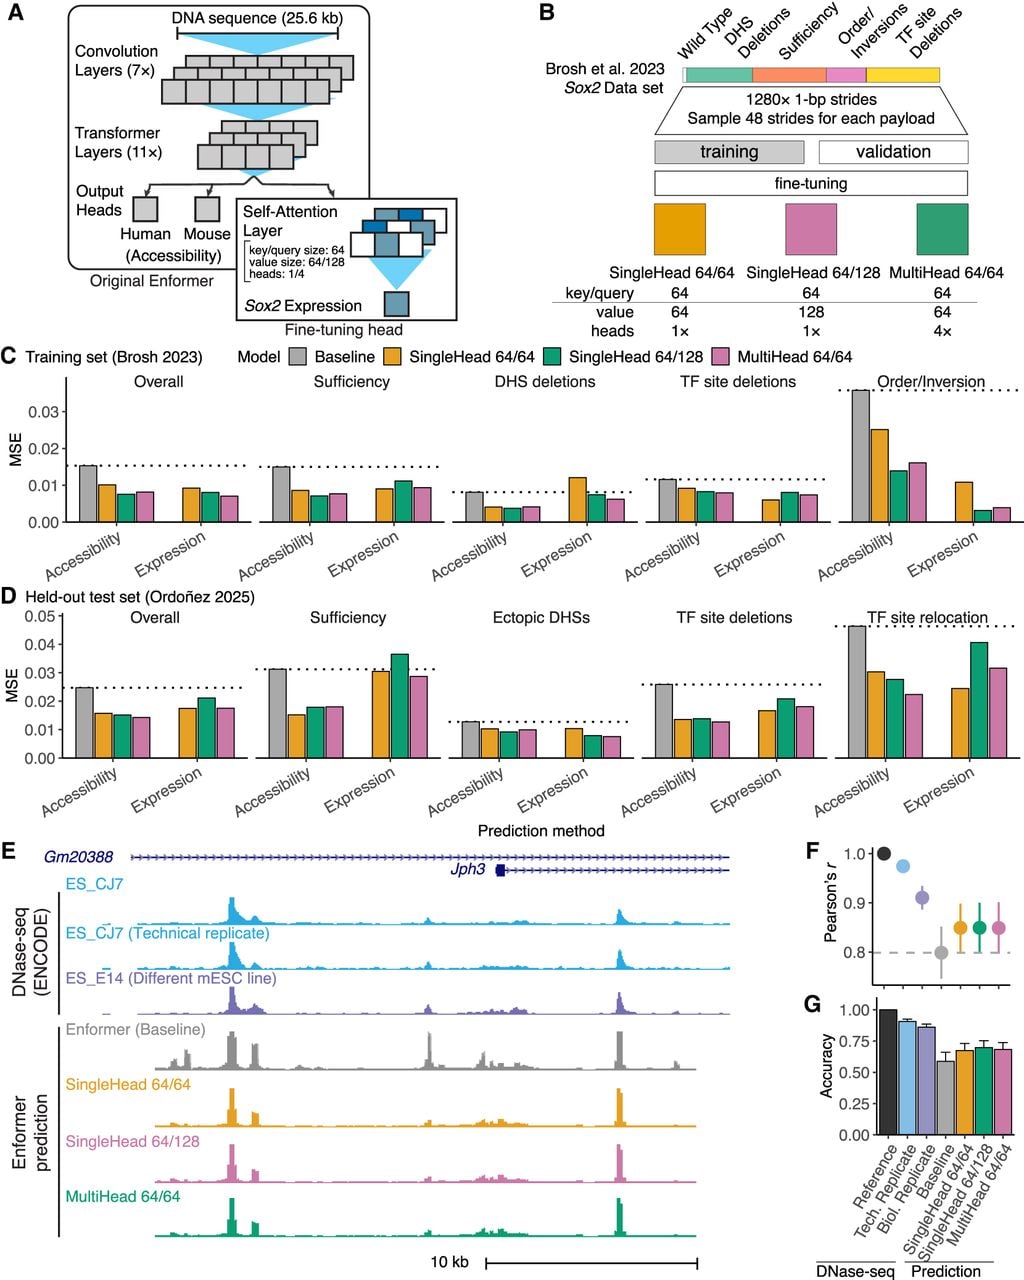
For training, we sampled from different windows centered on the experimentally assessed payloads inserted to replace the endogenous Sox2 LCR in the mouse reference genome (Methods) (Fig. 6B; Supplemental Fig. S9). To assess whether our results were sensitive to overfitting from training and evaluating our model on the same collection of payloads, we developed a more conservative training strategy that randomly partitioned payloads into independent training and validation data sets (Supplemental Fig. S9C). Training 10 batches of models using this partitioned strategy produced similar results to the full data set training, but with higher variance owing to the reduced numbers of payloads per category (Supplemental Fig. S10). Thus, we employed the model trained with the full data set for all subsequent analysis.
Across payload categories, fine-tuned models outperformed baseline Enformer predictions, especially for complex sequence modification such as DHS ordering and inversion (Fig. 6C). To confirm performance of the fine-mapped model on a held-out test set, we analyzed a second data set composed of 86 synthetic payloads, including further Sox2 DHS combinations, TF deletions and relocations, and combinations of DHS from Sox2, Nanog, Sall1, and Prdm14 (Ordoñez et al. 2025). Analysis showed similar improvements (Fig. 6D). When comparing baseline and fine-tuned genome-wide accessibility predictions, fine-tuning eliminated several baseline false positives (Fig. 6E). Genome-wide assessment of mESC accessibility predictions demonstrated that fine-tuned models presented higher peak correlation to source DNase-seq and higher peak-calling accuracy (Fig. 6F,G). Predictions from the fine-tuned Enformer retained high predictive performance across multiple assay categories (Supplemental Fig. S11). The final tuning step for Enformer was toward the human data set (Avsec et al. 2021a), which may have slightly favored detection of human regulatory features. Fine-tuned predictions outperformed baseline for all mouse assays and showed only minimal performance decay against human assays (Supplemental Fig. S12). The fine-tuned model showed no improvement in predicting distance effects, suggesting the potential for future work to explicitly incorporate distance effects when training new models (Supplemental Fig. S13). Our results demonstrate a unique approach to iteratively improve the predictive performance of pretrained deep learning models through incorporation of high-yield synthetic regulatory assay data.
Discussion
We showed that Enformer has good performance modeling basic aspects of synthetic regulatory data at both Sox2 and Hba loci, but it fails to capture DHS synergy and was only partially sensitive to TF site deletions. For sequences (i.e., SynHPRT1R) that were more diverged from the reference used to train Enformer, the model performed poorly. We found Enformer unable to effectively model long-range regulation of Sox2 transcription, consistent with previous reports that predictive performance falls off rapidly distal to the target TSS (Avsec et al. 2021a; Karollus et al. 2023; Toneyan and Koo 2024). The architecture of Enformer penalizes feature interaction proportionally to the distance between elements, which may contribute to this shortcoming. Further, long-range interactions are relatively uncommon and thus will not be favored during training (Karollus et al. 2023). This highlights the limitations imposed by a limited training sequence space and poses caveats to future analysis of novel sequences.
We generally found better predictive performance using predictions for DNA accessibility, even when the experimental data measured expression. In particular, Enformer CAGE predictions showed overall poor performance on the distal regulatory elements we tested. The mESC CAGE output head performed as well as those from the Enformer paper (Supplemental Fig. S3), but it is possible that CAGE predictions in mESCs could be further optimized. Our results suggest that accessibility provides a useful intermediate more amenable to prediction, at least in the context of distal enhancer perturbations. This is consistent with other observations that predictions of DNA accessibility are more effective than those for CAGE for promoter-distal regulatory elements (Karollus et al. 2023; Martyn et al. 2025). However, there is the possibility that this strategy overlooks differences between molecular function on the level of DNA accessibility and transcription. For example, although we used Sox2 expression data to fine-tune Enformer, we only evaluated predictive performance on DNA accessibility. Although the focus on DNA accessibility was supported by our earlier analysis, we did not show directly that fine-tuning makes more accurate gene expression predictions. For models like Enformer that are trained to predict both DNA accessibility and transcription, it remains to be seen whether the model has a deep understanding of the distinct underlying biomolecular processes involved or whether a core understanding based on regulatory sequence motifs underpins superficial differences that tailor the output to a specific genomic track. Our work suggests that different model architectures and training data may be needed to predict local effects of functional variants versus identification of their target genes.
Multitask training to predict multiple regulatory genomic assays across different cell and tissue types enables information sharing between the different contexts (Kelley et al. 2018). However, performance remains limited by the training sequence space. Here we demonstrated that predictive power is related to the degree of DHS activity across multiple cell and tissue types, consistent with previous reports (Kathail et al. 2024). Broadly active sites across regulatory assays and cell types are favored during training because prediction errors for such features are weighed more strongly. Thus, correlation structures among genomic features can impede model training (Whalen et al. 2022). Simply expanding the number of training tasks has limited benefit as the sequence space explored remains the same (Schreiber et al. 2020; Kathail et al. 2024).
Deep learning models are promising tools to expand our understanding of regulatory genomics and to interpret variant functional impact (Zhou and Troyanskaya 2015; Avsec et al. 2021a,b). However, our results show they are currently limited by the limited scope of their training sequences, which largely reflect the reference genome. We argue that deep learning models would benefit from training on functional characterization of regulatory elements that have been systematically deleted, reordered, inverted, and perturbed by disease- and trait-associated variation. An iterative training strategy in which these results feed into model development, which in turn directs future experimental exploration, would allow systematic exploration of disease- and trait-relevant sequence space and improve model performance across contexts. As a proof of concept of this strategy, our results showed that fine-tuning improved prediction performance across all payload categories and improved genome-wide prediction performance, cleaning many false-positive signals and producing higher peak-calling accuracy. Thus, synthetic regulatory genomics and machine learning are highly complementary in genomics’ dual status as both a “big data” science and an experimental science to uniquely permit pushing the limits of model knowledge while maintaining generality through iterative large-scale testing of model predictions.
Methods
Enformer model
The published Enformer model is hosted in the kaggle repository (https://www.kaggle.com/models/deepmind/enformer) cited by Avsec et al. (2021a). This model, referred to here as Avsec2021, requires a 393,216 bp input sequence and outputs predictions for the central 114,688 bp region (Supplemental Fig. S1A).
Our model implementation was based on an equivalent model hosted at the DeepMind GitHub repository (https://github.com/google-deepmind/deepmind-research/tree/master/enformer) and pretrained weights from Google storage (gs://dm-enformer/models/enformer/sonnet_weights/). Based on previous work showing that Enformer retains most of its predictive performance with shorter input windows (Karollus et al. 2023), we employed an adapted version lacking an internal cropping layer to allow a flexible input sequence size, instead of the fixed 196,608 bp, and to generate predictions for the whole input (Supplemental Fig. S1B). We compared the Avsec2021 version to our adapted model with decreasing input sizes (196,608 bp, 114,688 bp, and 25,600 bp). We selected 10 114,688 bp sites containing at least one mESC_CJ7 hotspot V1 (FDR 0.01) and predicted their mESC_CJ7 DNase-seq density using all four implementations (Supplemental Fig. S1C). We found no significant prediction deviations between the Avsec2021 version and our adapted versions (Supplemental Fig. S1D,E). Furthermore, we found high correlation in predicted DNase-seq for delivered Sox2 payloads using 25,600 bp and 196,608 bp windows (Supplemental Fig. S2).
Enformer predictions throughout the paper were measured as the mean of 10 1 bp strides (5 bp downstream and upstream) unless otherwise noted. Predicted accessibility and CAGE signal were measured as the maximum signal across all bins overlapping the promoter or DHSs as described. Synthetic sequences used for prediction are included in Supplemental Data S1.
Synthetic regulatory biology data sets
Sox2
Expression data were previously published: see Supplemental Table S4 of Brosh et al. (2023) and work by Ordoñez et al. (2025). Briefly, engineered allele Sox2 expression was measured by qRT-PCR using allele-specific primers. The fold-change was calculated as 2ΔCT[CAST-B6] and scaled to yield expression values ranging from zero (ΔSox2) to one (WT). Previously published DNase-seq data were taken from ENCODE: DS13320 (mESC_CJ7) and DS21450 (mESC_E14) (Vierstra et al. 2014).
When employing Enformer to predict mESC_CJ7 DNase-seq signal of these payloads, virtual sequences were built by replacing either the full 143 kb Sox2 locus or 43 kb LCR in the mouse reference genome (mm10) (Supplemental Table S1) with the synthetic payload sequence. Predictions were generated for a 196,608 bp window centered at the payload insertion site (Supplemental Table S2).
Hba
Expression data were previously published: see Figures 5A and 6, B–D (Blayney et al. 2023). Engineering was performed in mESCs (mDist cells derived from mESC_E14), and expression was measured in embryonic body–derived erythroid cells. Hba expression in engineered cells was profiled by qRT-PCR, normalized to Hbb, and scaled to a proportion of WT expression. Previously published embryonic liver DNase-seq data were taken from ENCODE: DS20937 (mfLiver-F3) (Vierstra et al. 2014) and ATAC-seq of engineered cells from the NCBI Gene Expression Omnibus (GEO; https://www.ncbi.nlm.nih.gov/geo/) under accession number GSE219056.
We employed Enformer to predict accessibility of those five enhancers (R1–R4) (Supplemental Table S1) in mouse embryonic liver (mfLiver-F3) as a proxy for Hba expression. Different enhancer configurations were generated by deleting and relocating R1–R4 enhancers on the mouse reference genome (mm10). Predictions were generated for a 25.6 kb window centered around the R1–R4 enhancers.
HPRT1R
ATAC-seq data were previously published: BS15734A, BS15738A, and BS21951A were taken from GEO (GSM8001814, GSM8001817, and GSM8001825, respectively) (Camellato et al. 2024). Previously published DNase-seq data were taken from ENCODE: DS13320 (mESC_CJ7) and DS18873 (H7_hESC) (Thurman et al. 2012; Vierstra et al. 2014; Meuleman et al. 2020).
Virtual sequences were built by replacing the mouse Hprt1 locus (Supplemental Table S1) in the mouse reference genome (mm10) with each of the three payloads. Accessibility in mESC_CJ7 was predicted in a 393,216 bp window centered at the Hprt1 locus. We similarly predicted human HPRT1 locus accessibility in human H7_hESC.
Training Enformer on mESC CAGE data
Previously published mESC CAGE tracks CNhs14104 and CNhs14109 were taken from the FANTOM website at https://fantom.gsc.riken.jp/5/datafiles/reprocessed/mm10_latest/basic/mouse.timecourse.hCAGE/ (Fraser et al. 2015), and GSM3852792, GSM3852793, and GSM3852794 were taken from GEO series GSE132191 (Bonetti et al. 2020). We trained a new output head that employs the Enformer trunk to predict these five new mESC CAGE tracks. The output head was trained, evaluated, and tested on random 25.6 kb genomic intervals using a Poisson negative log-likelihood loss function. Training and evaluation data sets were composed of 469,585 intervals from the mouse reference genome (mm10) randomly assigned in a 9:1 ratio to each data set, respectively. We used Adam optimizer from TensorFlow with a learning rate of 0.0005 and otherwise default settings to train for 20 epochs, each visiting 1600 intervals in batches of four. Only the new output head weights were updated during training while preserving weights for the Enformer trunk.
The resulting model performance was evaluated by measuring Pearson's correlation of CAGE signal (log(1 + x) transformed) between the original and predicted CAGE signals at nine ∼5.7 Mb genomic intervals of interest (Supplemental Table S1; Supplemental Fig. S3) in nonoverlapping 196,608 bp blocks. We also measured the Pearson's correlation of seven other CAGE tracks from baseline Enformer at the same intervals (FANTOM: CNhs10466, CNhs10469, CNhs10471, CNhs10474, CNhs11297, CNhs12107, and CNhs13511; Enformer index: 6601, 6604, 6606, 6609, 6823, 6830, and 6937). GSM3852792 was selected as representative for further analysis in mESCs. Predictions used a 196,608 bp input window.
Enformer fine-tuning
To fine-tune Enformer using the Sox2 LCR synthetic payload data set, we added a new output head to Enformer to predict Sox2 expression based on the Sox2 LCR sequence. The new head employs a self-attention layer to capture relevant features from the Enformer prediction trunk independently of position. The resulting signal is combined into a scalar prediction of Sox2 expression by a fully connected layer using a softplus activation function (Fig. 6A).
Here we evaluated three configurations of the self-attention layer by varying the internal key/value matrix sizes and the number of independent attention projections (or heads). SingleHead 64/64 applies a single projection of 64 key and value matrices; SingleHead 64/128 applies a single projection of 64 key and 128 value matrices; and MultiHead 64/64 applies four independent projections of 64 key and value matrices.
Synthetic payload sequences of Brosh et al. (2023) and Ordoñez et al. (2025) were expanded to 1280 entries by striding 1 bp at a time up to ±640 bp upstream and downstream through a 25.6 kb focal region centered at the Sox2 LCR (Supplemental Fig. S9A). We included all the Brosh et al. (2023) payloads (n = 70) during both training and evaluation. Forty-eight strides from the Brosh et al. (2023) data set were sampled to train the three fine-tuned model configurations, and another 48 strides were sampled for evaluation (Fig. 6B; Supplemental Fig. S9B). For the 86 payloads in the held-out test Ordoñez et al. (2025) data set, 32 strides were sampled as a testing data set.
In parallel, we trained models with the Brosh et al. (2023) payloads partitioned into training and evaluation data sets to avoid data leakage. Payloads were randomly assigned into a training or validation data set in a 3:1 ratio for 10 independent batches. Models were trained and their performance evaluated using each batch training and validation data set (Supplemental Fig. S9C). Performance was averaged across training batches. Retrained models presented similar results to full data set training, but higher variance likely attributable to the reduced size of the training sets.
For both strategies, fine-tuning was conducted using only the baseline Enformer trunk and the new output head. This strategy allows us to adjust Enformer internal feature extraction based on our synthetic data set, while preserving mouse and human prediction heads. We employed the Adam optimization algorithm with a learning rate of 10−5 to fine-tune the models for 10 epochs, each visiting 400 sequences at time in batches of 4 sequences. Training error was measured by mean-squared error (MSE).
Predictions for performance comparisons were made using a 25.6 kb input window. Expression was estimated directly from the new output head and indirectly by summing predicted accessibility of all LCR DHSs in mESC_CJ7. For comparison, accessibility estimates were scaled to match measured expression using a linear regression fitted with the training data set. Predictions were averaged across all payload strides and error measured by MSE across synthetic payloads (Supplemental Table S1).
Genome-wide predictive performance
Genome-wide evaluations were conducted by comparing experimental DNase-seq results to baseline and fine-tuned models for eight selected tracks (Supplemental Table S4). For each selected track, we evaluated predictions at 2000 randomly selected 25.6 kb regions from autosomes containing at least one hotspot V1 (FDR 0.01) for the selected track. Within those regions, peaks were identified as continuous runs of DNase-seq density or prediction values above the track cutoff and >128 bp. The track signal cutoff was established by calculating the signal 95th percentile at 2000 random 128 bp sites within the targeted regions. A final collection of evaluated sites was generated by merging peaks called for all DNase-seq assays (selected track, technical replicate, and others), the baseline, and fine-tune predictions and combining it to nonoverlapping random sites used to the signal cutoff. Activity across cell types and tissues was estimated by annotating the number of tracks with overlapping hotspots V1 (FDR 0.01) among a collection of reference mouse (N = 36) and human (N = 105) ENCODE DNase-seq tracks (Supplemental Table S3).
Software availability
Code for training Enformer on new cell types and for fine-tuning Enformer is available at GitHub (https://github.com/mauranolab/finetune-enformer) and as Supplemental Code. Weights for the fine-tuned Enformer and mESC CAGE predictions are available at Zenodo (https://doi.org/10.5281/zenodo.13363228).
Competing interest statement
M.T.M. is listed as an inventor on a patent application describing Big-IN.
Acknowledgments
We thank Raquel Ordoñez for helpful comments and Ran Brosh and Brendan Camellato for sharing data. This work was partially funded by National Institutes of Health (NIH) grants RM1HG009491 and R01MH136353.
Author contributions: M.T.M. conceived and oversaw the project. A.M.R.S. performed analyses. A.M.R.S. and M.T.M. wrote the paper.
Notes
[1] Supplementary material [Supplemental material is available for this article.]
[2] Article published online before print. Article, supplemental material, and publication date are at https://www.genome.org/cgi/doi/10.1101/gr.280540.125.
References
- ↵Avsec Ž, Agarwal V, Visentin D, Ledsam JR, Grabska-Barwinska A, Taylor KR, Assael Y, Jumper J, Kohli P, Kelley DR. 2021a. Effective gene expression prediction from sequence by integrating long-range interactions. Nat Methods 18: 1196–1203. 10.1038/s41592-021-01252-x
- ↵Avsec Ž, Weilert M, Shrikumar A, Krueger S, Alexandari A, Dalal K, Fropf R, McAnany C, Gagneur J, Kundaje A, 2021b. Base-resolution models of transcription-factor binding reveal soft motif syntax. Nat Genet 53: 354–366. 10.1038/s41588-021-00782-6
- ↵Blayney JW, Francis H, Rampasekova A, Camellato B, Mitchell L, Stolper R, Cornell L, Babbs C, Boeke JD, Higgs DR, 2023. Super-enhancers include classical enhancers and facilitators to fully activate gene expression. Cell 186: 5826–5839.e18. 10.1016/j.cell.2023.11.030
- ↵Bonetti A, Agostini F, Suzuki AM, Hashimoto K, Pascarella G, Gimenez J, Roos L, Nash AJ, Ghilotti M, Cameron CJF, 2020. RADICL-seq identifies general and cell type–specific principles of genome-wide RNA-chromatin interactions. Nat Commun 11: 1018. 10.1038/s41467-020-14337-6
- ↵Brosh R, Laurent JM, Ordoñez R, Huang E, Hogan MS, Hitchcock AM, Mitchell LA, Pinglay S, Cadley JA, Luther RD, 2021. A versatile platform for locus-scale genome rewriting and verification. Proc Natl Acad Sci 118: e2023952118. 10.1073/pnas.2023952118
- ↵Brosh R, Coelho C, Ribeiro-Dos-Santos AM, Ellis G, Hogan MS, Ashe HJ, Somogyi N, Ordoñez R, Luther RD, Huang E, 2023. Synthetic regulatory genomics uncovers enhancer context dependence at the Sox2 locus. Mol Cell 83: 1140–1152.e7. 10.1016/j.molcel.2023.02.027
- ↵Camellato BR, Brosh R, Ashe HJ, Maurano MT, Boeke JD. 2024. Synthetic reversed sequences reveal default genomic states. Nature 628: 373–380. 10.1038/s41586-024-07128-2
- ↵Cochran K, Srivastava D, Shrikumar A, Balsubramani A, Hardison RC, Kundaje A, Mahony S. 2022. Domain-adaptive neural networks improve cross-species prediction of transcription factor binding. Genome Res 32: 512–523. 10.1101/gr.275394.121
- ↵de Boer CG, Taipale J. 2024. Hold out the genome: a roadmap to solving the cis-regulatory code. Nature 625: 41–50. 10.1038/s41586-023-06661-w
- ↵Dey KK, van de Geijn B, Kim SS, Hormozdiari F, Kelley DR, Price AL. 2020. Evaluating the informativeness of deep learning annotations for human complex diseases. Nat Commun 11: 4703. 10.1038/s41467-020-18515-4
- ↵The ENCODE Project Consortium, Moore JE, Purcaro MJ, Pratt HE, Epstein CB, Shoresh N, Adrian J, Kawli T, Davis CA, Dobin A, 2020. Expanded encyclopaedias of DNA elements in the human and mouse genomes. Nature 583: 699–710. 10.1038/s41586-020-2493-4
- ↵The FANTOM Consortium and the Riken PMI and CLST (DGT), Forrest ARR, Kawaji H, Rehli M, Baillie JK, de Hoon MJL, Haberle V, Lassmann T, Kulakovskiy IV, Lizio M, 2014. A promoter-level mammalian expression atlas. Nature 507: 462–470. 10.1038/nature13182
- ↵Findlay GM, Boyle EA, Hause RJ, Klein JC, Shendure J. 2014. Saturation editing of genomic regions by multiplex homology-directed repair. Nature 513: 120–123. 10.1038/nature13695
- ↵Fraser J, Ferrai C, Chiariello AM, Schueler M, Rito T, Laudanno G, Barbieri M, Moore BL, Kraemer DCA, Aitken S, 2015. Hierarchical folding and reorganization of chromosomes are linked to transcriptional changes in cellular differentiation. Mol Syst Biol 11: 852. 10.15252/msb.20156492
- ↵Halow JM, Byron R, Hogan MS, Ordoñez R, Groudine M, Bender MA, Stamatoyannopoulos JA, Maurano MT. 2021. Tissue context determines the penetrance of regulatory DNA variation. Nat Commun 12: 2850. 10.1038/s41467-021-23139-3
- ↵Huang C, Shuai RW, Baokar P, Chung R, Rastogi R, Kathail P, Ioannidis NM. 2023. Personal transcriptome variation is poorly explained by current genomic deep learning models. Nat Genet 55: 2056–2059. 10.1038/s41588-023-01574-w
- ↵Karollus A, Mauermeier T, Gagneur J. 2023. Current sequence-based models capture gene expression determinants in promoters but mostly ignore distal enhancers. Genome Biol 24: 56. 10.1186/s13059-023-02899-9
- ↵Kathail P, Shuai RW, Chung R, Ye CJ, Loeb GB, Ioannidis NM. 2024. Current genomic deep learning models display decreased performance in cell type-specific accessible regions. Genome Biol 25: 202. 10.1186/s13059-024-03335-2
- ↵Kelley DR. 2020. Cross-species regulatory sequence activity prediction. PLoS Comput Biol 16: e1008050. 10.1371/journal.pcbi.1008050
- ↵Kelley DR, Snoek J, Rinn JL. 2016. Basset: learning the regulatory code of the accessible genome with deep convolutional neural networks. Genome Res 26: 990–999. 10.1101/gr.200535.115
- ↵Kelley DR, Reshef YA, Bileschi M, Belanger D, McLean CY, Snoek J. 2018. Sequential regulatory activity prediction across chromosomes with convolutional neural networks. Genome Res 28: 739–750. 10.1101/gr.227819.117
- ↵Kircher M, Xiong C, Martin B, Schubach M, Inoue F, Bell RJA, Costello JF, Shendure J, Ahituv N. 2019. Saturation mutagenesis of twenty disease-associated regulatory elements at single base-pair resolution. Nat Commun 10: 3583. 10.1038/s41467-019-11526-w
- ↵Kosicki M, Laboy Cintrón D, Keukeleire P, Schubach M, Page NF, Georgakopoulos-Soares I, Akiyama JA, Plajzer-Frick I, Novak CS, Kato M, 2025. Massively parallel reporter assays and mouse transgenic assays provide correlated and complementary information about neuronal enhancer activity. Nat Commun 16: 4786. 10.1038/s41467-025-60064-1
- ↵Lee D, Gorkin DU, Baker M, Strober BJ, Asoni AL, McCallion AS, Beer MA. 2015. A method to predict the impact of regulatory variants from DNA sequence. Nat Genet 47: 955–961. 10.1038/ng.3331
- ↵Li Y, Rivera CM, Ishii H, Jin F, Selvaraj S, Lee AY, Dixon JR, Ren B. 2014. CRISPR reveals a distal super-enhancer required for Sox2 expression in mouse embryonic stem cells. PLoS One 9: e114485. 10.1371/journal.pone.0114485
- ↵Martyn GE, Montgomery MT, Jones H, Guo K, Doughty BR, Linder J, Bisht D, Xia F, Cai XS, Chen Z, 2025. Rewriting regulatory DNA to dissect and reprogram gene expression. Cell 188: 3349–3366.e23. 10.1016/j.cell.2025.03.034
- ↵Maurano MT, Humbert R, Rynes E, Thurman RE, Haugen E, Wang H, Reynolds AP, Sandstrom R, Qu H, Brody J, 2012. Systematic localization of common disease-associated variation in regulatory DNA. Science 337: 1190–1195. 10.1126/science.1222794
- ↵Maurano MT, Haugen E, Sandstrom R, Vierstra J, Shafer A, Kaul R, Stamatoyannopoulos JA. 2015. Large-scale identification of sequence variants influencing human transcription factor occupancy in vivo. Nat Genet 47: 1393–1401. 10.1038/ng.3432
- ↵Meuleman W, Muratov A, Rynes E, Halow J, Lee K, Bates D, Diegel M, Dunn D, Neri F, Teodosiadis A, 2020. Index and biological spectrum of human DNase I hypersensitive sites. Nature 584: 244–251. 10.1038/s41586-020-2559-3
- ↵Mitchell LA, McCulloch LH, Pinglay S, Berger H, Bosco N, Brosh R, Bulajić M, Huang E, Hogan MS, Martin JA, 2021. de novo assembly and delivery to mouse cells of a 101 kb functional human gene. Genetics 218: iyab038. 10.1093/genetics/iyab038
- ↵Mostafavi H, Spence JP, Naqvi S, Pritchard JK. 2023. Systematic differences in discovery of genetic effects on gene expression and complex traits. Nat Genet 55: 1866–1875. 10.1038/s41588-023-01529-1
- ↵Ordoñez R, Zhang W, Ellis G, Zhu Y, Ashe HJ, Ribeiro-Dos-Santos AM, Brosh R, Huang E, Hogan MS, Boeke JD, 2024. Genomic context sensitizes regulatory elements to genetic disruption. Mol Cell 84: 1842–1854.e7. 10.1016/j.molcel.2024.04.013
- ↵Ordoñez R, Ribeiro-dos-Santos AM, McLoughlin C, Ellis G, Ashe HJ, Zufiaurre NB, Brosh R, Majewski M, Camellato B, Boeke JD, 2025. Synthetic genomic dissection of enhancer context sensitivity and synergy. bioRxiv 10.1101/2025.08.13.669251
- ↵Pinglay S, Bulajić M, Rahe DP, Huang E, Brosh R, Mamrak NE, King BR, German S, Cadley JA, Rieber L, 2022. Synthetic regulatory reconstitution reveals principles of mammalian Hox cluster regulation. Science 377: eabk2820. 10.1126/science.abk2820
- ↵Ribeiro-Dos-Santos AM, Hogan MS, Luther RD, Brosh R, Maurano MT. 2022. Genomic context sensitivity of insulator function. Genome Res 32: 425–436. 10.1101/gr.276449.121
- ↵Roadmap Epigenomics Consortium, Kundaje A, Meuleman W, Ernst J, Bilenky M, Yen A, Heravi-Moussavi A, Kheradpour P, Zhang Z, Wang J, 2015. Integrative analysis of 111 reference human epigenomes. Nature 518: 317–330. 10.1038/nature14248
- ↵Sasse A, Ng B, Spiro AE, Tasaki S, Bennett DA, Gaiteri C, De Jager PL, Chikina M, Mostafavi S. 2023. Benchmarking of deep neural networks for predicting personal gene expression from DNA sequence highlights shortcomings. Nat Genet 55: 2060–2064. 10.1038/s41588-023-01524-6
- ↵Schreiber J, Singh R, Bilmes J, Noble WS. 2020. A pitfall for machine learning methods aiming to predict across cell types. Genome Biol 21: 282. 10.1186/s13059-020-02177-y
- ↵Thurman RE, Rynes E, Humbert R, Vierstra J, Maurano MT, Haugen E, Sheffield NC, Stergachis AB, Wang H, Vernot B, 2012. The accessible chromatin landscape of the human genome. Nature 489: 75–82. 10.1038/nature11232
- ↵Toneyan S, Koo PK. 2024. Interpreting cis-regulatory interactions from large-scale deep neural networks. Nat Genet 56: 2517–2527. 10.1038/s41588-024-01923-3
- ↵Toneyan S, Tang Z, Koo PK. 2022. Evaluating deep learning for predicting epigenomic profiles. Nat Mach Intell 4: 1088–1100. 10.1038/s42256-022-00570-9
- ↵Vierstra J, Rynes E, Sandstrom R, Zhang M, Canfield T, Hansen RS, Stehling-Sun S, Sabo PJ, Byron R, Humbert R, 2014. Mouse regulatory DNA landscapes reveal global principles of cis-regulatory evolution. Science 346: 1007–1012. 10.1126/science.1246426
- ↵Whalen S, Pollard KS. 2019. Reply to “inflated performance measures in enhancer–promoter interaction-prediction methods”. Nat Genet 51: 1198–1200. 10.1038/s41588-019-0473-0
- ↵Whalen S, Schreiber J, Noble WS, Pollard KS. 2022. Navigating the pitfalls of applying machine learning in genomics. Nat Rev Genet 23: 169–181. 10.1038/s41576-021-00434-9
- ↵Xi W, Beer MA. 2018. Local epigenomic state cannot discriminate interacting and non-interacting enhancer-promoter pairs with high accuracy. PLoS Comput Biol 14: e1006625. 10.1371/journal.pcbi.1006625
- ↵Zhang W, Golynker I, Brosh R, Fajardo A, Zhu Y, Wudzinska AM, Ordoñez R, Ribeiro-Dos-Santos AM, Carrau L, Damani-Yokota P, 2023. Mouse genome rewriting and tailoring of three important disease loci. Nature 623: 423–431. 10.1038/s41586-023-06675-4
- ↵Zhou J, Troyanskaya OG. 2015. Predicting effects of noncoding variants with deep learning-based sequence model. Nat Methods 12: 931–934. 10.1038/nmeth.3547
- ↵Zhou HY, Katsman Y, Dhaliwal NK, Davidson S, Macpherson NN, Sakthidevi M, Collura F, Mitchell JA. 2014. A Sox2 distal enhancer cluster regulates embryonic stem cell differentiation potential. Genes Dev 28: 2699–2711. 10.1101/gad.248526.114
- ↵Zuin J, Roth G, Zhan Y, Cramard J, Redolfi J, Piskadlo E, Mach P, Kryzhanovska M, Tihanyi G, Kohler H, 2022. Nonlinear control of transcription through enhancer–promoter interactions. Nature 604: 571–577. 10.1038/s41586-022-04570-y