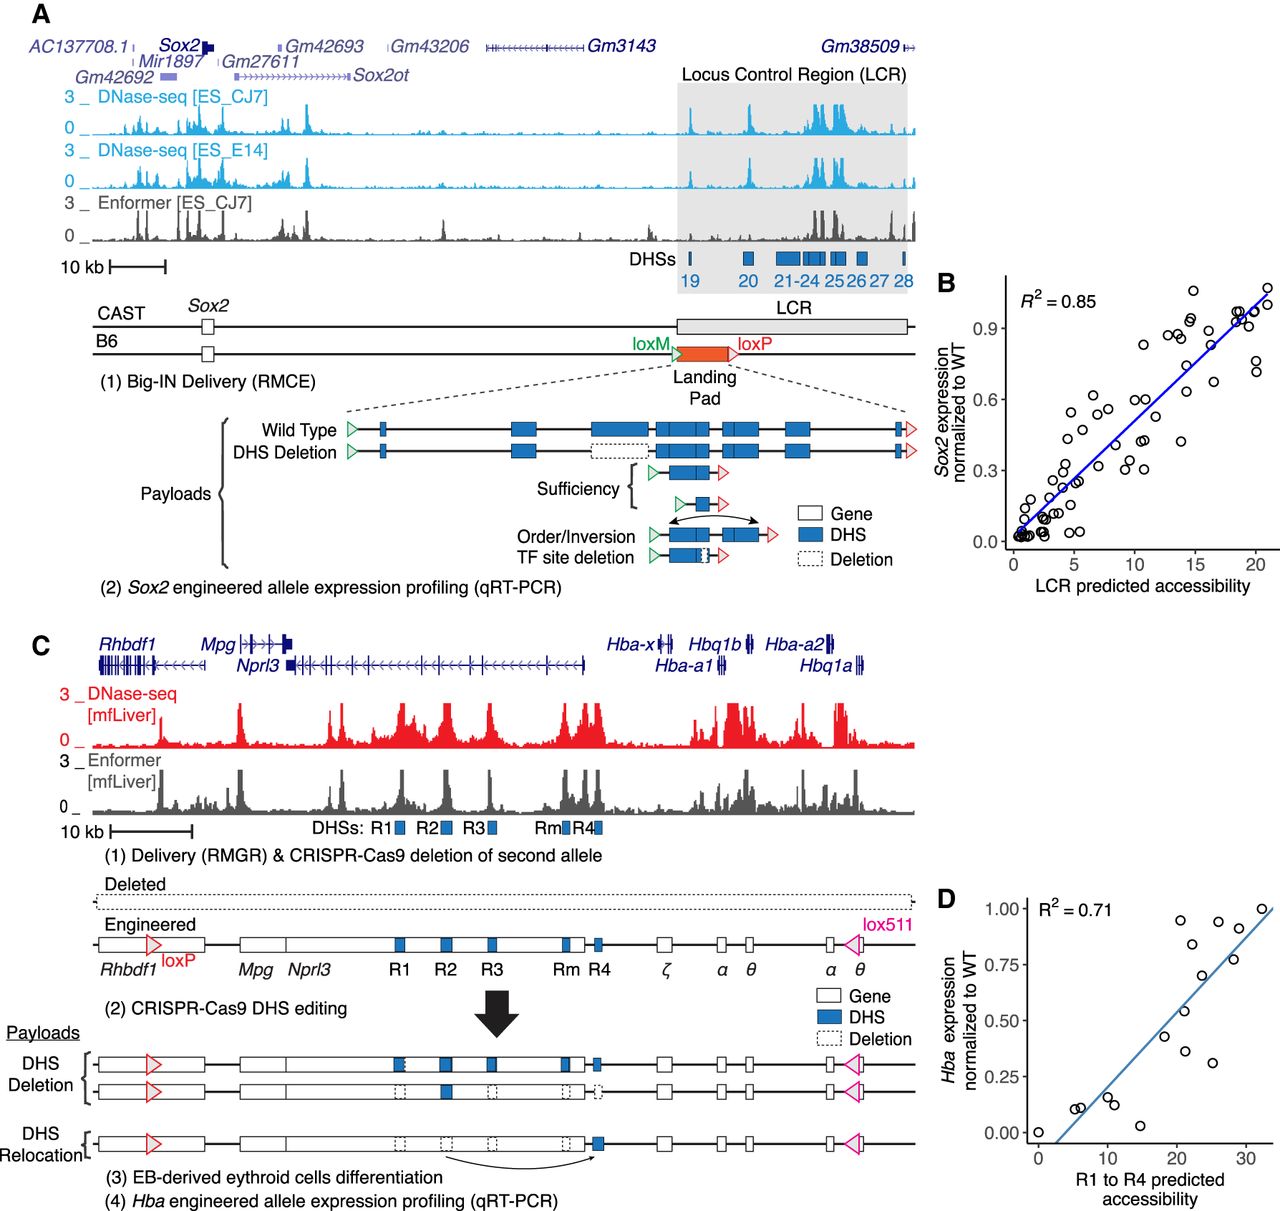
Assessment of Enformer performance on synthetic sequences. (A) Schematic of Sox2 locus showing DNase-seq in mouse embryonic stem cells (mESCs) and Enformer prediction-engineered CAST/B6 mESCs harbor a Big-IN landing pad (LP) replacing one allele of the Sox2 LCR for delivery of multiple synthetic payloads (Brosh et al. 2023). Locus control region (LCR) is highlighted in gray. DHSs are indicated by blue boxes. DHS deletions are indicated by dashed boxes. (B) Sox2 expression was characterized by allele-specific qRT-PCR. Each point represents experimentally measured Sox2 expression and Enformer prediction of a synthetic payload (N = 70). Engineered Sox2 allele expression was scaled between zero (ΔSox2) and one (WT). LCR activity was measured as the summed accessibility over all LCR (DHSs 19–28) in mESC_CJ7. (C) Schematic of hemoglobin alpha locus showing DNase-seq of mouse fetal liver (mfLiver), Enformer predictions, and hemoglobin alpha locus engineering strategy by CRISPR-Cas9 editing and characterization using qRT-PCR (Blayney et al. 2023). Enhancers R1–R4 are indicated by blue boxes. Deleted regions are represented by dashed boxes. (D) Hba expression of the resulting cells was profiled by qRT-PCR, normalized to Hbb, and scaled as a proportion of WT expression. Each point represents experimentally measured Hba expression and Enformer prediction of an enhancer configuration (N = 17). Hba expression was measured by qRT-PCR, normalized to Hbb, and scaled as a proportion of WT expression. Predicted enhancers (R1–R4) activity was measured as the sum of maximum predicted accessibility at enhancers R1 to R4. Blue lines indicate linear regressions (B,D).