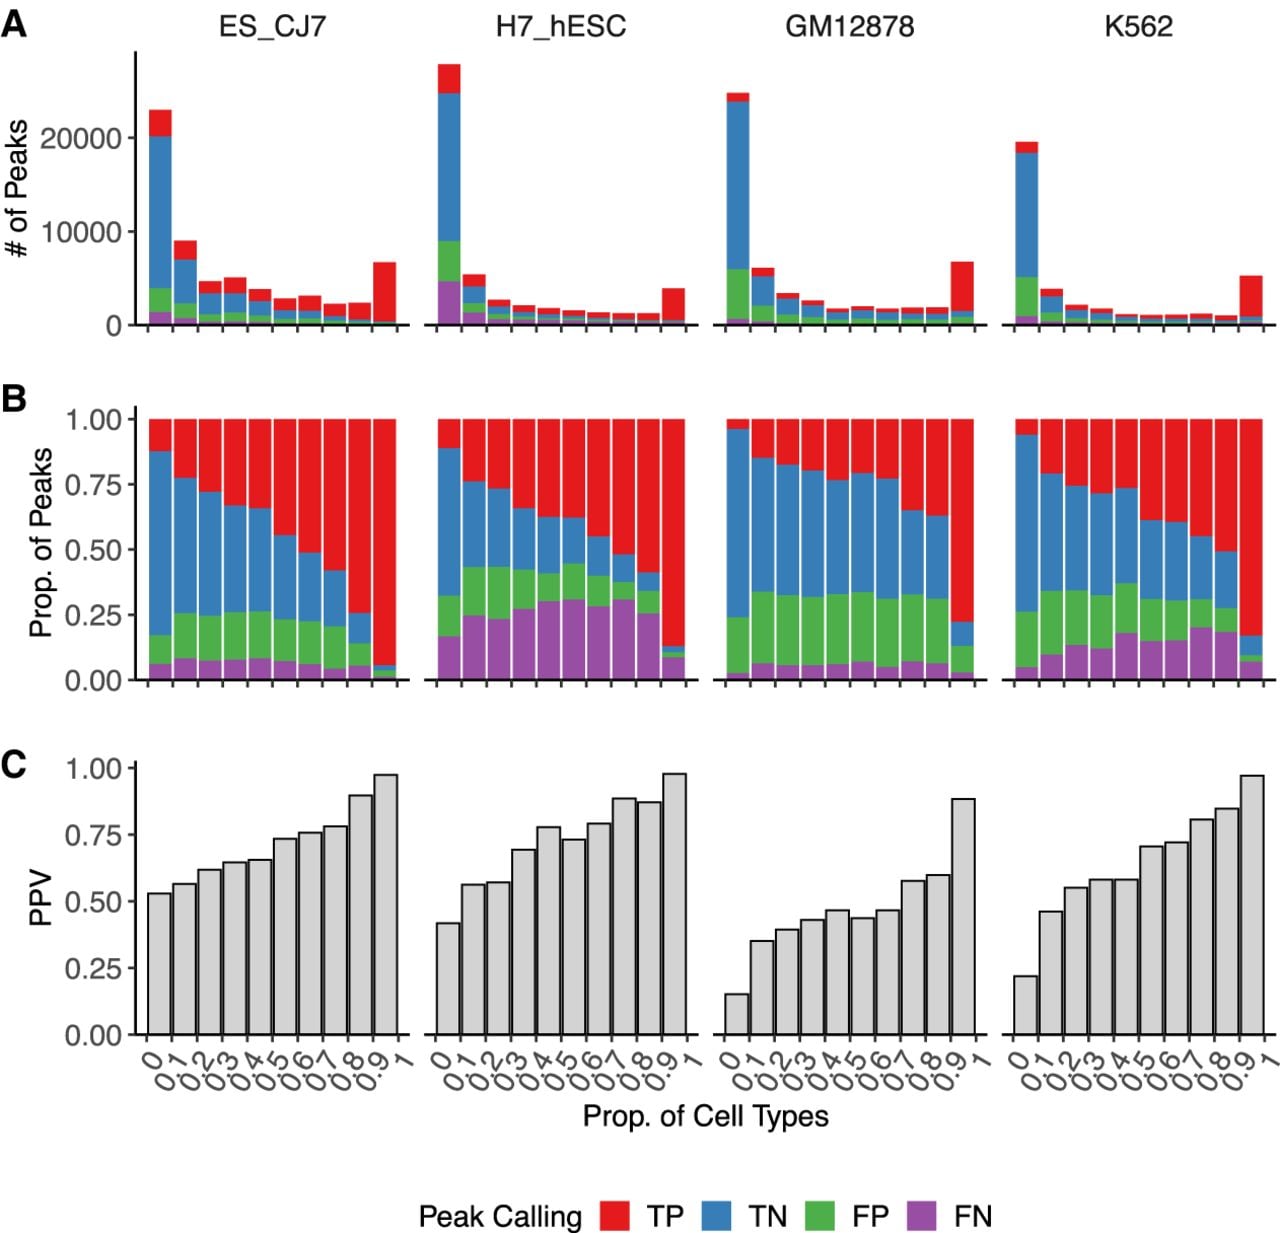
Enformer favors detection of shared regulatory sites. (A–C) Peak-calling comparison between mESC_CJ7, H7_hESC, GM12878, and K562 DNase-seq and their respective Enformer predictions (for details, see Methods). Peaks were binned according to the proportion of cell types represented in a collection of mouse (N = 36) and human (N = 105) reference DNase-seq data sets (Supplemental Table S3). Peaks are classified as true positive (TP) when found in both reference DNase-seq and Enformer predictions, as true negative (TN) when not found in either, as false positive (FP) when found only in Enformer predictions, and as false negative (FN) when found only in reference DNase-seq. A 25.6 kb input window was used for predictions. (A) Total number of peaks colored by category. (B) Relative proportion of categories per bin. (C) Positive predictive value (PPV) per bin.