
Large-scale investigation of species-specific orphan genes in the human gut microbiome elucidates their evolutionary origins
Abstract
Species-specific genes, also known as orphans, are ubiquitous across life's domains. In prokaryotes, species-specific orphan genes (SSOGs) are mostly thought to originate in external elements such as viruses followed by horizontal gene transfer, whereas the scenario of native origination, through rapid divergence or de novo, is mostly dismissed. However, quantitative evidence supporting either scenario is lacking. Here, we systematically analyzed genomes from 4644 human gut microbiome species and identified more than 600,000 unique SSOGs, representing an average of 2.6% of a given species’ pangenome. These sequences are mostly rare within each species yet show signs of purifying selection. Overall, SSOGs use optimal codons less frequently, and their proteins are more disordered than those of conserved genes (i.e., non-SSOGs). Importantly, across species, the GC content of SSOGs closely matches that of conserved ones. In contrast, the ∼5% of SSOGs that share similarity to known viral sequences have distinct characteristics, including lower GC content. Thus, SSOGs with similarity to viruses differ from the remaining SSOGs, contrasting an external origination scenario for most of them. By examining the orthologous genomic region in closely related species, we show that a small subset of SSOGs likely evolved natively de novo and find that these genes also differ in their properties from the remaining SSOGs. Our results challenge the notion that external elements are the dominant source of prokaryotic genetic novelty and will enable future studies into the biological role and relevance of species-specific genes in the human gut.
Genomes of the same prokaryotic species can vary substantially in gene content, giving rise to huge pangenomes, namely, all genes present in a species (Brockhurst et al. 2019). Pangenomes generally consist of three types of genes: a small set of “core” or nearly universal genes, a larger set of “shell” or moderately conserved genes, and a huge “cloud” of rare genes (Koonin and Wolf 2008; Koonin et al. 2021). Cloud genes are particularly intriguing, as each newly sequenced genome is adding novel genes to the pangenome. This suggests that there is an ongoing appearance of genes in pangenomes, which has been mainly attributed to horizontal gene transfer (HGT). Bacteria are constantly under selection pressure to adapt to changing conditions or to colonize new niches, and cloud genes might continuously provide novel genetic material on which selection can act. Thus, although most cloud genes are transient, some might prove to be adaptive and persist in the population (Conrad et al. 2022).
Pangenomes even contain genes that have no sequence similarity outside the species. Genes without detectable similarity to genes outside of a particular group have been termed lineage-specific genes, taxonomically restricted genes, or orphan genes (short: orphans) (Dujon 1996; Tautz and Domazet-Lošo 2011; Karlowski et al. 2023), and here, we focus on species-specific orphan genes (SSOGs). SSOGs cannot be explained by the insufficient sequencing of homologous sequences, because each genome typically contains additional genes that cannot be found in other genomes, as, for example, observed in Escherichia coli (Yu and Stoltzfus 2012). Also, genes specific to E. coli have been found to be narrowly distributed within the species (Yu and Stoltzfus 2012); thus, most SSOGs are cloud genes and might be important contributors to the appearance of novel genetic material in pangenomes. An understanding of SSOGs could thus provide insights into cloud genes and generally into the evolutionary dynamics that shape pangenomes, contributing to an ongoing debate (Baumdicker and Kupczok 2023).
Species-specific genes have mostly been studied in eukaryotes where they can be associated with organismal novelties and species-specific traits (Light et al. 2014), and can be important for adaptation (Khalturin et al. 2009; Santos et al. 2017). Research in eukaryotes is starting to paint a coherent picture of the evolutionary origins of SSOGs (Tautz and Domazet-Lošo 2011; Andersson et al. 2015; Prabh and Rödelsperger 2019). We now know that they can arise entirely “de novo,” from genomic sequences that are noncoding/nongenic (McLysaght and Guerzoni 2015; Van Oss and Carvunis 2019; Bornberg-Bauer et al. 2021) or from extensive sequence divergence beyond recognition (Vakirlis et al. 2020b; Weisman et al. 2020). SSOGs can also result from a combination of divergence, de novo emergence, and reuse of parts of existing protein-coding genes in alternative reading frames (McLysaght and Hurst 2016; Prabh and Rödelsperger 2019).
Although most of our understanding about SSOGs and the mechanisms that give rise to them comes from eukaryotes, much less is known about them in prokaryotes. Frequently termed “ORFans,” prokaryotic SSOGs share some of the same properties as those in eukaryotes, such as shorter length and higher AT content (Daubin and Ochman 2004a). The dynamic nature of prokaryotic genomes and the known pervasiveness of HGT create additional opportunities for SSOG evolution. One hypothesis is that SSOGs initially evolve in phages or other “selfish” genetic elements and are then transferred to bacteria (Fig. 1B; Daubin and Ochman 2004b). Although it has been 20 years since this hypothesis was proposed, evidence to support it is limited (Cortez et al. 2009), and other studies failed to find equally convincing traces of the viral origin of SSOGs (Yin and Fischer 2006; Yomtovian et al. 2010).
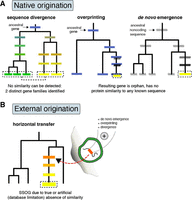
Evolutionary routes to SSOGs in prokaryotes. (A) Native origination through sequence divergence, as well as de novo emergence from entirely noncoding regions (known as de novo emergence) or from coding regions in alternative reading frames (known as overprinting). Overprinting can also be succeeded by gene duplication, such that both genes are then encoded in different regions. Darker shading represents transition from noncoding state to a coding one. Different colors represent differences in sequence similarity between homologous genes or in the same gene over time. (B) Origination in phages, plasmids, or integrative elements by various mechanisms such as de novo birth, overprinting, or divergence, and subsequent transfer to prokaryotic genomes. Because of either technical limitations or rapid divergence, similarity to the source of such externally originated genes might be lost, which would result in them being perceived as species-specific. Additionally, remodeling of existing genes, often in combination with overprinting and sequence divergence, can lead to SSOGs (not shown here).
An alternative explanation to SSOGs being of foreign origin is that they are of native origin (Fig. 1A; Daubin and Ochman 2004b). As for eukaryotic SSOGs, rapid coding sequence divergence, frameshifting mutations, rearrangements, or a combination of the above could explain some of the genes lacking similarity, including entirely species-specific ones (Yu and Stoltzfus 2012; Lobb et al. 2015). Additionally, SSOGs could emerge de novo either from nongenic regions or from already coding ones but on an alternative reading frame, the latter known as overprinting (Delaye et al. 2008; Ardern 2023). As in eukaryotes, pervasive transcription and translation occurs in prokaryotes and may generate raw material that natural selection can shape into a functional protein (Wade and Grainger 2014; Smith et al. 2022; Wacholder et al. 2023). Artificial random peptides have been shown to readily evolve rudimentary functionality after a few rounds of selection (Tenson et al. 1997; Knopp et al. 2019, 2021), highlighting the potential of functional de novo genes to evolve in natural prokaryotic populations as well. Compared with eukaryotes, the constrained genome size and the limited nongenic space of prokaryotes impose different constraints (Kirchberger et al. 2020). Nevertheless, there is recent support for de novo gene origination in prokaryotes: An analysis of taxonomically restricted genes from the genus Bacillus could identify homologous, noncoding regions in a genome of another genus for almost one-third of them, supporting abundant de novo origination (Karlowski et al. 2023). Furthermore, a recent study of E. coli showed that “remodeling events,” that is, fusions of alternative reading-frames of segments of existing genes, are a potent source of entirely new protein sequences (Watson et al. 2022).
Finally, SSOGs can also result from annotation errors, because they are typically detected by comparative genomics approaches. These in turn rely on the automatic prediction of protein-coding open reading frames (ORFs) and sequence similarity searches between species, both potential sources of artifacts in the form of spurious ORFs and missed similarities.
To confidently assign a gene as species-specific, genome data on related species must be abundant. Recent sequencing efforts, in particular using metagenomics in which the whole community of a sample is sequenced, now provide a dense coverage of the sequence space (Nayfach et al. 2021a; Chibani et al. 2022; Coelho et al. 2022; Pavlopoulos et al. 2023). These advancements also highlighted that many genes fall into few large protein families and that there is a long tail of singleton families that have low diversity (Coelho et al. 2022). Furthermore, metagenomic data have been used to detect novel protein families with as-yet-unknown functions that occur in multiple species (Rodríguez del Río et al. 2024). The function of a large fraction of the microbial protein universe remains unknown, and these unknown sequences are often species-specific (Vanni et al. 2022); thus, abundant novelty can be discovered among them.
One particularly well-sampled environment is the human gut, in which pangenomes of the residing species have already been constructed (Almeida et al. 2021). Those pangenomes contain the information of whether a gene family is found in one or multiple species, allowing direct SSOG prediction. We build on these data, implementing further filtering steps to remove families with homology with other species, to identify putative SSOGs in the gut microbiome and to study them systematically. By looking for patterns in large-scale comparisons, we attempt to disentangle the evolutionary origin of SSOGs (Fig. 1) to understand whether they originate mostly externally, as suggested before, and to search for evidence of de novo evolution.
Results
SSOGs are widespread in pangenomes of human gut prokaryotes
To study prokaryotic SSOGs (Fig. 1), our first goal was to establish a conservatively defined SSOG catalog. We chose the human gut environment, an extensively studied niche harboring thousands of known prokaryotic species. Recently, a comprehensive catalog of genomes from prokaryotes of the human gut was released, in which the genomes were annotated and analyzed with a common pipeline (Almeida et al. 2021). In that study, 286,997 genomes were clustered into 4644 species based on 95% identity over at least 30% of their length. Additionally, the Unified Human Gastrointestinal Protein (UHGP) catalog was clustered into homologous families at different sequence similarity cut-offs. We used the most loosely defined protein families as the starting point of our analysis (version 1.0 UHGP-50, built using a 50% identity cut-off) to identify homology with a high sensitivity. By applying a stringent pipeline of sequence-similarity searches, we filtered the initial data set consisting of more than 600 million proteins grouped in 4.7 million families. We predicted almost 3.3 million species-specific proteins, grouped into about 630,000 families (Methods) (see Fig. 2A), hereafter referred to as SSOGs. Unless stated otherwise, our analyses use one representative per cluster, as defined in the UHGP-50 catalog.
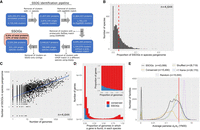
Large scale-identification of species-specific orphan genes (SSOGs) in the human gut microbiome. (A) The main steps of the computational workflow of similarity searches. (B) Distribution of the SSOG proportion in a given species’ pangenome. The red dashed line denotes the distribution mean. (C) SSOG number strongly correlates with the number of genomes available for a given species. (D) Distribution of percentage of genomes in which a gene is present for SSOGs and conserved genes. Only species with at least 10 genomes are included (n = 1369). The inset plot shows the same data but as relative proportion in each bin. (E) Distribution (60 bins) of the average pairwise omega (dN/dS) per family for SSOGs (solid black line), intraspecific alignments of conserved genes (orange), and three negative controls (for details, see Methods). The red line marks dN/dS = 1, which corresponds to neutral evolution.
We find an average of 4.7 SSOGs per genome and an average of 135 SSOGs per species. The latter represents an average of 2.6% of a given species’ pangenome, that is, the entire gene repertoire of the species (Fig. 2B). The data set contains only 28 Archaea species, and they harbor almost twice as many SSOGs as bacterial ones: on average, 224 SSOGs per species (6.5%) and 10.9 SSOGs per genome. The underrepresentation of Archaea in sequence databases could lead to the artifactual identification of species-specific genes, because closely related species have not been sampled yet.
For all species, the number of SSOGs in a given pangenome correlates strongly with the number of genomes available for that species within the entire genome data set provided by Almeida et al. (Spearman's Rho = 0.61, P < 2.2 × 10⁻¹⁶) (Fig. 2C; Almeida et al. 2021), as well as with pangenome size (Rho = 0.66, P < 2.2 × 10⁻¹⁶, partial correlation controlling for number of genomes Rho = 0.39, P < 2.2 × 10⁻¹⁶) (Supplemental Fig. S1A), suggesting that each genome introduces novel SSOGs into the pangenome. Indeed, we find that SSOGs are rare within their respective species. Most of them are shared by at most 10% of genomes, that is, belonging to the cloud fraction of prokaryotic pangenomes (Fig. 2D). Compared with conserved genes, namely, all non-SSOGs, SSOGs are strongly overrepresented among accessory genes (Supplemental Fig. S2). Although this has been reported before in E. coli (Yu and Stoltzfus 2012), our analysis demonstrates that this is a general feature of the human gut microbiome and potentially of prokaryotic SSOGs in general. Although SSOGs are widespread (we find them in 94% of all gut species and in all species with at least 10 genomes), they represent only a small fraction of the gene repertoire of a particular species, and they tend to be rare.
We observe variability across taxonomic groups: Some bacterial taxonomic classes have markedly higher SSOG percentages than others, with Coriobacteriia representing the lower (avg. 0.7%) and Alphaproteobacteria the higher (avg. 5.4%) extremes (see also Table 1; Supplemental Fig. S3A). Next, we investigated the impact of metagenome assembled genomes (MAGs) on SSOG numbers. Species with a high proportion of MAGs have comparable SSOG percentages as species with many isolate genomes (Supplemental Fig. S1B), and species with lower-quality assemblies show no trend toward more SSOGs (Rho = −0.04, P = 0.0024) (Supplemental Fig. S1C). This suggests that the estimated SSOG numbers are not driven by assembly artifacts.
Statistics of SSOGs and their various subsets for the nine most represented taxonomic classes
SSOGs predicted here lack homologs and tend to be rare within their respective species, which raises the question of whether they might be spurious ORFs incorrectly annotated as protein-coding. True protein-coding genes under selection typically exhibit a higher rate of synonymous polymorphisms (dS) compared with nonsynonymous polymorphisms (dN), that is, dN/dS < 1, a pattern that is not expected for spurious ORFs. To test the impact of spurious ORF prediction on our SSOG data set, we estimated dN/dS from intraspecific multiple sequence alignments for each of the 154,650 SSOG families with at least two nonidentical sequences. Because of the high degree of genetic similarity, a dN/dS ratio could be obtained for only 43,089 of them (see Methods). The distribution of values is clearly shifted to the left of one, with a median of 0.38 and a mean of 0.63 (Fig. 2E), suggesting that a considerable proportion of these genes are under selection. To provide further evidence, we calculated dN/dS in the same manner for three different negative noncoding controls (see Methods). We observe that randomly generated sequences do not result in meaningful alignments, leading to elevated dN/dS estimates, whereas the other two controls are centered close to one. Crucially, the dN/dS distribution of SSOGs is distinct from all three controls (all Wilcoxon test P-values < 2.2 × 10⁻¹⁶), has a second peak of values below one that is missing from controls, and has significantly more genes without any nonsynonymous mutations (i.e., with dN/dS = 0; 7.4% vs. 2.7%, 0.9%, and 0% for the controls). As a positive control, we also calculated dN/dS on intraspecific alignments of conserved genes in nine randomly selected species (see Methods) (Fig. 2E). This distribution is closer to zero (median 0.14) but extensively overlaps with that of SSOGs and, to a lesser degree with that of noncoding controls. The observation that the dN/dS distribution of SSOGs lies in between that of random negative controls and of conserved genes could be explained by the scenario that SSOGs are mostly young genes, in which selection did not have time to act yet. Alternatively, SSOGs might be a mixture of true genes and annotation artifacts, which could also result in this observation. Importantly, our findings are robust to the choice of methodology, as we obtained similar results when estimating selection using a different approach and tool (see Methods) (Supplemental Fig. S3B), as well as when only including genes >300 nt in the analysis (n = 21,203, leaving out half of our data set) (Supplemental Fig. S3C).
These dN/dS values should be interpreted with two important points in mind. First, even when selection is present, the power to detect it is limited within the same species (Kryazhimskiy and Plotkin 2008). Second, young, newly evolved genes can be functional even when they show no evidence of selection (Vakirlis et al. 2022; Wacholder et al. 2023). Thus, although we cannot conclude that all SSOGs with a dN/dS close to one are not functional genes, this analysis strongly supports that, at the very least, a considerable SSOG proportion is under selection and thus functional. Based on the above analysis, we define a high-confidence set of SSOGs with a dN/dS < 0.5 (n = 25,355), which are unlikely to contain annotation artifacts.
SSOGs and their proteins have some distinct and some common properties compared to conserved genes
In both prokaryotes and eukaryotes, species-specific genes are known to exhibit certain characteristics, such as shorter length, which set them apart from conserved genes (Yomtovian et al. 2010; Tautz and Domazet-Lošo 2011; Vakirlis et al. 2018). These gene and protein properties might provide clues about the evolutionary origins of SSOGs. To compare SSOGs to conserved genes, we next turned to properties of genes and proteins across species.
Across every taxonomic class, SSOGs are significantly shorter than conserved genes, at about one-third of their average length (Fig. 3A), and this is true also for the high-confidence set (Supplemental Fig. S4A). There is only a weak correlation between the average length of SSOGs and conserved genes per species (Rho = 0.14, P < 2.2 × 10⁻¹⁶). Average GC content of SSOGs in a given species is highly similar to that of conserved genes (avg. 0.45 vs. 0.46) (Fig. 3B), exhibiting an almost one-to-one correlation (Rho = 0.96, P < 2.2 × 10⁻¹⁶). This also holds for the high-confidence set (same averages; Rho = 0.92, P < 2.2 × 10⁻¹⁶) (Supplemental Fig. S4B), when only considering SSOGs >800 nt (Supplemental Fig. S4C), and when only including isolate genomes (Supplemental Fig. S1D), demonstrating that this similarity is not explained by the existence of spurious ORFs. We see the same trend when restricting the analysis to Archaea (Supplemental Fig. S4D), as well as when comparing SSOGs and conserved genes within individual species (Supplemental Fig. S4E). The trend also applies to GC content in the third synonymous position of codons (GC3s) (see Supplemental Fig. S4F) and for CpG content (Supplemental Fig. S5). This observation fits the native origination scenario, in which SSOG GC content simply reflects the genome's GC content, but in theory at least it would also be consistent with external transfer followed by rapid adaptation of the incoming gene's GC content to that of the host genome (Lawrence and Ochman 1997).
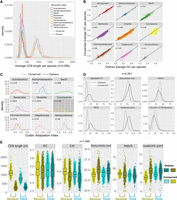
Properties of SSOGs compared with conserved genes. (A) Density plots of the average length of SSOGs and conserved CDSs in each species, grouped by each of the nine best represented taxonomic classes of our data set. Only classes with at least 50 species are included. (B) Average GC content of SSOGs and conserved genes in each species, grouped by taxonomic class (same classes as in A). (C) Same comparison as in A (average per species), but with codon adaptation index (CAI) values as predicted by the CAIJava tool. All Wilcoxon test P-values < 10−4. (D) Comparison of proteins encoded by conserved genes and SSOGs, in terms of average percentage of protein predicted to self-aggregate, biosynthetic cost, percentage of protein predicted to be helical, percentage of protein predicted to be disordered (ISD), isoelectric point of a protein, and percentage of proteins with at least one transmembrane domain. All Wilcoxon test P-values < 2.2 × 10⁻¹⁶. (E) Comparison of some of the properties found in panels A–D in 1369 species with at least 10 genomes in which SSOG and conserved gene categories are split into cloud (present in 10% of genomes or less) and noncloud. All plots show points or distributions of average values per species.
In certain origination scenarios, including de novo evolution and recent transfer from external sources, SSOGs are expected to show suboptimal codon usage relative to the rest of the genome. We thus calculated the codon adaptation index (CAI), a measure of how frequently optimal codons (at the level of an entire genome) are used by each gene, for all genes of the representative genome of each species (see Methods). Across taxonomic classes, SSOGs have consistently lower CAI values compared with conserved genes (all Wilcoxon test P-values < 10−4) (Fig. 3C). This is also true when controlling for the length differential between SSOGs and conserved genes by subsampling conserved genes to obtain a set of comparable mean length to that of SSOGs (Methods) (Supplemental Fig. S6A). It is also true for both the high-confidence set and for the set of SSOGs >800 nt (Supplemental Fig. S6B,C). For E. coli, we also calculated CAI based on codons used in reference sets of highly expressed genes and found similar results (Methods) (Supplemental Fig. S7).
At the protein level too, SSOGs exhibit distinguishing characteristics (Fig. 3D). Compared with conserved genes, they are, on average, richer in intrinsically disordered regions; a smaller percentage of their sequence is found in helical regions; a smaller percentage of them contains transmembrane (TM) domains; and they are more aggregation-prone, have a higher biosynthetic cost, and a higher isoelectric point (the latter was also observed for de novo genes in yeast and fly) (Blevins et al. 2021; Montañés et al. 2023). All these differences hold when considering each taxonomic class individually (Supplemental Fig. S8). However, when controlling for the length differential between SSOGs and conserved genes, intrinsic disorder and TM domains are no longer significantly different (Supplemental Fig. S9). Note that novel genes in membrane-related roles have previously been suggested for eukaryotes such as budding yeast (Vakirlis et al. 2020a; Tassios et al. 2023) and for prokaryotes (Sberro et al. 2019). Here we find that even though SSOGs have a similar nucleotide composition to conserved genes on average, they differ in key properties, such as their length, codon usage, and some protein structural features.
Because we observed before that most SSOGs are cloud genes, that is, rare in the species in which they are found (Fig. 2D), we next asked if cloud SSOGs differ from noncloud SSOGs. We find that cloud SSOGs have a lower CAI, higher GC content, and fewer helices than remaining SSOGs (Fig. 3E). The observed trend for GC content differs between SSOGs and conserved genes: Whereas conserved cloud genes have a lower GC content than remaining conserved genes, SSOG cloud genes have higher GC content than the remaining cloud genes. Furthermore, the GC content of SSOG cloud genes is higher than the GC content of conserved cloud genes. These trends also hold when analyzing taxonomic classes separately (Supplemental Fig. S10) and when zooming in on individual species (Supplemental Fig. S4C).
Cloud genes could be explained by a continuous inflow of genes by HGT, which is expected to result in conserved cloud genes. We believe that SSOG cloud genes have different evolutionary origins than conserved cloud genes owing to their difference in the trends for GC content. SSOG noncloud genes have low GC content, which can be explained by de novo origination from noncoding regions, which typically have lower GC content than coding regions, or by rapid divergence, which could lead to the accumulation of A and T (Hershberg and Petrov 2010). Rapid divergence and transcriptional silencing by the histone-like nucleoid structuring protein (H-NS) have been described for genes of low GC content in Salmonella (Papanikolaou et al. 2009), which might also apply to the SSOGs with low GC content.
SSOGs of likely phage origin have distinct characteristics
Here, SSOGs are defined as species-specific genes with respect to other prokaryotes; however, it is possible that they are the result of recent HGT from bacteriophages. To identify such transferred genes, we conducted similarity searches of the SSOGs against two recently published phage protein databases, the metagenomic gut virus catalog (MGV) (Nayfach et al. 2021b) and the gut phage database (GPD) (Camarillo-Guerrero et al. 2021), that are partially overlapping but mostly complementary in terms of protein sequence content.
We find that SSOGs are strongly depleted in similarity matches to phage proteins relative to conserved genes, ranging from three- to sixfold using different parameters and cut-offs (Methods) (Fig. 4A). At low stringency, 5.1% of SSOGs have similarity to viral sequences compared with 63% of conserved genes. SSOGs are also depleted, when separately searching against either MGV or GPD (Supplemental Fig. S11A), when using the high-confidence set, and when excluding short sequences (<800 nt) for which similarity searches often fail (Supplemental Fig. S11B,C). Binning conserved genes according to the number of species in which they are found (a proxy of their evolutionary age) reveals a pattern of increasing proportion of genes with similarity to phages (Fig. 4B), regardless of the stringency criteria applied (Supplemental Fig. S11D). This result also holds when only including isolate genomes (Supplemental Fig. S11E), suggesting that it is independent of assembly quality. This pattern is inconsistent with a scenario under which most SSOGs arrive through HGT from bacteriophages, which we would expect to produce either the inverse trend, if only a fraction of HGT is ultimately retained, or no trend at all in the case of a constant rate of transfer and retention.
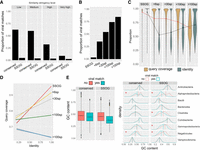
Properties of genes with viral matches. (A) Proportions of conserved proteins and SSOGs with statistically significant similarity matches to viral proteins at four different significance thresholds. (B) Proportions of proteins with statistically significant similarity matches to viral proteins (at high stringency level), binned according to the number of prokaryotic species (sp.) in which a homolog can been found (size of the prokaryotic protein family). (C) Query (prokaryotic protein) coverage and sequence identity of the top statistically significant matches (all hits with E-value < 10−5 are included), binned according to the number of species in which a homolog can be found. Lines connect distribution means. (D) Correlation between query coverage and identity in sequence matches involving genes belonging to different sizes of protein families, same data as in C. (E) Distributions of GC content of genes with and without a statistically significant viral match (high stringency), among all SSOGs and conserved genes (boxplot) and among the nine best represented taxonomic classes (density plots). A red asterisk denotes a nonnegligible effect size in difference of means calculated by Cliff's Delta (Delta estimate > 0.15). Note that in Alphaproteobacteria and Negativicutes, the difference exists also in conserved, but the effect size there is much weaker compared with SSOGs (−0.21 vs. −0.62 and −0.2 vs. −0.42).
As both GPD and MGV databases have been assembled with the use of automated annotation pipelines, it is possible that they may contain bacterial contigs that are falsely classified as coming from phages. To control for such a bias, we confirmed our findings by searching a third phage genome database (Shah et al. 2023), which is smaller but manually curated and was built from samples taken from infant guts. We observed similar patterns as for the larger databases, confirming that the proportion of SSOGs (and more generally, less conserved genes) with similarity to phage proteins is considerably lower than that of widely conserved genes (Supplemental Fig. S11F,G). The overall proportion of matches in all gene groups is lower compared to GPD and MGV, but that is expected given the difference in size (10,000 phage OTUs vs. 190,000 and 142,000 in MGV and GPD, respectively).
The trend of increasing percentage of phage matches with increasing conservation across species prompted us to investigate further. To dissect the evolutionary dynamics, we plotted, across age categories, the query coverage and percentage of identity of the best phage match per protein as defined by E-value, without filtering any high-identity hits (Fig. 4C). This revealed that matches to SSOGs are very close to 100% identity, and coverage with both averages decreases with age. Yet, although the coverage distribution shows a clear downward trend, the identity distribution becomes bimodal with age, with one peak staying near 100% and another one initially appearing at ∼35% and then increasing. Furthermore, although identity, and coverage are strongly correlated for viral hits of SSOGs, this correlation gradually decreases with age (Fig. 4D). One explanation for these trends is that a subset of genes has only recently been transferred between phages and bacteria, whereas another subset consists of older transfers that have undergone divergence, truncation, or both.
We previously established that SSOGs mirror conserved genes’ averages in crucial aspects such as nucleotide composition. Given the evidence that a small percentage of SSOGs appears to have been recently transferred from phages, we might expect that they exhibit distinguishing signatures at the level of their nucleotide composition. Indeed, we find that overall, SSOGs with similarity to phage proteins have markedly lower GC content than those without (Fig. 4E), congruent with what is known for phage GC content relative to their hosts (Almpanis et al. 2018). The effect of this difference is practically negligible when looking at conserved genes, albeit staying statistically significant owing to the large sample size. These results hold when only genes >800 nt are considered (Supplemental Fig. S11H) and when using the high-confidence SSOG set (Supplemental Fig. S11I). We thus conclude that there is a low proportion of SSOGs with hits to phages that appear distinct from the remaining SSOGs.
Additionally, we computationally detected prophage regions in all genomes using Phigaro (Starikova et al. 2020). We find that a very low proportion of SSOGs reside within prophages (13,174/3,329,206; 0.3957%), which is slightly higher than the overall proportion of prophage genes among all genes (2,029,792/625,255,471; 0.3246%). Thus, although phage origin might play a role, this can only explain a small fraction of SSOGs.
A subset of SSOGs shows evidence of native origination
We next asked whether it is possible to trace the origin of some SSOGs within their native genome. We first searched for SSOGs that might have originated via utilization of an alternative reading frame of an existing gene following duplication or HGT. To this end, we performed similarity searches of six-frame translations of all SSOG coding sequences against six-frame translations of all coding sequences of their native genome. We found that only a small percentage, 1.34% of SSOGs (8477 representative SSOGs), have at least one significant match to a conserved gene (i.e., non-SSOG), excluding gene pairs with overlap (Fig. 5A), with 75% of matches being on the reverse strand of the conserved gene. Out of all SSOGs matching conserved genes, 64% (5397) match a single conserved gene, 26% (2238) match two conserved genes, and the rest (10%) match three or more. SSOGs matching more than one conserved gene correspond to chimeras, similar to what was found for E. coli (Watson et al. 2022).
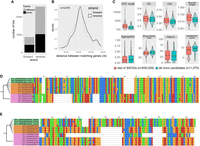
Evidence for native origination of SSOGs. (A) Distribution of frame and strand of similarity matches between SSOGs and conserved genes within each genome. (B) Distribution of genomic distances between matching SSOG and conserved gene when these are found on the same contig. (C) Comparisons of de novo candidates to remaining SSOGs: distributions of CAI, terminal species-level branch length, proportion of protein sequence predicted to be aggregation-prone, biosynthetic cost, CDS length, GC content, protein percentage estimated to fold into a helix, and isoelectric point. Details of statistical comparisons can be found in the main text. Helix% comparison Wilcoxon test P-value = 0.0064. Aggregation% P-value = 0.26. Branch length and CDS length are shown on log scale for visibility. Outliers are not shown as points but are represented by the violin plot range. (D) Alignment of a de novo candidate gene from Hafnia paralvei (green; three nonidentical members of an eight-member family are shown) to its orthologous regions in genomes of the same species that do not have annotated homologs (orange) and genomes of its closest outgroup species (pink). Identical sequences have been removed from the alignment. The average pairwise dN/dS for this family is 2.5. (E) Same as D, but for another candidate from an unnamed species of the order Opitutales. Three nonidentical members of a family of six members are shown. Five orthologous loci (i.e., from five genomes) that contain a long insertion have been removed for visual purposes, and an additional 37 orthologous loci are not shown again for visual purposes (their sequences are almost identical to those shown in the figure). The average pairwise dN/dS for this family is 3.4. Alignments were generated with MAFFT (Katoh and Standley 2013) and visualized with Jalview (Waterhouse et al. 2009).
Approximately 10% of SSOGs with hits (n = 892) match conserved sequences on the forward strand and the same frame as the conserved gene. Thus, these should be considered as false positives, that is, non-SSOGs. Such cases can be explained by the impact of the database size on the calculation of the E-value, which is used to filter the matches. The remaining 7585 SSOGs with matches are strong candidates for having evolved out of alternative reading frames of preexisting native proteins, although they could also be explained by annotation errors of overlapping ORFs. For SSOGs with matches on the same contig (n = 1515, 20%), the genomic distances between the SSOG and the matching gene show a unimodal distribution with a mean of 131 kb (Fig. 5B).
We next turned to evidence for native origination that can be found in closely related species. A robust approach for the detection of de novo gene emergence is the identification of the orthologous genomic region in outgroup genomes. By examining such regions, it is possible to establish that a gene has evolved out of previously noncoding sequences or out of an already coding locus, either coexisting with or replacing an ancestral gene. To detect both such cases, we identified a given SSOG's orthologous region in outgroup genomes of the same species and those of its closest relative species using strict orthology criteria (see Methods) and discarded cases with missed orthologous ORFs that might have eluded the automatic annotation pipeline. We required that orthologous noncoding regions be identified in at least one genome of the closest outgroup species and at least one genome of the same species. We applied this relaxed criterion (compared with the frequently used criterion of two outgroup species) because in bacterial evolution synteny breaks down faster than eukaryotic evolution, which makes identification of orthologous regions challenging when moving further away from the focal genome. We thus identified 1075 SSOGs that can be considered candidates for de novo emergence from noncoding regions (Supplemental Table S1).
Closely related species are more likely to share genomic synteny and hence to satisfy our conservative criteria. The de novo candidates originate from 718 different species, and these have shorter terminal branches in the tree compared with the species of the remaining SSOGs (means of 0.03 and 0.071 substitutions per site; Wilcoxon test P-value < 2.2 × 10⁻¹⁶; Cliff's Delta 0.28) (Fig. 5C). Thus, they represent the evolutionarily younger end of the spectrum of all de novo gene candidates. Comparisons of gene and protein properties support this view (Fig. 5C). De novo candidates are overall shorter (Delta = 0.28; P < 2.2 × 10⁻¹⁶), have lower CAI (Delta = 0.18; P = 3.64 × 10⁻¹¹) and GC content (Delta = 0.1; P = 8.5 × 10⁻⁹), and have slightly higher isoelectric points (Delta = 0.15; P = 10−13) and biosynthetic costs (Delta = 0.13; P < 2.2 × 10⁻¹⁶). Because mutation is biased toward AT, most bacteria have lower GC content in noncoding regions (Hershberg and Petrov 2010), which can explain the lower GC content in de novo candidates compared with the remaining SSOGs. Additionally, de novo candidates are depleted in matches to viral proteins compared with the rest of SSOGs (Fisher's test odds-ratio: 40.9, P-value = 3.5 × 10⁻¹⁶). Two examples of alignments of de novo candidates to their orthologous regions in outgroup genomes can be found in Figure 5, D and E. The translated sequences can be found in Supplemental Figure S12, together with two additional examples and their translations (selected for visualization based on their short alignment length). In both these cases, based on the multiple stop codons present in the orthologous sequences, we can cautiously infer that the ancestral sequence likely did not contain an ORF and thus lacked coding potential.
Operon-like arrangements provide functional hints for some SSOGs
Assigning a function to SSOGs is notoriously difficult. For instance, when searching a published database of mutant phenotypes for thousands of prokaryotic genes coming from 46 strains from 36 different species (Price et al. 2018), including many from our data set, we found no phenotypes for any of the SSOGs (see Methods).
Even if no experimentally derived functional information has been determined for a SSOG, its genomic context can still offer some clues as to what its role might be in the cell (Osbourn and Field 2009; Coelho et al. 2022). We thus examined the neighbors of all SSOGs (not only representative ones) in all genomes harboring SSOGs to identify cases of operon-like arrangements in which one functional term is present in multiple neighbors (see Methods). We identified 1905 SSOGs in operon-like arrangements, belonging to 405 distinct protein families. For these, at least three out of the six closest neighbors (i.e., three downstream and three upstream) have a common Gene Ontology (GO) term associated. We then looked for enrichment of specific GO terms within the SSOGs against the background of all genes in operon-like arrangements (n = 4,362,138). The most overrepresented specific terms by gene counts are shown in Fig. 6A. The results of the full GO term enrichment analysis can be found in Supplemental Table S2.
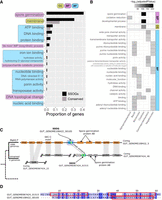
Genomic context offers functional clues of SSOGs. (A) Proportion of SSOGs and conserved genes annotated with a given GO term based on genomic context. These GO terms are those with the highest SSOG proportion and are all significantly overrepresented with an FDR-adjusted P-value < 10−5. The complete results of the GO enrichment analysis can be found in Supplemental Table S2. (CC) Cellular component, (BP) biological process, and (MF) molecular function. (B) Significantly overrepresented GO terms among SSOGs, when analyzing separately genomes of species belonging to each of the nine best represented taxonomic classes. For visualization purposes, only GO terms significantly overrepresented with an FDR-adjusted P-value < 10−5 and found in at least 10% of SSOGs in a class are shown. The complete lists, including for two of the nine classes (Actinobacteria, Vampirovibrionia) for which no enrichment was strong enough to be included in this figure, can be found in Supplemental Table S3 (no enrichment was found for Coriobacteriia). (C) Genomic region around Clostridia species PeH17 SSOGGUT_GENOME108422_00105 and syntenic conservation in its sister species (unnamed; representative genome GENOME056772). Gene names are included in each gene shape. Vertical gray bands connect genes found within the same homologous family. Blue arrows denote SSOGs, and green bands within them represent TM domain encoding segments. (lplA) Lipoate-protein ligase A, (mscL) large conductance mechanosensitive ion channel protein, (gerBA) spore germination protein B1, (Hyp) and hypothetical protein. No annotation was present in the GFF files for the two proteins to the right of the SSOGs, but all four had the same match in InterPro (spore germination protein AB; IPR004761). (D) Pairwise alignment generated by MAFFT of the protein sequences of the two SSOGs highlighted in C. Rectangles mark the positions of predicted TM domains in the two protein sequences.
The term “membrane” was the only cellular component that was found in at least three SSOG neighbors, and it was one of the top enriched terms overall (GO:0016020) (Fig. 6A; Supplemental Table S2). This is intriguing given previous findings linking TM domains to novel genes (Sberro et al. 2019; Vakirlis et al. 2020a). A closer look showed that the membrane enrichment was owing almost exclusively to SSOGs from the class Clostridia. Thus, to account for taxonomic specificities, we repeated the analysis separately for each of the nine best represented taxonomic classes and found limited overlap between the GO terms enriched within each class (Fig. 6B; Supplemental Table S3).
At the level of biological processes, one of the strongest enrichments was “spore germination,” and this enrichment too was specific to Clostridia (Fig. 6B). Of the seven Clostridia SSOGs related to this term (Supplemental Table S4), four had at least one TM domain (57%), including three that are also annotated as “membrane.” We examined in detail one large family (n = 137) with “spore germination” annotation and strong selection evidence (dN/dS = 0.25; see Methods). A closer look at the wider genomic region of this family showed clear evidence of syntenic and functional conservation with its closest neighboring species (unnamed species) (see Fig. 6C). Furthermore, another SSOG, also encoding TM domains, is found at the predicted orthologous locus in the closest species. Alignment of these two SSOG protein sequences of similar size reveals traces of similarity and an almost complete overlap of the TM domains in each sequence (Fig. 6D). This intriguing finding suggests that these two genes are homologous and likely functionally similar but have diverged beyond detectable similarity, as observed before (Vakirlis et al. 2020b; Weisman et al. 2020). Overall, this analysis suggests that SSOGs might evolve different functions in different lineages and point toward spore germination as a particularly relevant process in Clostridia.
Discussion
Species-specific genes are ubiquitous. Across the tree of life, they may be seen as one end of a taxonomic gradient, with universally conserved genes at the other end and genes restricted to smaller taxonomic groups as intermediates (Tautz and Domazet-Lošo 2011). Some recent large-scale studies have focused on novel prokaryotic gene families present in more than a single species and have firmly demonstrated their functional relevance and hinted toward crucial habitat-specific roles (Sberro et al. 2019; Coelho et al. 2022; Pavlopoulos et al. 2023; Rodríguez del Río et al. 2024). The question of the evolutionary origin of novel prokaryotic families, however, was mostly left unexplored. This question is best approached by focusing on orphan genes that are species-specific and thus represent the most recently evolved form of genetic novelty.
Here we predict SSOGs in the human gut microbiome and show that these SSOGs evolved owing to multiple routes. We find that a low proportion of them have matches in viral proteins. Thanks to the extensive, high-quality sampling of both the prokaryotic and the viral diversity of the human gut, we can be relatively confident that our findings are not significantly biased by limitations of the data set. Additionally, SSOGs with viral matches have a distinct composition compared with the remaining SSOGs (Fig. 4E), which is inconsistent with the external origination scenario for most SSOGs. Conversely, there is a low proportion of genes, in which we can recover evidence for de novo origination from noncoding sequences. These SSOGs also differ from the remaining SSOGs by being shorter, having lower GC%, and having lower CAI (Fig. 5C), although these differences likely also reflect the fact that we can only detect the very youngest of the de novo originated orphans. Nonetheless, these results are also inconsistent with de novo origination from noncoding sequences as a dominant source behind SSOGs. This leaves the native processes of sequence divergence, overprinting, and remodeling as the next best candidates to explain SSOG origination.
Our analyses go deeper than previous efforts to understand the origin of SSOGs in prokaryotes. Our results are consistent with a previous study in which a low fraction of viral matches has been found (Yin and Fischer 2006). In contrast, earlier inquiries into the origin of bacterial orphans from Daubin and Ochman (2004a,b) investigated compositional similarity between orphans in E. coli and bacteriophage sequences known at the time and proposed acquisition from bacteriophages as a reasonable explanation for orphan origin. Our analysis of some of the same features (GC content, CpG content) across thousands of species, for which data were not available at the time, shows instead that orphans closely match their native genomes’ composition. Cortez et al. (2009) proposed in 2009 that integrative elements are the major source of ORFans in an analysis of 119 prokaryotic genomes, based on their identification of clusters of genes of atypical composition. But their evidence is tangential and relies on the fact that some of the identified ORFans (39% of 8428 genes) are found in such clusters of genes with atypical composition, likely to be derived from integrative elements. Furthermore, results on the crucial point of the composition of ORFans themselves are missing from this study. As there is little overlap between the 119 species surveyed by Cortez et al. (entire prokaryotic diversity) and here (more than 4000 species of the human gut microbiome), it might be the case that external origination of orphans is more prevalent in species found in different environments.
If most of SSOGs found here were indeed “grown locally,” by what mechanisms did that happen? Extensive sequence divergence is surely one of them. In a previous study, extensive remote homology searches of novel genes in metagenomes using hidden Markov model profiles retrieved significant similarity for ∼15% of them (Lobb et al. 2015). Even more sensitive methods might reveal the true percentage to be even higher. In eukaryotes, different approaches have found that many, perhaps most, genes without similarity might have simply diverged beyond recognition (Vakirlis et al. 2020b; Weisman et al. 2020). Although low syntenic conservation prohibits meaningful application of this method to our data set, our example in Figure 6, C and D, clearly shows that syntenic conservation can occur. Divergence of gene duplicates within the same genome can result in additional SSOGs, either by repurposing the same reading frame or by using alternative ones. The percentage of SSOGs sharing similarity to conserved genes from the same genome that we report here is likely an underestimate, as divergence beyond detectable similarity is potentially at play at this level as well. A crucial question, outside the scope of this study, is how often this absence of statistically significant similarity should be taken as absence of functional similarity. The alternatives to divergence are de novo gene birth and overprinting. Have these mechanisms been neglected in prokaryotes? In our view, at least within the environment of the human gut, this seems to be the case. Notably, the human gut environment is well sampled and allows us to detect SSOGs with confidence. Nevertheless, this does not give us a good representation of the entire prokaryotic diversity. For example, gut bacteria are generally anaerobic and strongly associated with the eukaryotic hosts. Thus, their ecology is very different from environmental bacteria, and the extent to which our findings generalize to other environments is currently unclear. Future studies that leverage the ever-increasing global metagenomic sequences will be useful to tackle that question. Additionally, experimental evidence shows that the emergence of functional proteins via de novo gene evolution from noncoding sequences can provide adaptation in E. coli (Babina et al. 2023; Frumkin and Laub 2023). Thus, de novo evolution may be more plausible, and prevalent, than usually assumed.
A mostly native SSOG origin does not diminish the role of HGT in prokaryotic evolution. Indeed, when one looks at how the percentage of viral matches increases as the number of prokaryotic species in a family increases (Fig. 4), it is evident that novel genes can spread between phages and bacteria. It has been known for a long time that phages also invent novel genes (Sabath et al. 2012; Pavesi et al. 2013; Fremin et al. 2022). An intriguing question for future studies then is whether there is any qualitative or quantitative difference between the processes that surely occur in bacteria and phages or whether both simply serve as input to a common pool of novel sequences that is accessible via HGT and is maintained under selective pressures or neutrally (Wolf et al. 2016; Iyengar and Bornberg-Bauer 2023).
Another important but difficult question is whether our estimates of the number of SSOGs is a good approximation of the true number of entirely novel, functional coding sequences unique to each species. Given that SSOGs are short, it is reasonable to assume that some of them are prediction artifacts (Yu and Stoltzfus 2012). This is an important limitation, and we have taken several steps to mitigate it. We have relied on preexisting annotation consistent for all genomes. Note that using consistent, robust annotations is an important measure against spurious results when it comes to estimating species-specific genes (Weisman et al. 2022). Furthermore, we have considered any sequence with an EggNog match as conserved, but it is possible that an evolutionarily constrained gene might converge toward an existing domain or motif. Finally, we have excluded from SSOGs any recently emerged gene that was transferred to another species shortly after its emergence. Notably, novel small ORFs and overlapping reading frames have been omitted in the automatic annotation. Nevertheless, it is plausible that some homologs of the shorter SSOGs could exist in other species but might have been missed by the annotation pipeline owing to their short length, which would push SSOG numbers higher. For all these reasons, the presented SSOGs are expected to contain both false positives and false negatives.
Additionally, one can assume that such misassignments are even higher for MAGs, which also contribute to the UHGP. First, assembly and binning methods might fail to reconstruct particular species, especially when they are highly diverse. Such missing species could result in false-positive orphans in related species. Nevertheless, on average, 86% of the reads from a human gut metagenome map to the genomes that are the raw material of the UHGP (Almeida et al. 2021), suggesting that the species diversity in the human gut is well covered. Second, errors at the binning step could lead to the inclusion of wrong genes into MAGs, which then appear to be SSOGs. To mitigate this effect, we have excluded contigs without conserved genes. Third, MAGs can be incomplete and are known to be biased against mobile elements (Maguire et al. 2020). Note that completeness and contamination cutoffs have been applied to the MAGs included in the UHGP (Almeida et al. 2021); however, these estimates are based on marker genes and can underestimate the actual values (Chen et al. 2020; Meziti et al. 2021). The bias against mobile elements particularly impacts the accessory genome, in which also SSOGs can be found, potentially leading to a bias against SSOGs. Fourth, misassembly or incomplete contigs can lead to the prediction of spurious ORFs. We examined the impact of this bias by comparing SSOG numbers for species with different assembly qualities and cannot find an association (Supplemental Fig. S1C). We also observe that MAG-related artifacts do not influence our results, for example, the GC content or the proportion of viral matches (Supplemental Figures S1D, S11E). Taken together, the estimated SSOG numbers do not seem to be driven by the inclusion of MAGs in the data set.
When looking for signatures of protein-coding selection at the intraspecies level, we found that SSOGs lie, on average, between noncoding negative controls and conserved positive ones, while largely overlapping both. To be as stringent as possible, we use dN/dS to define a high-confidence SSOG set, yet we must stress that these dN/dS values and their comparisons should not be used to definitively accept or reject the functional status of a given SSOG. The reasons, as already discussed, are the technical limitations of dN/dS at the intraspecific level (Kryazhimskiy and Plotkin 2008), and that a recently originated gene can be functional without any selection signatures (Vakirlis et al. 2022; Wacholder et al. 2023) because there might not have been time to accumulate enough mutations for selection to be detectable. What is more, intraspecific alignments of conserved genes have, on average, four times as many sequences than those of SSOGs, increasing the statistical resolution and leading to better detection. They are also guaranteed to contain cases of HGTs, which would also bias dN/dS values toward those of inter-specific comparisons. Furthermore, it is difficult to extrapolate the percentage calculated among the small subset of SSOGs with enough genetic diversity to all the SSOGs, given that it leads to a bias: SSOGs that have existed long enough to have the necessary diversity are more likely to be functional than those restricted to only one genome. Yet, conservation across multiple genomes, or even species, is not always infallible: For example, conserved gene families have been built that were found to be composed of spurious ORFs located on the noncoding strand of another conserved gene family (Eberhardt et al. 2012). Nevertheless, functional evidence for such “antisense proteins” shows that the noncoding strand also provides potential for evolutionary innovation (Ardern et al. 2020), making it difficult to distinguish functional and nonfunctional antisense proteins.
Our estimate of the number of SSOGs should be viewed with caution and with all the aforementioned caveats in mind. However, the primary focus of our study is not the number of SSOGs per se but rather what we can glean about their origins when subjecting them to comparisons. Notably, using the dN/dS defined high-confidence set or a more stringent length cut-off does not impact our main conclusion, demonstrating that our results are not driven by false-positive SSOGs. In any case, future studies might provide further experimental insights into the expression and function of the SSOGs described here. Approaches incorporating transcriptomics, ribosome profiling, and high-throughput functional assays might be especially informative. To distinguish functional expression from pervasive transcription and translation, analysis of differential expression of SSOGs under different conditions is of particular interest.
We have identified more than half a million SSOGs, and even if a large part of them turns out to be spurious, we would still be left with thousands of candidates that could be expressed as entirely novel proteins within the boundaries of the human body. It is more and more acknowledged that pangenome diversity is important in the human gut microbiome and might have consequences for human health (Vatanen et al. 2019). SSOGs within strains of human gut bacteria could perhaps interact with the host, contributing to immune or inflammatory responses and potentially even disease.
Although such a link of prokaryotic SSOGs to human health can only be speculative, their overall importance for niche-specific adaptations is far from it. Although the cloud of rare genes has been found to be an integral part of all pangenomes, the evolutionary processes that generate and maintain cloud genes are not well understood, and explanations range from niche-specific genes to a constant inflow of transient genes (Baumdicker and Kupczok 2023). Particularly, a class of transient genes with effectively instantaneous gene replacement rates has been suggested to contribute to the cloud fraction of microbial pangenomes (Wolf et al. 2016). Here we highlight that SSOGs are an important component of prokaryotic pangenomes and, especially, of the cloud fraction, suggesting that they are mostly transient. Thus, most SSOGs might be removed quickly after their origination, whereas some of them could prove adaptive and persist in the population, resulting in noncloud SSOGs and—after longer evolutionary time—even in conserved genes. To gain a comprehensive picture of prokaryotic evolution, we thus need to understand where SSOGs come from, what specific functions they assume, and how they evolve to be maintained in the population.
Methods
SSOG identification
SSOGs were identified as follows: Initially, the UHGP50 v.1 catalog, which is clustered into protein families at 50% identity by Almeida et al. (2021) was parsed, and families with members in more than one species were removed. Next, we removed families with a precomputed EggNOG (Hernández-Plaza et al. 2023) match (based on Almeida et al. data for their representative sequence, i.e., the first in order sequence in the family file). We then performed two similarity searches against the entire NCBI prokaryotic RefSeq database (downloaded January 2022) using DIAMOND (Buchfink et al. 2021) v2.0 blastp with the representative protein sequence of each family as query: first using DIAMOND “fast” mode and removing any sequence that had a significant match (E-value < 0.001), except for sequences with >90% coverage and >95% identity that can reasonably be expected to be derived from the same species as the query sequence, present in RefSeq. The same search was then performed for the remaining sequences using the “ultrasensitive” mode, and the same criteria were applied. A final search was performed using BLASTP (Altschul et al. 1997) against the entire UHGP50 protein catalog (consisting of the representative protein sequences) with an E-value cut-off of 10−5 and “-max_target_seqs 1000,” and any candidate SSOG sequence matching with a protein from a different species was filtered out. The remaining sequences constitute the set of SSOGs. To mitigate contamination, we also filtered out candidate SSOGs found on contigs that only contain SSOGs (only the representative sequence was tested for this). All the non-SSOG families (i.e., those removed in the previous steps) were henceforth considered “conserved,” and we counted the number of unique species represented within it.
Prediction of CDS and protein properties
Protein secondary structure and intrinsically disordered regions were predicted using the RaptorX Predict_Property package v1.01 (Wang et al. 2016) in default mode. Protein self-aggregation was predicted using PASTA 2.0 (Walsh et al. 2014) in default mode with an energy threshold of −5, and the percentage of the protein expected to form aggregate-prone regions was used. TM domains were predicted using Phobius (Käll et al. 2007). The CAI was calculated for all sequences using the CAIJava (Carbone et al. 2003) tool, which does not require a reference gene set, with arguments “-s -i 15 -k 3 -g” and, for E. coli sequences, additionally using the codonw tool downloaded from http://codonw.sourceforge.net/ and the EMBOSS cai tool, both using their respective E. coli set of reference genes. GC% and GC% in the third synonymous codon position was calculated with codonw. CpG dinucleotide frequency was calculated in R with the SeqinR (Charif and Lobry 2007) package. Biosynthetic cost was calculated by averaging the Akashi and Gojobori (Akashi and Gojobori 2002; Barton et al. 2010) amino-acid scores for each protein sequence. The isoelectric point was calculated with the R package peptides (Osorio et al. 2015).
Similarity searches
We downloaded two gut phage protein sequence databases in FASTA format, MGV (Nayfach et al. 2021b) and GPD (Camarillo-Guerrero et al. 2021). Additionally, protein sequences were extracted from phage genomes assembled by Shah et al. (2023) and downloaded from http://copsac.com/earlyvir/f1y/gbks/ in May 2022. Similarity searches against viral protein databases were conducted using DIAMOND blastp in “very sensitive” mode. The criteria applied to define significant hits, in increasing order of stringency, were the following: identity <95% & E-value < 10−3 (low), identity <95% & E-value < 10−5 (medium), 95% > identity >40% & query coverage % >40% & E-value < 10−5 (high), and 95% > identity > 60% & query coverage >70% & E-value < 10−5 (very high). To identify SSOGs potentially derived from conserved native genes, we also conducted similarity searches of SSOGs against all annotated CDS in their respective genomes using NCBI's TBLASTX with 80% identity, 70% query coverage, and an E-value of 10−5.
Genomic and functional features
We predicted the presence of prophages in all 286,997 prokaryotic genomes by running Phigaro (Starikova et al. 2020) in default mode. We then counted the number of SSOGs and non-SSOGs that are situated within the predicted prophage genomes.
All general genomic data such as assembly quality, as well as taxonomic information, were retrieved from the “genomes-all_metadata.tsv” table provided by Almeida et al. (2021). The species-level phylogenetic tree used was taken from the file “bac120_iqtree.nwk” provided by the authors. All pangenome related statistics were calculated using the pangenome files already available from UHGP and accessed through links such as ftp://ftp.ebi.ac.uk/pub/databases/metagenomics/mgnify_genomes/human-gut/v1.0/uhgg_catalogue/MGYG-HGUT-000/MGYG-HGUT-00001/pan-genome/, where “MGYG-HGUT-00001” is a species code. Protein/CDS IDs (e.g., GUT_GENOME255189_00514) were matched to unique gene locus IDs (e.g., epsF_2) used within pan-genomes by Almeida et al. (2021), and then, statistics such as number of genomes in which a gene is present were extracted by the relevant tables provided by the authors (“genes_presence-absence_locus.csv” files). The categorization of core (defined at 90% presence) and accessory genes was also retrieved from these directories (“accessory_genes.faa” files). To count the number of SSOGs per pangenome, we counted the number of unique gene locus IDs, in each species, that we had classified as SSOGs (one name identifies a single locus and is present only once, even if found in multiple genomes) (provided by Almeida et al. 2021).
To identify SSOGs among those prokaryotic genes included in the fitness browser (Price et al. 2018), we downloaded the protein sequences of fitness browser proteins as well as raw t-score tables for each species from the fitness browser website. We then used DIAMOND to search for similarity between our SSOG proteins and those fitness browser proteins. We considered a hit as significant if it had E < 10−5, identity >70%, and 80% query coverage. We then filtered matches to retain only those to fitness browser proteins with statistically significant fitness effects, defined as t-score > 4 in at least one condition (as detailed in the original publication). To only consider unambiguous cases, we looked only for SSOGs matching to a unique fitness browser protein.
Identification of orthologous regions and definition of de novo candidates
For each SSOG, we searched for its orthologous region in two sets of genomes: in every genome of the same species without the SSOG and in every genome of its closest neighboring species, as defined by the species-level phylogeny provided by Almeida et al. (2021). To identify the orthologous region in each genome, we took the immediate upstream and downstream SSOG neighbors and searched whether a homolog, that is, a member of the same family, exists in that genome. We only considered cases in which a single homolog existed; that is, cases with paralogs were discarded. If both a homolog of the downstream and the upstream neighbor existed in a given outgroup genome and these were separated by at most one gene, we considered the region as conserved in synteny. For a SSOG to be characterized as a de novo candidate, such a conserved syntenic region had to be identified in at least one genome of the same species and at least one genome from the closest species. Additionally, we discarded regions in which an unannotated ORF with at least 80% query coverage and 60% similarity to the SSOG existed in the syntenic region of the outgroup species. Finally, we discarded 23 candidates that had similarity matches to conserved genes from the same genome (see Similarity Searches subsection above).
Identification of operon-like genomic regions
To identify operon-like gene arrangements, we scanned all UHGG genomes and took advantage of the existing GO annotations available from the InterPro searches performed by the authors. For every gene of every genome, we examined its three immediate downstream and three immediate upstream neighbors. If all seven genes were on the same contig and had the same orientation and at least three of the neighbors shared at least one GO term annotation, then that gene was considered to be in an operon-like arrangement, and the GO term was associated to that gene. Note that we merged the terms GO:0016020 and GO:16021 to be consistent with the current version of GO, after we noticed that terms related to the membrane that came up later in our analyses had been tagged as obsolete and collapsed into the general term “membrane.” All associations (one gene can have more than one if more than one GO term is found more than three times) for all genes were formatted into a custom annotation file. This file was used as the background annotation, together with a list of SSOGs in BiNGO v3.0.3 (Maere et al. 2005) to perform the overrepresentation analysis. The options used were hypergeometric test, Benjamini–Hochberg FDR correction, and a 0.05 threshold. For analysis restricted to each taxonomic class, the same was performed but only including genes from species of a given class.
In the case of SSOG GUT_GENOME108422_00105 (representative of a family of 135 proteins), our analysis of the syntenic region showed the gene to be present at the exact orthologous locus as SSOG GUT_GENOME123088_00522 (representative of a family of 866 members), both belonging to species PeH17 (GUT_GENOME014725). Aligning the two representative sequences gave results consistent with the criteria used by Almeida et al. (2021) for protein clustering: The sequences align with 100% identity but only over their first 25 residues (46% of the length of the shortest sequence), whereas the rest of the sequences align very poorly. However, all other protein sequences of the GUT_GENOME123088_00522 family align nearly perfectly with any protein from the GUT_GENOME108422_00105 family, with no gaps and with 94% identity. Indeed, aligning all CDS sequences from both families together results in an alignment with average pairwise percentage identity of 97% (calculated using the goalign tool and its compute distance method with the pdist metric). Furthermore, a nucleotide alignment of the representative sequences showed that their difference at the protein level is owing to a frameshift. Overall, these two families, with the exception of the representative sequence of GUT_GENOME123088_00522, would have been expected to cluster together given the parameters used by Almeida et al. (2021) (linclust with 80% coverage and 50% identity).
Selection signatures, quantification, and statistical analysis
All statistics were done in R v3.6.2 (R Core Team 2023). Plots were generated using ggplot2 (Wickham 2011). All statistical details including the type of statistical test performed and exact value of n (n represents either number of genomes or number of genes) can be found in the Results and figure legends. Boxplots show median (horizontal line inside the box), first and third quartiles of data (lower and upper hinges) and values no further or lower than 1.5 times the distance between the first and third quartiles (upper and lower whisker). No methods were used to determine whether the data met assumptions of the statistical approaches. Subsampling of conserved genes to control for length difference to SSOGs was performed with replacement, using a customized version of inverse transform sampling. We sampled conserved genes belonging to each species separately, and only species with at least 100 conserved and at least 10 SSOGs were included (n = 3769). The length median of the sampled conserved genes was 228 nt, and the mean was 305 nt, compared with 225 nt and 300 nt in SSOGs, respectively. To detect signatures of selection acting on protein-coding sequences, we first generated DNA multiple sequence alignment of the CDSs of 154,650 SSOG families with at least two nonidentical sequences. We then used the yn00 executable of PAML (Yang 2007) to calculate dN, dS, and omega (dN/dS) with the Yang and Nielsen (2000) method. The program was run with default values and was given as input in the aforementioned MSA. The dN, dS (with their estimated standard errors), and dN/dS values were obtained for all pairwise combinations of members of each family. For each family, to only take into account statistically meaningful comparisons, we kept only those comparisons in which dS > 0 and standard error of dN/dS < 1. We then calculated the mean for a given family from the remaining pairwise comparisons. We also calculated single alignment and tree omega using HyPhy (Kosakovsky Pond et al. 2020) under the MG94xREV model (using the steps provided by the authors here: https://stevenweaver.github.io/hyphy-site/tutorials/current-release-tutorial/#estimate-a-single-alignment-wide, but without optimizing the branch lengths) and a phylogenetic tree generated with RAxML next generation (RAxML-NG) (Kozlov et al. 2019) with the following command: “raxml-ng ‐‐msa {INPUT ALIGNMENT} ‐‐model GTR+G ‐‐search1.” The same analyses (avg. pairwise dN/dS with PAML and omega with HyPhy) were performed on three negative controls based on the initial SSOG MSA: (1) alignments frame-shifted by 1 nt (i.e., on the +1 frame) using goalign (goalign trim -s -n 1 followed by goalign trim -n 2) (Lemoine and Gascuel 2021) and for which in frame stop codons were removed, (2) alignments in which entire alignment columns were randomly shuffled using the Multiperm (Anandam et al. 2009) tool with the option ‐‐conservation=none, and (3) completely randomized alignments in which each sequence was randomly shuffled separately. The conserved, positive controls were generated as follows. We selected randomly one species from each of the nine best represented taxonomic classes that had between 100 and 200 available genomes, so as to have enough sequences in the alignments while keeping the analysis tractable. The following species were selected: GUT_GENOME000122, GUT_GENOME001519, GUT_GENOME113559, GUT_GENOME001122, GUT_GENOME286320, GUT_GENOME147777, GUT_GENOME220136, GUT_GENOME096385, and GUT_GENOME009256. Available genomes were downloaded from UHGG v1. In the genomes of each species, we retrieved genes with known assigned names (e.g., mtaB), which correspond to conserved genes with known functions. Genes were grouped based on their exact name. The sequences of each gene were then aligned in a codon-aware manner using codonalign from the goalign tool to account for frameshifts. The rest of the analysis was performed as for SSOGs above.
Data access
Source data that can be used to reproduce the figures are available as Supplemental Material (Supplemental Data S1, S2). An R script that allows to generate the main figures of this manuscript is provided as Supplemental Code.
Competing interest statement
The authors declare no competing interests
Acknowledgments
We thank Daniel Tamarit and Franz Baumdicker for valuable comments on an earlier version of the manuscript. We acknowledge funding from the Deutsche Forschungsgemeinschaft in the framework of the SPP2141 to A.K. (KU3610/2-1). The research project was supported by the Hellenic Foundation for Research and Innovation (H.F.R.I.) under the “3rd Call for H.F.R.I. Research Projects to support Post-Doctoral Researchers” to N.V. (project no. 7330). This research was supported in part through high-performance computing resources available at the Kiel University Computing Centre.
Author contributions: A.K. and N.V. conceived the study. A.K. and N.V. wrote the manuscript. A.K. supervised the study. N.V. performed the analyses.
Footnotes
-
[Supplemental material is available for this article.]
-
Article published online before print. Article, supplemental material, and publication date are at https://www.genome.org/cgi/doi/10.1101/gr.278977.124.
- Received January 11, 2024.
- Accepted June 12, 2024.
This article is distributed exclusively by Cold Spring Harbor Laboratory Press for the first six months after the full-issue publication date (see https://genome.cshlp.org/site/misc/terms.xhtml). After six months, it is available under a Creative Commons License (Attribution-NonCommercial 4.0 International), as described at http://creativecommons.org/licenses/by-nc/4.0/.


