
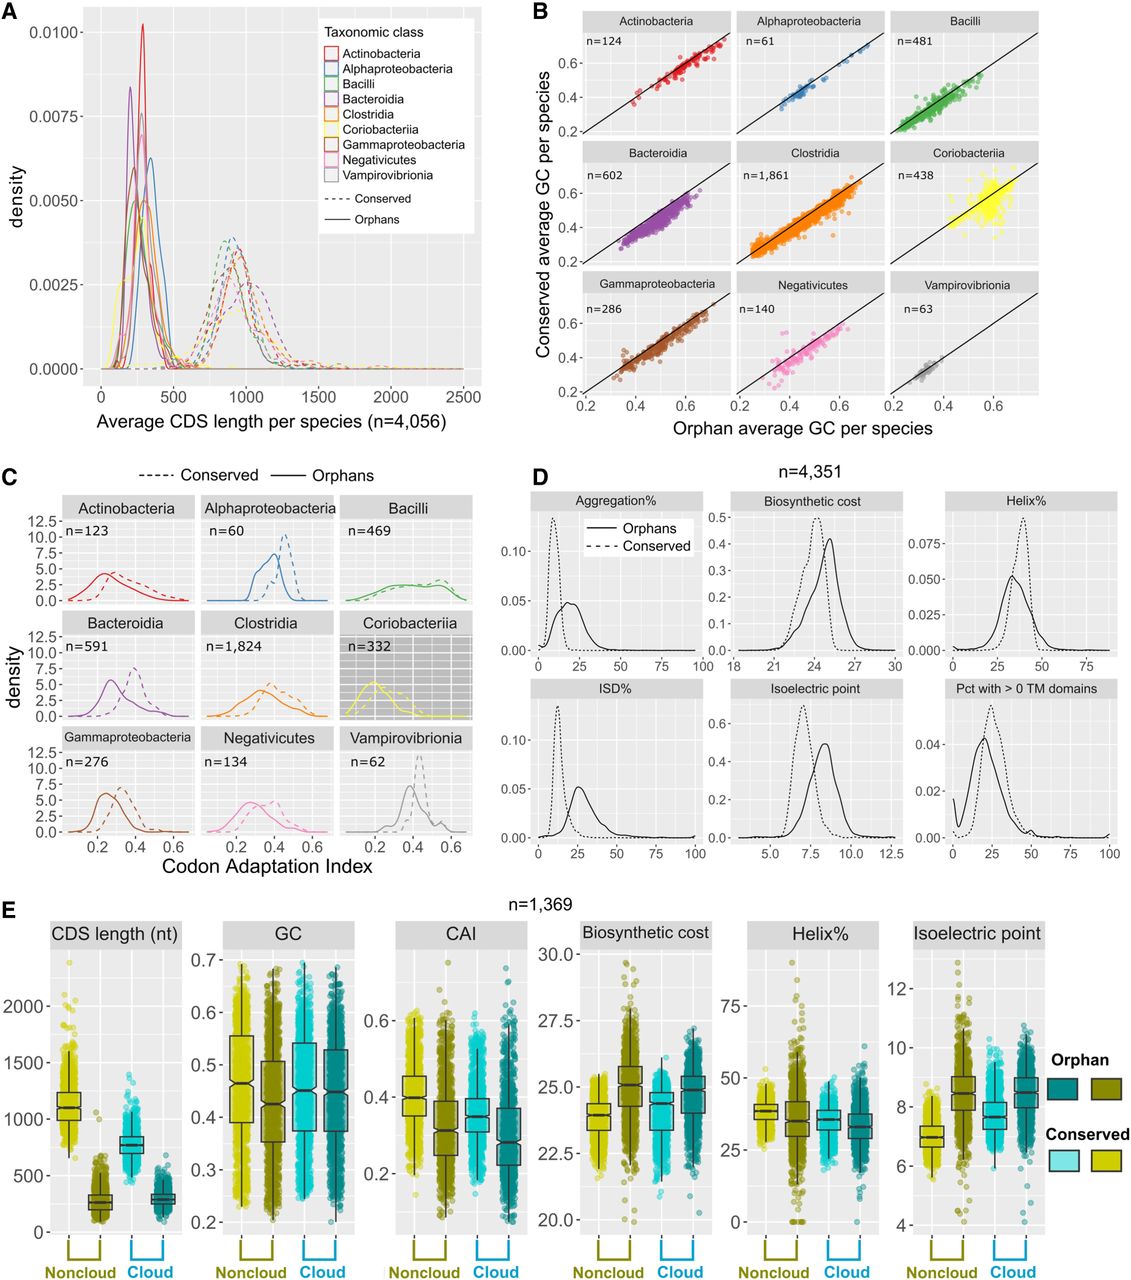
Properties of SSOGs compared with conserved genes. (A) Density plots of the average length of SSOGs and conserved CDSs in each species, grouped by each of the nine best represented taxonomic classes of our data set. Only classes with at least 50 species are included. (B) Average GC content of SSOGs and conserved genes in each species, grouped by taxonomic class (same classes as in A). (C) Same comparison as in A (average per species), but with codon adaptation index (CAI) values as predicted by the CAIJava tool. All Wilcoxon test P-values < 10−4. (D) Comparison of proteins encoded by conserved genes and SSOGs, in terms of average percentage of protein predicted to self-aggregate, biosynthetic cost, percentage of protein predicted to be helical, percentage of protein predicted to be disordered (ISD), isoelectric point of a protein, and percentage of proteins with at least one transmembrane domain. All Wilcoxon test P-values < 2.2 × 10⁻¹⁶. (E) Comparison of some of the properties found in panels A–D in 1369 species with at least 10 genomes in which SSOG and conserved gene categories are split into cloud (present in 10% of genomes or less) and noncloud. All plots show points or distributions of average values per species.


