
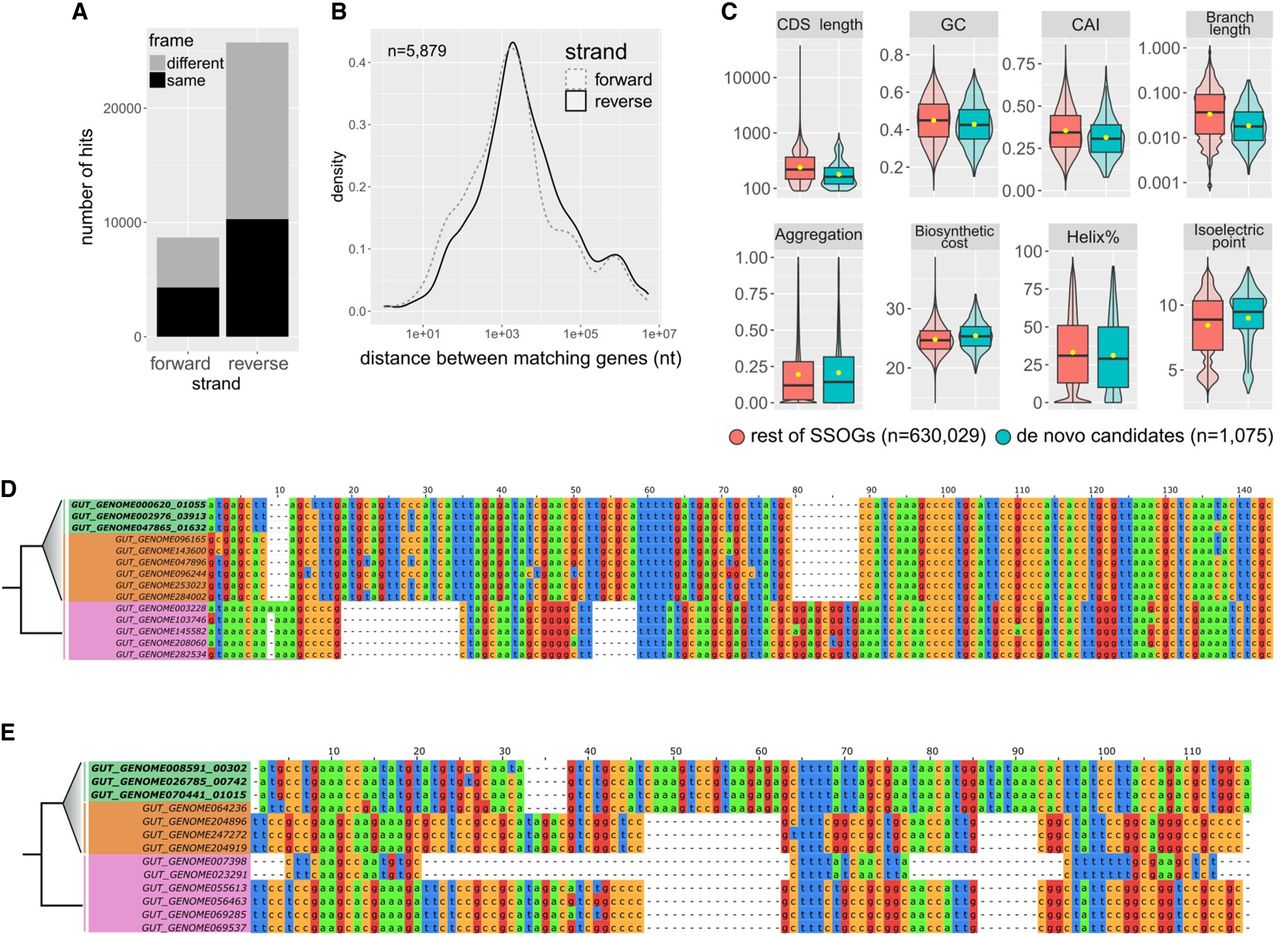
Evidence for native origination of SSOGs. (A) Distribution of frame and strand of similarity matches between SSOGs and conserved genes within each genome. (B) Distribution of genomic distances between matching SSOG and conserved gene when these are found on the same contig. (C) Comparisons of de novo candidates to remaining SSOGs: distributions of CAI, terminal species-level branch length, proportion of protein sequence predicted to be aggregation-prone, biosynthetic cost, CDS length, GC content, protein percentage estimated to fold into a helix, and isoelectric point. Details of statistical comparisons can be found in the main text. Helix% comparison Wilcoxon test P-value = 0.0064. Aggregation% P-value = 0.26. Branch length and CDS length are shown on log scale for visibility. Outliers are not shown as points but are represented by the violin plot range. (D) Alignment of a de novo candidate gene from Hafnia paralvei (green; three nonidentical members of an eight-member family are shown) to its orthologous regions in genomes of the same species that do not have annotated homologs (orange) and genomes of its closest outgroup species (pink). Identical sequences have been removed from the alignment. The average pairwise dN/dS for this family is 2.5. (E) Same as D, but for another candidate from an unnamed species of the order Opitutales. Three nonidentical members of a family of six members are shown. Five orthologous loci (i.e., from five genomes) that contain a long insertion have been removed for visual purposes, and an additional 37 orthologous loci are not shown again for visual purposes (their sequences are almost identical to those shown in the figure). The average pairwise dN/dS for this family is 3.4. Alignments were generated with MAFFT (Katoh and Standley 2013) and visualized with Jalview (Waterhouse et al. 2009).


