
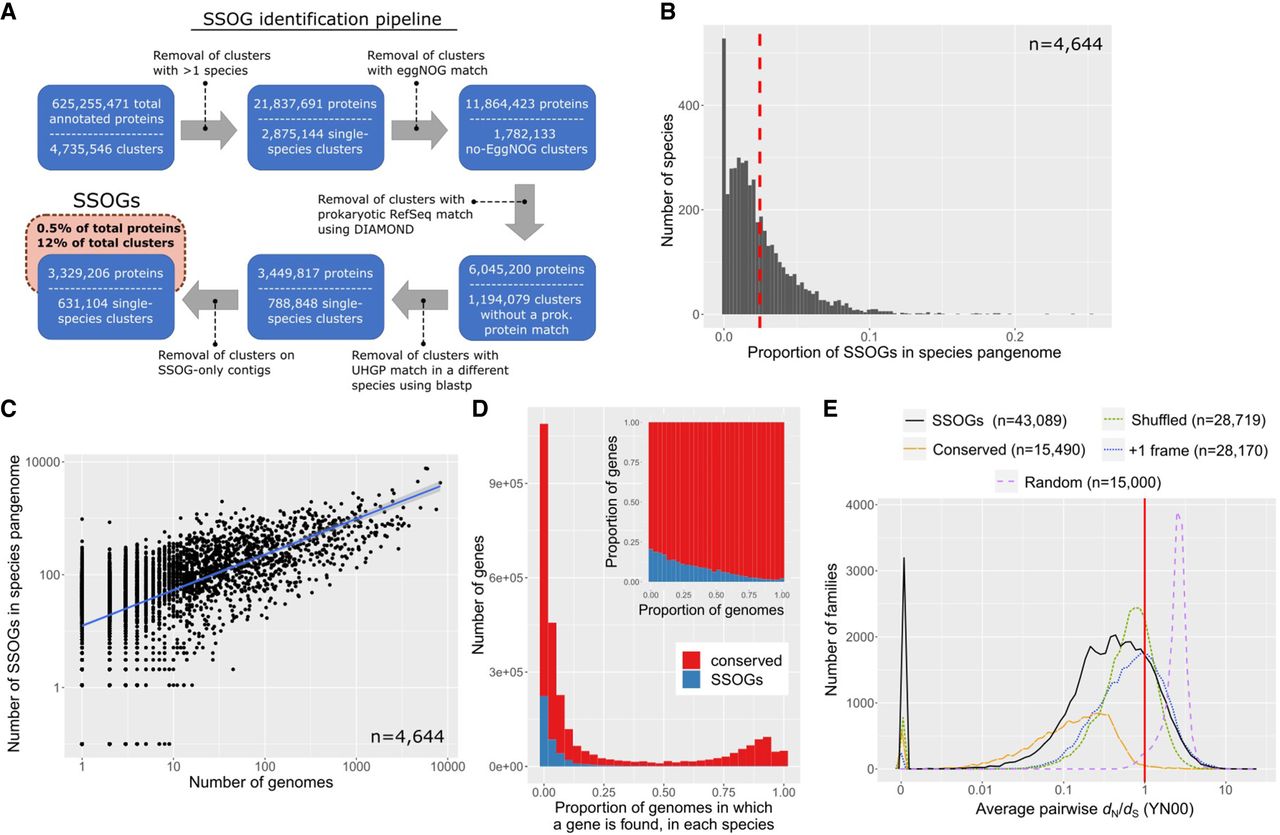
Large scale-identification of species-specific orphan genes (SSOGs) in the human gut microbiome. (A) The main steps of the computational workflow of similarity searches. (B) Distribution of the SSOG proportion in a given species’ pangenome. The red dashed line denotes the distribution mean. (C) SSOG number strongly correlates with the number of genomes available for a given species. (D) Distribution of percentage of genomes in which a gene is present for SSOGs and conserved genes. Only species with at least 10 genomes are included (n = 1369). The inset plot shows the same data but as relative proportion in each bin. (E) Distribution (60 bins) of the average pairwise omega (dN/dS) per family for SSOGs (solid black line), intraspecific alignments of conserved genes (orange), and three negative controls (for details, see Methods). The red line marks dN/dS = 1, which corresponds to neutral evolution.


