
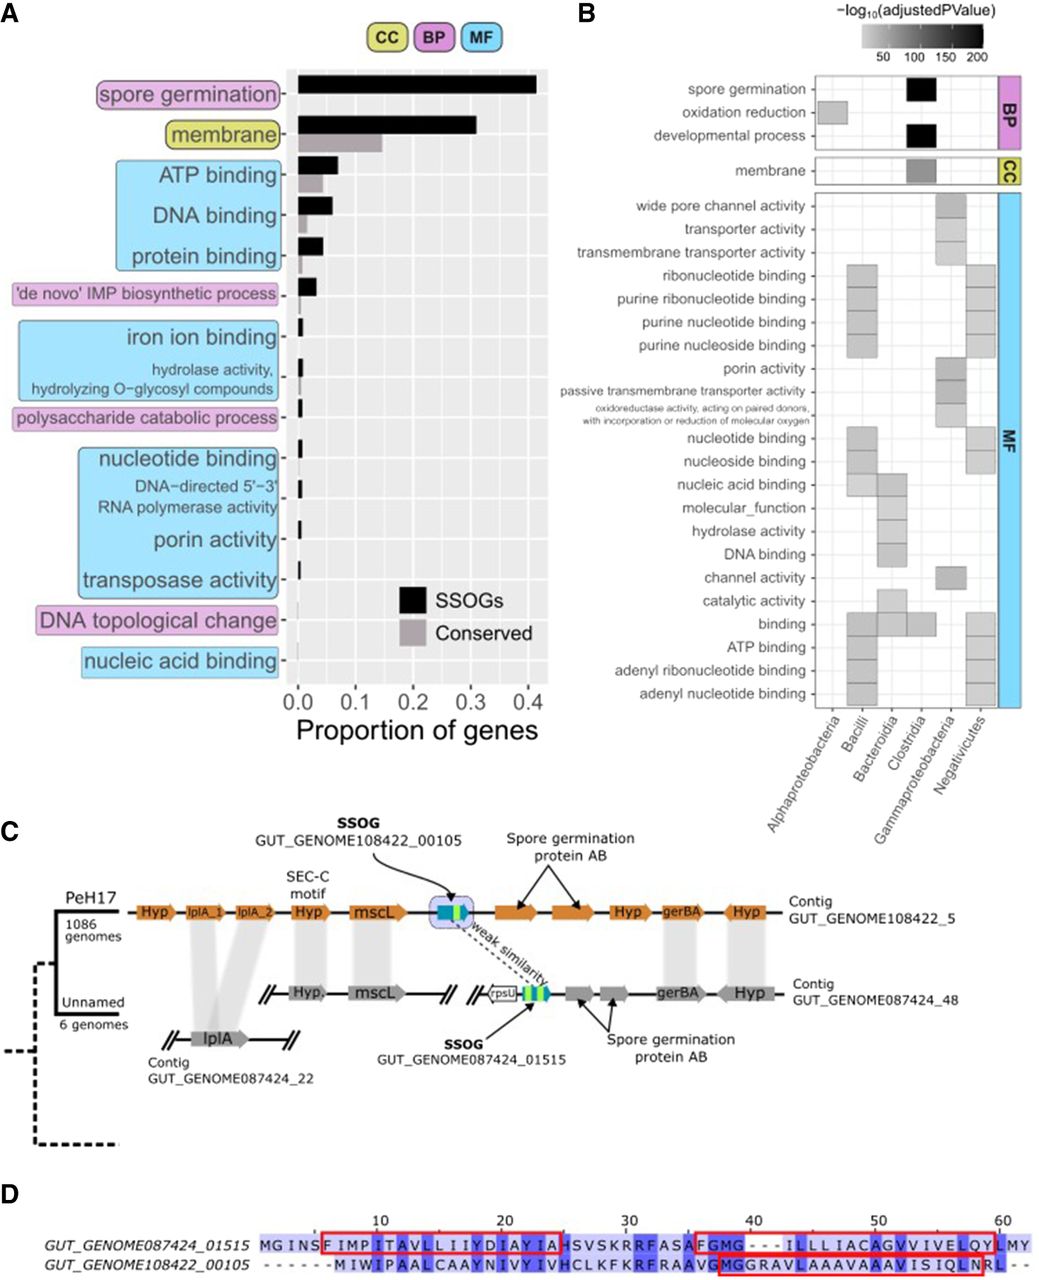
Genomic context offers functional clues of SSOGs. (A) Proportion of SSOGs and conserved genes annotated with a given GO term based on genomic context. These GO terms are those with the highest SSOG proportion and are all significantly overrepresented with an FDR-adjusted P-value < 10−5. The complete results of the GO enrichment analysis can be found in Supplemental Table S2. (CC) Cellular component, (BP) biological process, and (MF) molecular function. (B) Significantly overrepresented GO terms among SSOGs, when analyzing separately genomes of species belonging to each of the nine best represented taxonomic classes. For visualization purposes, only GO terms significantly overrepresented with an FDR-adjusted P-value < 10−5 and found in at least 10% of SSOGs in a class are shown. The complete lists, including for two of the nine classes (Actinobacteria, Vampirovibrionia) for which no enrichment was strong enough to be included in this figure, can be found in Supplemental Table S3 (no enrichment was found for Coriobacteriia). (C) Genomic region around Clostridia species PeH17 SSOGGUT_GENOME108422_00105 and syntenic conservation in its sister species (unnamed; representative genome GENOME056772). Gene names are included in each gene shape. Vertical gray bands connect genes found within the same homologous family. Blue arrows denote SSOGs, and green bands within them represent TM domain encoding segments. (lplA) Lipoate-protein ligase A, (mscL) large conductance mechanosensitive ion channel protein, (gerBA) spore germination protein B1, (Hyp) and hypothetical protein. No annotation was present in the GFF files for the two proteins to the right of the SSOGs, but all four had the same match in InterPro (spore germination protein AB; IPR004761). (D) Pairwise alignment generated by MAFFT of the protein sequences of the two SSOGs highlighted in C. Rectangles mark the positions of predicted TM domains in the two protein sequences.


