
Combinatorial microRNA activity is essential for the transition of pluripotent cells from proliferation into dormancy
- Dhanur P. Iyer1,2,5,
- Lambert Moyon3,5,
- Lars Wittler1,
- Chieh-Yu Cheng1,2,
- Francisca R. Ringeling4,
- Stefan Canzar4,
- Annalisa Marsico3 and
- Aydan Bulut-Karslioğlu1
- 1Max Planck Institute for Molecular Genetics, 14195 Berlin, Germany;
- 2Institute of Chemistry and Biochemistry, Freie Universität Berlin, 14195 Berlin, Germany;
- 3Computational Health Center, Helmholtz Center Munich, 85764 Neuherberg, Germany;
- 4Faculty of Informatics and Data Science, University of Regensburg, 93053 Regensburg, Germany
-
↵5 These authors contributed equally to this work.
Abstract
Dormancy is a key feature of stem cell function in adult tissues as well as in embryonic cells in the context of diapause. The establishment of dormancy is an active process that involves extensive transcriptional, epigenetic, and metabolic rewiring. How these processes are coordinated to successfully transition cells to the resting dormant state remains unclear. Here we show that microRNA activity, which is otherwise dispensable for preimplantation development, is essential for the adaptation of early mouse embryos to the dormant state of diapause. In particular, the pluripotent epiblast depends on miRNA activity, the absence of which results in the loss of pluripotent cells. Through the integration of high-sensitivity small RNA expression profiling of individual embryos and protein expression of miRNA targets with public data of protein–protein interactions, we constructed the miRNA-mediated regulatory network of mouse early embryos specific to diapause. We find that individual miRNAs contribute to the combinatorial regulation by the network, and the perturbation of the network compromises embryo survival in diapause. We further identified the nutrient-sensitive transcription factor TFE3 as an upstream regulator of diapause-specific miRNAs, linking cytoplasmic MTOR activity to nuclear miRNA biogenesis. Our results place miRNAs as a critical regulatory layer for the molecular rewiring of early embryos to establish dormancy.
Cells are equipped with a myriad of stress-response mechanisms to survive under varying environmental conditions. These confer robustness at the cellular and organismal level and are an evolutionary advantage to species. One such mechanism is embryonic diapause, that is, the ability to delay postimplantation development by putting early embryos in a dormant state. Embryonic diapause is a widely used strategy in more than 100 mammalian species, including mice (Renfree and Fenelon 2017; van der Weijden and Bulut-Karslioglu 2021). During diapause, development is transiently paused at the blastocyst stage shortly before implantation, with the embryo residing in uterine crypts in close communication with the maternal tissues until receipt of reactivation cues (Kamemizu and Fujimori 2019). Under laboratory conditions, diapause can be induced in vivo by surgical removal of ovaries or through hormonal manipulations (Paria et al. 1993; Hunter and Evans 1999). However, the laborious nature of these experiments and the high number of animals required remain as barriers against identifying molecular mechanisms of this important environmental adaptation.
We have previously shown that blastocysts and embryonic stem cells (ESCs) can be induced to enter a diapause-like dormant state in vitro through direct catalytic inhibition of the prominent growth regulator MTOR (Bulut-Karslioglu et al. 2016; Iyer et al. 2023). MTOR inhibition (MTORi) reduces global anabolic activities in the cell, including nascent transcription, translation, and basal metabolic rate (Bulut-Karslioglu et al. 2016; Hussein et al. 2020; van der Weijden et al. 2024). Mouse blastocysts can be maintained under MTORi for several weeks in vitro (Bulut-Karslioglu et al. 2016; van der Weijden et al. 2024). Mouse ESCs under MTORi assume a transcriptional and metabolic state highly similar to the in vivo diapaused epiblast, providing another in vitro system to uncover molecular mechanisms of dormancy entry and exit (Boroviak et al. 2015; Bulut-Karslioglu et al. 2016). Both MTORi-paused blastocysts and ESCs maintain developmental competence, as proven by their ability to give rise to live mice or high-grade chimeras, respectively (Bulut-Karslioglu et al. 2016).
Successful entry into dormancy, during diapause and in other systems, requires globally coordinated rewiring of transcriptional, translational, and metabolic activities. Leveraging our in vitro models, we have begun to understand the temporal regulation of dormancy entry during diapause (Iyer et al. 2023; van der Weijden et al. 2024). We have shown that immediate targets downstream from MTOR such as translation are inhibited first, followed by chromatin reorganization and a metabolic shift to lipid usage. Still, our understanding of the molecular regulation of dormancy is rudimentary and remains an obstacle to advancing fundamental knowledge about dormancy that may pave the way to improved in vitro technologies.
microRNAs (miRNAs) are processed small noncoding RNAs that adjust expression levels of target genes mostly by translational interference or mRNA degradation (Bartel 2009). DGCR8 (also known as Pasha in, e.g., Drosophila melanogaster and PASH-1 in Caenorhabditis elegans) is a component of the microprocessor complex that produces pre-miRNAs from their primary transcripts (Herbert et al. 2016). Dgcr8 KO cells are devoid of mature miRNAs that depend on DGCR8-dependent canonical processing but retain other small RNAs, allowing for dissection of miRNA function (Wang et al. 2007; Babiarz et al. 2008; Cirera-Salinas et al. 2017). miRNA-mediated regulation fine-tunes gene expression rather than being the primary determinant of expression levels (Sevignani et al. 2006; Bartel 2009). As such, miRNAs are dispensable in many cell types at the steady state. Dgcr8 KO early embryos develop and proliferate normally in preimplantation stages, and likewise, DGCR8 is dispensable in ESCs at steady state (Wang et al. 2007). However, miRNA activity is critical for adaptive events like cell state transitions and stress response (Kanellopoulou et al. 2005; Cates et al. 2021). miRNAs regulate gene expression in an integrative and combinatorial manner, such that multiple miRNAs may target an individual gene and an individual miRNA may target multiple genes. Furthermore, miRNAs often regulate genes related to cell growth, proliferation, and metabolism, which are essential components of the diapause response, making them prime candidate regulators of dormancy. For these reasons, we hypothesized that miRNAs may play a crucial role during the cellular transition from proliferation to dormancy owing to their mode of action and target gene groups.
The miRNA let-7, which is a regulator of developmental timing in C. elegans (Reinhart et al. 2000), has previously been implicated in regulating diapause in the mouse (Liu et al. 2020), suggesting that miRNA-mediated regulation of developmental timing may span a wide range of organisms from invertebrates to mammals. Diapause-associated miRNAs have been profiled (Zhang et al. 2011; Liu et al. 2012; Wang et al. 2019); however, neither the functional significance of implicated miRNAs nor their role in the larger framework of dormancy has been probed. A broader investigation that integrates miRNAs, their targets, and their upstream regulators is essential to advance our understanding of dormancy, and the lack of it currently poses a barrier against determining critical miRNA-regulated processes.
Expression-based methodologies, in conjunction with miRNA–mRNA target prediction algorithms or pre-established miRNA–mRNA target databases, are frequently used to functionally annotate specific miRNAs of interest. These methods facilitate the inference of regulatory relationships between miRNAs and their target genes (Chang et al. 2020). Although most approaches treat miRNA targets as sets of genes, disregarding the complex gene interactions that they form, network-based approaches can integrate protein–protein interactions (PPIs) and other regulators (e.g., transcription factors [TFs]) to achieve a systemic view of the miRNA-mediated regulatory mechanisms and identify regulatory hubs and functional modules within the network.
Here, via integrated molecular-functional analyses, we aimed to identify diapause-associated miRNAs and their larger role within the larger molecular rewiring during the cellular transition into dormancy.
Results
miRNAs are indispensable for the establishment of paused pluripotency
miRNAs are critical regulators of cell state or fate transitions and have been implicated in mediating the response to various stressors (Leung and Sharp 2010; Olejniczak et al. 2018). We hypothesized that miRNAs may constitute an important regulatory layer in embryonic diapause. We first tested whether miRNAs are functionally required in ESCs transitioning into dormancy via MTORi (Bulut-Karslioglu et al. 2016).
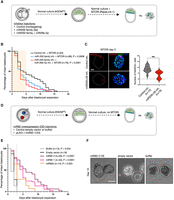
Wild-type and Dgcr8 KO ESCs proliferate at similar rates under standard ESC culture conditions (serum/LIF) (Fig. 1A,B). Inhibition of MTOR in wild-type ESCs greatly reduced proliferation while maintaining morphological features of pluripotent colonies as described previously (Fig. 1A,B; Bulut-Karslioglu et al. 2016). In contrast, Dgcr8 KO ESCs failed to establish dormancy and showed significantly higher apoptosis levels compared with those of the wild type (Fig. 1C). Dgcr8 KO ESC colonies were lost within 2–3 d of MTORi (Fig. 1A,B). Therefore, a specific dependence on DGCR8 arises in ESCs during the dormancy transition. To corroborate this outcome within the setting of embryonic pluripotency, we generated chimeric embryos by aggregating diploid wild-type morulae with either wild-type or Dgcr8 KO ESCs (Fig. 1D). ESCs were labeled with an EGFP reporter randomly integrated into the genome to visualize the ESC contribution to the chimeras (Fig. 1D; Supplemental Fig. S1A,B). Both wild-type and Dgcr8 KO ESCs contributed to the inner cell mass (ICM) (Supplemental Fig. S1A). Dgcr8 KO ESCs generated higher-grade chimeras compared with those of the wild type, suggesting that proliferative Dgcr8 KO ESCs robustly express pluripotency networks (Supplemental Fig. S1B). After embryos reached the blastocyst stage, they were split into two groups and treated with either DMSO or MTORi, and embryo survival was scored over the next days. Embryos with a blastocoel and without any signs of trophectoderm fragmentation were considered intact. As expected, DMSO-treated embryos did not pause and collapsed within a few days, as these culture conditions are not conducive to implantation or stem cell outgrowth (median survival of 4 d and maximum survival of 5 d after blastocyst expansion) (Fig. 1E). MTORi-treated wild-type embryos paused development and survived for a maximum of 12 d in culture under these conditions (Fig. 1D). Dgcr8 KO chimeric embryos showed similar survival compared with that of wild-type embryos under MTORi (Fig. 1E). However, ∼80% of the Dgcr8 KO chimeric embryos showed severely compromised ICM within 4 d of MTORi treatment, closely resembling the depletion of Dgcr8 KO ESCs in culture (Fig. 1E,F; Supplemental Fig. S1B). Some embryos had fragmented ICM remnants, whereas others had ICMs without Nanog expression (Fig. 1E; Supplemental Fig. S1B–D). Thus, DGCR8 is essential for the successful transition of ESCs and early embryos into dormancy in the context of MTORi-induced diapause.
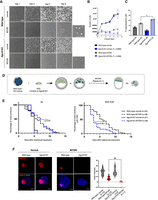
miRNAs are indispensable for the transition of mouse ESCs and embryos into dormancy. (A) White field images of wild-type and Dgcr8 KO mouse ESCs in normal (proliferative) and dormancy conditions. Cells were induced to enter a diapause-like dormant state via MTOR inhibition (MTORi). INK128, a catalytic MTOR inhibitor, was used. Scale bar, 500 µm. (B) Proliferation curves of wild-type and Dgcr8 KO ESCs in normal (proliferative) and dormancy conditions. Cells were plated at low density on six-well plates and counted on the shown days without splitting. The statistical test is a nonlinear regression (curve fit), in which Dgcr8 KO cells have been compared with the wild type for either normal or MTORi conditions. (C) Analysis of apoptosis levels via staining of Annexin V5, followed by flow cytometry analysis. The statistical test is a one-way ANOVA with multiple testing correction. (*) P-value < 0.05. (D) Schematics of morula aggregation experiments and the subsequent testing of embryo pausing efficiency. EGFP-labeled wild-type or Dgcr8 KO mouse ESCs were aggregated with wild-type morulae. These were cultured until the blastocyst stage and then treated with DMSO or MTORi. The number of expanded embryos with or without ICM was counted every day. Embryos with a blastocoel and unfragmented TE were considered intact. Dgcr8 KO ESCs contributed highly to the ICM (Supplemental Fig. S1). (E) Survival curves of chimeric wild-type or Dgcr8 KO embryos under MTORi-induced pausing conditions. (Left) All intact embryos, (right) embryos with a visible ICM. All wild-type embryos retained the ICM during pausing, whereas most Dgcr8 KO embryos lacked it. The statistical test is a Mantel–Cox test, with wild-type paused embryos as a reference data set. (F) Immunofluorescence staining of normal and MTORi-treated (day 3) blastocysts for the epiblast marker NANOG, the trophectoderm marker CDX2, and the DNA stain DAPI. Right panel shows the number of NANOG+ cells in each condition. Nine to 13 embryos were stained in each group. Dgcr8 KO embryos treated with MTORi either lack the ICM or contain NANOG− cells. Scale bar, 20 µm. Statistical test is a one-way ANOVA with multiple testing correction. (**) P-value < 0.01.
Dgcr8 KO ESCs show an aberrant transcriptome and differentiation propensity under MTORi
To get the first insights into how Dgcr8 KO may affect gene expression and pathway usage during MTORi-induced dormancy transition, we performed bulk RNA-seq in wild-type and Dgcr8 KO cells in normal ESC culture and after 48 h of MTORi treatment (Supplemental Fig. S2A). Principal component analysis (PCA) revealed the genetic background as the primary variable (PC1: 79% variance), and MTORi versus normal conditions as the secondary (PC2: 14% variance) (Fig. 2A). Wild-type and Dgcr8 KO cells showed a similar distribution of significantly differentially expressed (DE) genes, with a higher number of DE genes in KO cells (Fig. 2B,C; Supplemental Table S1, of note: Dgcr8 KO cells have overall lower nascent RNA output compared to wild-type cells, Supplemental Fig. S2B,C). Gene Ontology (GO) analysis revealed the aberrant up-regulation of genes promoting the morphology of differentiation in Dgrc8 KO cells, in line with the loss of pluripotent cells as seen earlier (Figs. 2D, 1E; Supplemental Table S2). Metabolic genes were down-regulated in both wild-type and Dgcr8 KO cells implying miRNA-independence (Fig. 2D). In general, a diapause response including reduced transcription and translation is initiated in both wild-type and Dgcr8 KO embryos, yet miRNA-deficient cells deteriorate afterward (Supplemental Fig. S2B,C).
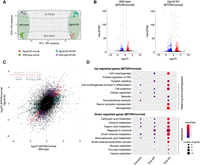
Dgcr8 KO ESCs show an aberrant transcriptome. (A) PCA plot of wild-type and Dgcr8 KO transcriptomes in normal and MTORi (day 2) conditions. (B) Volcano plots showing differentially expressed genes (Padj < 0.05, log2FC > 1) in wild-type and Dgcr8 KO cells in normal and MTORi conditions. Dgcr8 KO shows more DE genes (738 vs. 403 in wild-type, 153 in common) and an overall higher significance level. (C) Scatter plot showing fold change (MTORi/normal) of each gene in wild-type and Dgcr8 KO cells. Dgcr8 KO cells show a wider log2FC range. DE genes in each background and common DE genes are highlighted with colors. (D) Gene Ontology analyses of significantly down-regulated or up-regulated genes in wild-type and Dgcr8 KO cells in normal and MTORi conditions. Commonly regulated pathways in both backgrounds are shown together with those that differ based on the genetic background. Top 10 terms are shown; the full list is provided in Supplemental Table S2.
Single-embryo profiling reveals rewiring of global miRNA expression in dormancy
We next profiled miRNA expression with high sensitivity via ultra-low-input small RNA-seq (Fig. 3A). Diapaused embryos show varied morphology and survival; therefore, miRNA expression profiles may show inter-embryo variation. For this reason, we profiled individual embryos in proliferative (E4.5) and dormant states (in vivo and in vitro; see Methods). During in vivo diapause, dormancy progresses from the mural end of the embryo to the polar end over a period of 3 d, correlating with MTOR activity levels (Kamemizu and Fujimori 2019; Iyer et al. 2023). We laser-dissected the embryos into polar and mural parts for higher spatial resolution (Fig. 3A; Supplemental Fig. S3A). In addition to blastocysts, we also profiled the ESCs and trophoblast stem cells (TSCs) as in vitro derivatives of the respective tissues in the embryo. With this experimental design, we aimed to address three main questions: (1) Do in vivo- and in vitro-diapaused embryos show similar miRNA expression profiles; (2) do dormant stem cells and embryos show similar miRNA expression profiles; and (3) which miRNAs are consistently induced across dormant states.
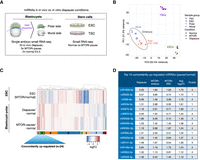
Up-regulation of a set of miRNAs is associated with dormancy. (A) Schematics of sample preparation for small RNA profiling. In vivo diapaused, in vitro diapaused, and normal E4.5 mouse blastocysts were dissected via laser microdissection to separate polar and mural ends (see Supplemental Fig. S3A). ESCs and TSCs were cultured under standard conditions with or without MTORi. Small RNA expression profiles of single embryo parts and bulk stem cells were generated via low-input small RNA-seq. (B) PCA plot of small RNA-seq data sets. Stem cells and embryos are separated along PC1 (55% variance). The polar embryo, which includes pluripotent cells, clusters closer to ESCs, whereas the mural embryo clusters closer to TSCs (PC2, 21% variance), suggesting small RNA expression profiles reflective of tissue of origin. In vivo diapaused embryos show higher variability than other groups. (C) Heatmap showing miRNA expression changes in diapaused embryos (in vitro and in vivo) compared with normal blastocysts and in paused ESCs compared with normal ESCs. miRNAs were clustered into nine clusters based on their expression levels in the three samples (for corresponding silhouette, see Supplemental Fig. S3E). Clusters 4 and 1 show a concordant trend of up-regulation on average and are the focus of the rest of the study. (D) The top 15 concordantly up-regulated miRNAs and their log2FC values in each condition.
To gauge the agreement of miRNA expression profiles across all samples, we first performed PCA (Fig. 3B). Embryonic samples separated from stem cells on PC1 (55% variance), yet ESCs and TSCs were more proximal to their corresponding tissues on PC2 (21% variance) (Fig. 3B). Within the embryonic cluster, the polar and mural profiles clustered separately (Supplemental Fig. S3B,C). Inter-embryo variability was minimal in the mural part and more pronounced in the polar part, hinting at more dynamic regulation. In vivo diapaused embryos showed higher variability compared with in vitro diapause.
To identify specific patterns of miRNA expression in dormancy, we computed log fold changes (FCs) of miRNA expression in paused versus normal embryos and stem cells, and subsequently, we applied hierarchical clustering to identify groups of miRNAs with concordant or discordant regulation patterns across conditions and tissue types (Fig. 3C; Supplemental Fig. S3D; optimal cluster number was identified according to silhouettes in Supplemental Fig. S3E–G; Supplemental Tables S3, S4). This analysis revealed more similar miRNA expression changes between embryos in diapause (in vivo and in vitro) compared with stem cells, suggesting that tissue complexity or culture media play important roles in miRNA rewiring. We saw a greater number of miRNAs in clusters showing a positive increase in expression (MTORi/normal) across polar embryo–ESCs comparisons (two clusters [1 and 4], total of 35 miRNAs) than mural embryo–TSC (one cluster [number 4], total of 22 miRNAs) (Supplemental Fig. S3D). In general, we observed very little to no agreement between polar embryo–ESC versus mural embryo–TSC clusters, suggesting distinct regulation in these tissues. Notably, the polar embryo/ESCs showed more dynamic changes compared with those of mural embryo/TSCs in response to dormancy cues (Supplemental Fig. S3D) and therefore are the focus of the rest of the study. Among the 35 miRNAs in clusters 1 and 4 (Fig. 3C), a subset of 24 miRNAs were each concordantly up-regulated in all diapause conditions (for top 15, see Fig. 3D). These are highly enriched for miR-200 family miRNAs such as miR-200a/b/c, miR-141, and miR-429, among others. Taken together, these results reveal dynamic miRNA alterations upon dormancy induction and show that in vitro embryonic diapause largely recapitulates the miRNA regulation of the in vivo phenomenon.
To corroborate the miRNA expression changes in dormancy with an independent approach, we additionally performed miRNA expression analysis in ESCs using NanoString technology. The amplification-free sample preparation for NanoString allows avoidance of the artifacts that arise from library preparation for Illumina sequencing. Comparison of miRNA expression profiles of MTORi-treated versus control ESCs generated by RNA-seq and NanoString showed a positive correlation between the two approaches (Spearman's coefficient r = 0.382, P = 2.91 × 10⁻¹²) (Supplemental Fig. S4A; Supplemental Table S5). miR-200 family and miR-26b-5p miRNAs were among the top up-regulated miRNAs in both assays (Supplemental Fig. S4A). This multitissue, multimethod characterization thus revealed a shared regulatory base of in vivo and in vitro diapause, particularly in embryos, and yielded a set of concordantly up-regulated miRNAs across diapause conditions, which were further validated in embryos and ESCs (Supplemental Fig. S4B,C).
Constructing the miRNA–target network of the paused pluripotent state
miRNAs act in a combinatorial fashion, cooperatively fine-tuning many genes at once. We thus conceptualized miRNAs as a regulatory layer that mediates the transition to dormancy, likely via synergistically controlling multiple processes. miRNAs can exert indirect regulation on functionally associated proteins, influencing the assembly of protein complexes and cellular pathways. To achieve a bird's eye view of miRNA-regulated processes during dormancy entry, we focused on elucidating the role of miRNAs within the context of protein interaction networks rather than considering them solely in the context of isolated lists of target genes.
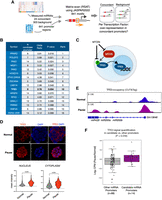
Therefore, we constructed an in silico post-transcriptional regulatory network of miRNAs, their potential target genes, and their interacting proteins (Fig. 4A). miRNA–target interactions were retrieved from miRDB and miRTarBase (Chen and Wang 2020; Huang et al. 2022) and PPIs from BioGrid, together with top-scoring interactions from STRINGdb (Oughtred et al. 2021; Szklarczyk et al. 2021). Only high-confidence interactions from these databases were retained (see Methods) and were exclusively used to connect genes (“nodes”). In addition, we generated deep proteome profiles of MTORi-treated or control ESCs to be integrated with miRNA expression data in the network approach as described below (Fig. 4B; Supplemental Table S6). To focus on the most prominent miRNA-mediated changes during dormancy, we have established a scoring framework tailored to prioritize critical edges within the network, specifically concentrating on scoring miRNA–target interactions and PPIs using two distinct criteria. For miRNAs, which play a role in down-regulating target genes and thus intricately modulate target gene output, the scoring of miRNA–target edges reflects the expectation that alterations in target gene expression are inversely correlated or discordant with changes in miRNA expression. Namely, miRNA–target edges are scored by subtracting the protein-target log2FC from the connected miRNA log2FC, leading to high-scoring edges when a positively regulated miRNA is connected to a negatively regulated protein (see Methods). We note that this approach might overestimate the regulatory impact of miRNAs on the protein levels of their targets. Nevertheless, strongly down-regulated proteins represent the most relevant entities to investigate in the context of diapause, even if their down-regulation might also be caused by transcriptional regulation. When scoring PPI edges, our emphasis lies on the coexpression of the interacting proteins. This approach is rooted in our expectation that perturbations caused by miRNAs ripple through protein complexes and cellular pathways. Furthermore, proteins belonging to the same PPI subnetwork show coregulation, according to the “guilt-by-association” principle (Amar et al. 2013). To transform proteomic data into scores that reflect biological interactions, protein–protein edges were scored by summing the proteomic expression changes of connected proteins (see Methods), leading to high positive or negative scores when two proteins show joint positive or negative regulation. Finally, by keeping the highest scoring edges according to the criteria outlined above (see Methods), we were able to extract connections of the highest concordance (protein–protein) or discordance (miRNA–target) in terms of expression changes during pausing. Of note, down-regulated miRNAs were not included in the network construction because our goal was to identify miRNAs that are specifically induced at the time of diapause entry and their putative target genes. Besides, only down-regulated direct targets were considered before filtering (Supplemental Fig. S6F), to focus on the subset of miRNA–target relations concordant with the down-regulation of their targets in our experimental settings. From an initial network of 24 up-regulated miRNAs and 4346 proteins, we filtered for the top 10% of miRNA–target edges and the top 1% of PPIs, thus extracting a network comprising 335 PPIs and 196 miRNA–target connections (non-DE nodes with a single interaction were left out for ease of visualization) (Fig. 4C; for the complete network, see Supplemental Table S7).
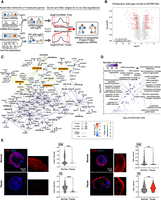
The miRNA–target network of the paused pluripotent state. (A) Schematics of the computational analysis to construct the network. From the measured logFC of proteins and miRNAs, scores are assigned to edges to assess concordant (for proteins interactions) or discordant (miRNA–target targets) regulation. Comparison of actual scores to a distribution from random pairings enables the identification of the most extreme edge scores to keep in the final network. (B) Differential expression analysis of normal and paused wild-type ESC proteomes; 457 proteins are significantly differentially expressed (216 up, 241 down) using the criteria log2FC > 0.5 and Padj < 0.1. (C) miRNA network of concordantly up-regulated miRNAs and their significantly down-regulated target proteins. A stringency cutoff is applied to keep the top 10% of miRNA–target edges and the top 1% of protein–protein interactions. P = 1.3 × 10⁻³⁰ from Fisher's exact test (one-sided) for enrichment in differentially expressed protein. A less stringent network with the first cutoff lowered to the top 30% of miRNA–target edges is in Supplemental Figure S5B, whereas an ESC-only network is provided in Supplemental Figure S6. (D) Gene Ontology analysis of in-network proteins. (E) Immunofluorescence stainings and quantifications of the in-network PML and DDX6 proteins in MTORi-paused embryos. Single-cell quantifications were performed for the ICM and TE separately by manually cropping the images. Between seven and nine embryos were stained in each group. Scale bar, 20 µm. Statistical test is an unpaired t-test. (***) P-value < 0.001; (****) P-value < 0.0001. Supplemental Figure S8 contains additional stainings in ESCs. Scale bar, 20 µm.
The network is enriched in significantly differentially down-regulated proteins (119 out of the 431 retained proteins, one-way Fisher's exact test P-value = 1.327 × 10⁻⁹), while also capturing the majority (17 out of 24) of miRNAs up-regulated during pausing in both ESCs and embryos (Supplemental Fig. S6A–D). miR-200 family miRNAs emerged as prominent candidate regulators also within the network, with miR-200b-5p and miR-200c-3p ranking as the second and third highest-scoring miRNA–targets and miR-200c-3p appearing as a prominent “hub,” that is, showing a high number of regulatory interactions modulating target gene protein levels. Other miR-200 family miRNAs—miR-200a-3p, miR-141-3p, and miR-429-3p—are also part of the network. The hub node miR-26b-5p is the most up-regulated miRNA in the network, and PML is the most down-regulated protein (Fig. 4C). Additionally, including PPIs allows one to visualize how regulatory relationships between miRNA and direct target genes propagate and potentially affect cellular pathways. For example, our results suggest that miRNA deregulation may lead to downstream effects on regulators of RNA processing (mainly pre-mRNA splicing), such as SNRNP200 and PDCD11, which emerge as prominent hubs in the dormancy network despite not being directly targeted by miRNAs.
Although a cutoff of 10% on the scores of miRNA–target interactions allows us to focus on the core network of dormancy (as in Fig. 4C), showing the strongest effects on miRNAs and their gene targets, additional, lower-scoring regulatory interactions might contribute to dormancy-related cellular processes. We therefore zoomed out to lower the score cutoff and extend the analysis to the top 30% miRNA–target edges (Supplemental Fig. S5A,B). This revealed other putative regulators of dormancy, including members of the miRNA let-7 family (let-7d and let-7g), which have been previously reported to get up-regulated during mouse diapause (Liu et al. 2020). The up-regulation of let-7 and down-regulation of its target genes are, however, less pronounced than other candidate miRNAs identified in the stringent core network; therefore, we exclude it from downstream analyses.
Finally, we explored in detail the ESC-specific regulatory network, independent of the concordance of miRNA expression in embryo samples (Supplemental Fig. S7). Here we wanted to test whether the reduced complexity of the ESC model and the availability of both miRNA expression and matched proteomic data in this cell type would allow identification of candidate miRNAs that remain inconspicuous in the main network. Via this approach, an additional set of 44 miRNAs and 108 new gene targets was found. Many of the added miRNAs were found in higher proportion in high-scoring interactions with proteins from the stringent network. For example, PML was additionally targeted by miR-370-5p, miR-92b-5p, miR-1193-3p, miR-291a-5p, and miR-92-2-5p, among the top 25 highest scoring connections. Notably, miR-92, which is an insulin-dependent regulator of L1 diapause in C. elegans (Kasuga et al. 2013), was found up-regulated in paused ESCs and is part of the ESC network (Supplemental Fig. S7), suggesting a prominent role in pluripotent cells.
In summary, we present here a core miRNA–target network associated with diapause (Fig. 4C). This network is constructed using a combination of miRNA and protein expression data, target prediction, and stringent filtering criteria, retaining only high-scoring relationships characterized by substantial absolute expression changes between miRNAs and their targets, as well as coexpression of functionally related proteins through PPIs. This network provides a foundation for unveiling potential regulatory mechanisms both upstream of and downstream from miRNA control during the diapause process.
The in-network proteins were strongly enriched for RNA processing, chromosome organization, and cellular development (Fig. 4D). Among these, we stained for PML (of PML bodies) and DDX6 (of P-bodies) in normal and paused states (Fig. 4E; Supplemental Fig. S8). SRSF2 (of nuclear speckles), which is not in the network, was stained as a control. Spatially resolved single-cell signal quantifications corroborated the down-regulation of PML and DDX6 in pluripotent cells in embryos and/or in culture, but not necessarily in the TE, whereas SRSF2 was up-regulated (Fig. 4E; Supplemental Fig. S8). Dgcr8 KO ESCs in normal ESC culture had higher PML and DDX6 expression compared with that of wild-type ESCs, whereas mean SRSF2 expression was lower in the Dgcr8 KO. Importantly, Dgcr8 KO ESCs did not down-regulate PML and DDX6 (Supplemental Fig. S8). In comparison, SRSF2 mean levels did not change during MTORi treatment in Dgcr8 KO cells. These results confirmed the down-regulation of in-network proteins during dormancy entry in wild-type cells and revealed that the expression of these proteins was perturbed in Dgcr8 KO cells under both normal and MTORi conditions.
Network perturbation by manipulation of individual nodes leads to loss of pluripotent cells during dormancy transition
Having identified the network of miRNAs that are associated with the diapause entry in embryos as well as ESCs, we next probed the functional requirement for these miRNAs at this cellular transition. We selected the miR-200 family and miR-26b for their high up-regulation levels and prominent connectivity within the network (Fig. 4B). The requirement for these miRNAs during diapause entry was directly tested in embryos via loss-of-function perturbations. For this, two-cell-stage embryos were injected with inhibitors against the miR-200 family (pan inhibitor that targets all miR-200 members), miR-200 family together with miR-26b-5p, or control inhibitors (inhibitors are sequence-specific antimiRs; see Methods) (Fig. 5A; Supplemental Fig. S9A). Injected embryos were cultured until the blastocyst stage and were afterward treated with the MTOR inhibitor RapaLink-1 to induce diapause in vitro. The percentage of intact blastocysts was scored every day, and selected embryos were stained for the epiblast marker NANOG and the trophectoderm marker CDX2 (Fig. 5B,C). Inhibition of miR-200 and miR-26 activity significantly reduced embryo survival compared with the control (Fig. 5B). Most embryos were lost within the first 5 d of diapause, corroborating the need for miRNAs during this cell state transition. miRNA-inhibited embryos had fewer NANOG+ cells compared with control embryos, suggesting the disruption of transcriptional networks (Fig. 5C). These results show that perturbation of the network reduces the efficiency of in vitro diapause.
Combinatorial miRNA activity promotes efficient transition to dormancy during in vitro diapause. (A) Schematics of the experiment. Two-cell-stage embryos were microinjected with synthetic miRNA inhibitors (antimiRs) against the miR-200 family and miR-26b-5p or with a control inhibitor (nontargeting). After injection, the embryos were cultured until the blastocyst stage under standard conditions and treated afterward with DMSO or RapaLink-1 to induce in vitro diapause. (B) Survival curves of embryos generated as described above. The number of expanded embryos was counted every day. Embryos with a blastocoel and unfragmented TE were considered intact. Statistical test is a Mantel–Cox test with control inhibitor + MTORi as the reference data set. (n) Number of embryos. (C) Immunofluorescence staining of control-injected or antimiR-injected representative embryos on day 3 of MTORi treatment for the epiblast marker NANOG, the trophectoderm marker CDX2, and the DNA stain DAPI. Right panels show the number of NANOG+ cells per embryo in each condition. (n) Number of embryos. Statistical test is an unpaired t-test with Welch's correction. (***) P-value < 0.001. Scale bar, 20 µm. (D) Schematics of miR92 overexpression (OE). Zygotic pronuclei were injected with the linearized miR92 overexpression construct (pLKO.1 background, U6 promoter), empty vector, or injection buffer. The embryos were cultured in standard medium without MTORi until the end of the assay. For scoring, the same procedure as in A is applied. (E) Survival curves embryos miR92 OE or control embryos. (n) Number of embryos in each group. Statistical test is a Mantel–Cox test with empty vector injection as the control data set. (F) Bright field images of miR92 OE or control embryos on day 13 of in vitro culture without MTORi. Scale bar, 100 µm.
If miRNAs are necessary for the entry into diapause, can they act in a stand-alone manner to directly induce it? To investigate this question, we tested whether miRNA overexpression can bypass MTORi and induce a diapause-like embryonic state in vitro. For this, we chose the miRNA miR-92 as our top candidate because its parental clusters miR17-92 and miR106-363 are highly expressed in pluripotent cells and up-regulated in paused ESCs and because its ortholog miR-235 is associated with diapause in C. elegans (Kasuga et al. 2013). miR92 is transcribed from three distinct loci in the mouse genome on Chromosomes 14, X, and 3, giving rise to miR-92-1, miR-92-2, and miR-92b. To stably overexpress miR-92, parental transcripts of each gene were cloned and integrated into the genome via injection of linearized plasmids into embryos (Fig. 5D). Overexpression and processing of the hairpin into mature miR-92-1/2-3p products was confirmed via TaqMan qPCR (Supplemental Fig. S9B). Once the embryos reached the blastocyst stage, they were further cultured in base media without MTOR inhibitor, and survival of intact blastocysts was scored (Fig. 5E). miR92 overexpression was sufficient to prolong the survival of intact blastocysts up to 18 d in vitro as opposed to empty vector or buffer controls (Fig. 5E,F). miR-92-1 and miR-92-2 yielded higher efficiency compared with miR-92b. Overexpression of a pool of other top candidate miRNAs, miR200 family and miR26, also prolonged maximum survival, although it improved median survival only marginally, suggesting that these might be required for the maintenance of dormancy (Supplemental Fig. S9C). Together, these results implicate miRNAs as functional regulators of dormancy in the context of embryonic diapause.
The MTOR–TFE3 axis regulates miRNA biogenesis in dormancy
We have so far identified the miRNA–target network specific to embryonic diapause and corroborated its functional significance. Yet, how these miRNAs are selectively up-regulated under diapause conditions is unclear. To answer this question and bridge the gap between upstream (cytoplasmic, MTOR) and downstream (nuclear, miRNA) regulators of dormancy, we mined promoters of concordantly up-regulated miRNAs for enriched TF binding sites (TFBSs) (Fig. 6A). Transcription start sites of miRNAs were retrieved from the FANTOM5 database (de Rie et al. 2017), and promoters were defined as the region 1500 bp upstream of and 500 bp downstream from the TSS. After intersecting with the clustered miRNAs, we predicted the presence of TFBS motifs within the set of the 14 promoters of the concordant up-regulated miRNAs (cluster 1 and cluster 4) (Fig. 3C). Enrichment of a given motif was evaluated by comparing the fraction of promoters with a TFBS for these candidate promoters versus a background set composed of the promoters of all other detected miRNAs (N = 91).
The MTOR–TFE3 axis regulates miRNA biogenesis in dormancy. (A) Schematics of TF mining at candidate miRNA promoters. Transcription start sites of miRNAs were retrieved from the FANTOM5 database and used to scan the [−1500, +500] regions with JASPAR motifs. High-confidence hits were then used to compare the fractions of promoters with a given motif, for promoters of concordant, positive logFC miRNAs against promoters of other measured miRNAs. (B) Enriched TFs at candidate miRNA promoters. TFE3, shown in bold, was chosen for experimental validation. (C) Schematics of the MTOR–TFE3 axis. MTOR phosphorylates TFE3 when active, which results in its sequestration in the cytoplasm. When MTOR is inactive, nonphosphorylated TFE3 instead translocates into the nucleus for regulation of target genes. (D) TFE3 staining in wild-type normal and paused ESCs. Bottom panels show single-cell quantifications of mean fluorescence intensity in the nucleus and cytoplasm. Scale bar, 5 µm. Statistical test is a Kolmogorov–Smirnov test, two-sided. (E) Genome browser view of TFE3 occupancy over the Gm13648 gene, which contains the miR200a, miR200b, and miR429 miRNAs. TFE3 occupancy was mapped via CUT&Tag in wild-type normal and paused ESCs. (F) Comparison of the log2 ratio of TFE3 levels (maximum scaled CPM) at candidate (n = 14) and control (n = 88) miRNA promoters. Statistical test is a Mann–Whitney U test, one-sided.
Via this approach, we identified 15 TFs with significant motif enrichment at candidate up-regulated miRNA promoters (Fig. 6B). Identified TFs comprise important developmental regulators (e.g., HOXD10, ZSCAN4, PAX3) and TFs responsive to external stimuli, such as hormones (e.g., NR2F1, RXRA, PPARD) and nutrients (TFE3). To test whether candidate TFs indeed bind candidate diapause-associated miRNAs, we eliminated those that are not expressed in ESCs (e.g., HOXD10, PAX3) and focused our efforts on TFE3. TFE3 and the closely related factor TFEB are known to regulate ESC metabolism and lysosomal genes via their TF activity within the nucleus (Martina et al. 2014). Intracellular TFE3/TFEB localization dynamically changes in an MTOR-dependent manner. When MTOR is active, TFE3/TFEB are sequestered in the cytoplasm, whereas nutrient depletion leads to the loss of MTOR-dependent TFE3 phosphorylation and its translocation into the nucleus (Fig. 6C; Roczniak-Ferguson et al. 2012). We reasoned that nuclear TFE3 activity may induce transcription of target miRNAs in diapause, thus providing the missing link between MTOR activity and miRNA up-regulation.
To test this hypothesis, we first visualized TFE3 localization in normal and paused wild-type ESCs (Fig. 6D). MTORi increased overall TFE3 expression in ESCs, including its levels in the nucleus, and the same was observed for TFEB (Supplemental Fig. S10). We have previously shown that MTOR complex 1 activity, which regulates TFE3 phosphorylation, is effectively inhibited by MTORi under these conditions; therefore, additional regulators may contribute to TFE3 cytoplasmic localization in paused ESCs (Iyer et al. 2023). To test whether nuclear TFE3 binds target miRNA promoters in paused ESCs, we mapped its occupancy at chromatin via CUT&Tag (Fig. 6E,F). TFE3 indeed bound target miRNA promoters in paused cells at higher levels compared with normal ESCs and compared with control miRNAs (Fig. 6F). miR200a/b, which we functionally validated in previous experiments, were among top TFE3 targets (Fig. 6E). In summary, we identify an MTOR–TFE3–miRNA axis, which regulates the rewiring of miRNA expression and downstream protein levels in the transition of pluripotent cells from proliferation to dormancy.
Discussion
miRNAs are critical regulators of cellular transitions, mediating prompt target down-regulation mostly via translational interference or mRNA decay. The prominent role of miRNAs in regulation of growth and proliferation led us to hypothesize that they may regulate diapause entry downstream from MTORi. Here we show that miRNAs are indispensable for diapause entry by rigorous testing of Dgcr8 KO ESCs and embryos. By integrating single-embryo miRNA expression profiles with target predictions and proteome data sets, we constructed a miRNA–target interaction network of dormancy entry in the context of mouse diapause. Functional testing of the identified miRNAs directly on embryos further corroborated the necessity of this network for efficient entry of embryos into diapause. We further identified TFE3 as a nutrient-sensitive TF that regulates miRNA biogenesis downstream from MTOR activity. Our results therefore provide the first comprehensive overview of miRNA function in early mouse embryos during the transition into diapause. Among the predicted upstream TFs, NR2F1 has been implicated in cancer dormancy with associated pluripotency signatures (Sosa et al. 2015; Fluegen et al. 2017; Borgen et al. 2018), which underlines the possibility of shared regulation of dormancy in developmental and pathological contexts as postulated before (Dhimolea et al. 2021; Rehman et al. 2021).
Our finding of the essentiality of miRNAs for dormancy entry does not align with their dispensability for mouse preimplantation development (Bernstein et al. 2003; Wang et al. 2007). However, this discrepancy is not without precedent, as other critical stem cell regulators that are otherwise dispensable for preimplantation development such as LIF/LIFR and WNT are specifically required in diapause (Nichols et al. 2001; Fan et al. 2020). Accumulating knowledge points to diapause as a distinct pluripotent state that necessitates additional regulation, including stress-response mechanisms, and we identify miRNAs as such an essential regulatory layer. As our knowledge about diapause-specific dormancy mechanisms expands, it will be important in the future to synthesize an understanding of the mechanisms that regulate the stress response and mediate the cell state transition versus the mechanisms maintaining cellular identity during periods of dormancy. This knowledge may then be transferable to other tissues, mainly in the adult organism, that rely on dormancy–reactivation cycles for regeneration.
miRNAs have been previously associated with the dormant state in other contexts such as larval diapause in nonmammalian species (Yu et al. 2008; Meuti et al. 2018; Reynolds 2019). Yet, most efforts are directed toward dissecting individual miRNA–mRNA interactions or general miRNA profiling. As such, we only have a limited understanding of miRNAs as a regulatory layer, including the interconnectivity of miRNAs and their targets. Here we aimed to work toward a larger context of miRNA activity in the cellular transition to diapause. As such, we provide the experimentally verified stringent miRNA–target interaction network and refrain from going into further mechanistic details of miRNA–mRNA binding site biology. Further experiments, such as AGO pull-down and site-specific mutations, will deliver insights into each of the nodes and edges in our network. In addition to our spatially resolved miRNA mapping, single-cell-level assays may reveal whether these regulators are required in the pluripotent epiblast, primitive endoderm, or the polar TE: the three cell types that make up the “embryonic” side of the blastocyst.
miRNAs can be of embryonic or maternal origin. Extracellular vesicles (EVs) carrying miRNAs are a medium of maternal–embryo communication during diapause (Liu et al. 2020). This can lead to differences in the miRNA expression profiles of in vivo and in vitro diapaused embryos. As we see a large agreement between the two in their miRNA expression profiles, it appears that maternal miRNAs do not globally shift miRNA abundance in vivo. Yet, the maternal contribution cannot be ruled out and warrants further investigation.
The miR-200/ZEB1 axis regulates epithelial-to-mesenchymal transition (EMT) and has been extensively studied in cancers (Brabletz and Brabletz 2010; Davalos et al. 2012). Although diapaused embryos show preimplantation morphology and gene expression signatures devoid of EMT, it has been shown that the epiblast polarizes in a Wnt-dependent manner. Therefore, it is plausible that miR-200 activity may be associated with morphological changes of the epiblast. Several other miRNAs in our network regulate cell cycle progression, including miR-26b and miR-148 (Zhu et al. 2012; Du et al. 2015; Liu et al. 2018). Thus, in addition to the down-regulation of PML and DDX6 shown in this paper, in-network miRNAs are likely to contribute to dormancy entry via other events such as suppression of cell cycle and cellular growth. In line with this, PCNA (regulator of cell proliferation) and RIF1 (regulator of replication timing) are down-regulated, among others, in our network. Depletion of DDX6, which is an in-network protein down-regulated in dormancy, has been shown to confer “hyperpluripotency” to ESCs and thus may safeguard pluripotency during diapause (Stefano et al. 2019).
The cellular transition to diapause entails many regulatory events in addition to miRNA-based regulation. We and others have revealed significant rewiring of the metabolic, epigenetic, and transcriptomic signatures of cells in this transition (Fu et al. 2014; Boroviak et al. 2015; Hussein et al. 2020; Collignon et al. 2023; Iyer et al. 2023; van der Weijden et al. 2024). Among these are altered RNA methylation and stability (Collignon et al. 2023). We speculate that several post-transcriptional regulatory mechanisms may be needed to promptly deplete existing gene products, whereas transcriptional regulation would deplete nascent synthesis. Whether miRNAs act synergistically or hierarchically with other post-transcriptional mechanisms remains to be determined.
Uncovering miRNAs as a regulatory layer not only broadens our understanding of the regulation of dormancy but also offers a prospect for their use in diagnosis. Circulating miRNAs, including mir-200 family and miR-92, have long been proposed for use as cancer biomarkers (Fu et al. 2018; Li et al. 2018; Cavallari et al. 2021). The use of miRNAs as diapause biomarkers could provide a noninvasive way of diapause detection, particularly in wild species in which detection of diapause via hormonal measures is impractical or unreliable (Wauters et al. 2022).
Methods
Animal experimentation
All animal experiments were performed according to local animal welfare laws and approved by local authorities (covered by LaGeSo licenses ZH120, G0284/18, and G021/19). Mice were housed in ventilated cages and fed ad libitum.
Cell lines and culture conditions
Mouse ESCs
Cells were plated on 0.1% gelatin-coated dishes and grown in DMEM high glucose with GlutaMAX media (Thermo Fisher Scientific 31966047) supplemented with 15% FBS (Thermo Fisher Scientific 2206648RP), 1× NEAA (Thermo Fisher Scientific 11140-035), 1× beta-mercaptoethanol (Thermo Fisher Scientific 21985023), 1× penicillin/streptomycin (Life Technologies 15140148), and 1000 U/mL LIF and grown at 37°C in a 20% O2 and 5% CO2 incubator. Cells were dissociated using TrypLE (Thermo Fisher Scientific 12604-021) for passaging.
Mouse TSCs
TSCs were grown on mitotically inactivated mouse embryonic fibroblasts in media containing RPMI 1640 + GlutaMAX (Thermo Fisher Scientific 61870010), 20% FBS, beta-mercaptoethanol (Thermo Fisher Scientific 21985023), 1× penicillin/streptomycin (Life Technologies 15140148), 1× sodium pyruvate, 25 ng/µL FGF4 (R&D Systems 235-F4-025), and 1 µg/mL heparin (Sigma-Aldrich H3149). Cells were depleted off feeders before collecting for analysis.
Developmental pausing setup
Mouse ESC/TSC pausing
ESCs and TSCs were treated with the MTOR inhibitor INK-128 at 200 nM final concentration. Media were replenished as required. ESCs were paused for 6 d and TSCs for 12 d before the collection of cells for small RNA profiling.
In vitro diapause
Blastocyst-stage embryos were cultured in KSOM + AA medium (Sigma-Aldrich MR-101) and treated with 200 nM of RapaLink-1 to induce diapause in vitro.
In vivo diapause
In vivo diapause was induced as previously described (Paria et al. 1993) after natural mating of CD1 mice. Briefly, pregnant females were ovariectomized on E2.5 and afterward injected with 3 mg medroxyprogesterone 17-acetate subcutaneously (Sigma-Aldrich M-1629) on E3.5 and E5.5. Diapaused blastocysts were flushed from uteri in M2 media after 4 d of diapause at EDG7.5.
Morula aggregations
Wild-type diploid morulae collected from CD1 (Hsd:ICR) females were used for aggregations. Wild-type-EGFP or Dgcr8 KO-EGFP E14 mouse ESCs were combined with morulae as previously described (Eakin and Hadjantonakis 2006). Cells express an EGFP gene expressed from a CAGGS promoter and randomly integrated into the genome as a marker of ESC origin.
Bulk RNA-seq
Total RNA from 800,000 wild-type or Dgcr8 KO mouse ESCs was extracted using the RNeasy extraction kit (Qiagen 74104). One microgram of total RNA was used for standard library preparation using NEBNext Poly(A) mRNA magnetic isolation module (New England Biolabs E7490). Library quality was assessed by running samples on TapeStation (Agilent 4150).
Small RNA-seq on ESCs and TSCs
Small RNA was extracted using a miRNeasy kit (Qiagen 217004). Ten nanograms of RNA was used as input for library preparation using the SMARTer smRNA-seq kit for Illumina (Takara 635031) with 12 amplification cycles followed by bead size selection (ratio 0.95× − 0.7×), followed by an additional clean-up step with a bead-to-sample ratio of 0.95×. Library quality control (QC) was performed using Qubit and Bioanalyzer, and the final libraries were quantified using a KAPA library quantification kit (Roche 07960140001). Pooled libraries were sequenced on a HiSeq 4000 flow cell with single-end 75-bp reads to get about 15 million reads per sample.
Ultra-low-input small RNA-seq on dissected embryos
Normal blastocysts at E4.5, in vivo paused blastocysts at EDG7.5, and MTORi-treated blastocysts were used for microdissection. Laser-assisted separation of ICM and mural trophoblasts was performed using a Hamilton Thorne XYRCOS laser system with the power set to 100% and a pulse length of 300 µsec. Immediately after separation, the tissue fragments were transferred into 7 µL PBS and frozen down on dry ice. Small RNA libraries were prepared using the TrueQuant small RNA-seq kit from GenXPro according to instructions in the manual. The method is based on a single-tube protocol for the ligation of UMI-containing adapters to RNA molecules followed by reverse transcription and PCR. No size selection of the small RNAs was performed. Small RNAs were amplified with 12–20 cycles to reach the required amounts for sequencing. Sequencing was performed on an Illumina NextSeq 500 instrument with 1 × 75 bp.
Small RNA-seq data analysis
Mapping and quantification
The miRDeep2 (version 2.0.1.2) (Friedländer et al. 2012) algorithm was applied for quantification of miRNAs across samples, using the reference annotations of mature and hairpin miRNAs from miRBase (version 22) (Kozomara et al. 2019). The steps of the algorithm include preprocessing and QC of reads, alignment of reads (mapper.pl script, options -j -l 17, other options set to default) with ambiguous reads assignment and multiloci read processing (default: maximum of five multisite mapping), and quantification of miRNAs against miRBase mouse mature and hairpin sequences, after filtering for other noncoding RNAs. Across samples, an average of 44.5% of reads were aligned. For QC, Pearson's correlation of read counts between replicates for each set of conditions across experiments was performed and yielded an average correlation of 0.944.
Differential expression analysis
Differential expression analysis was applied for each experiment using DESeq2 (Love et al. 2014), comparing each set of condition samples against the control samples for both samples representing embryonic fate and samples representing extraembryonic fate separately. Low read count miRNAs were discarded by keeping only those miRNAs showing a normalized read count above five in at least three samples. Read count quantification was transformed into regularized log counts for downstream analyses such as PCA visualization of samples. Differentially expressed genes were identified with the thresholds |log2FC| ≥ 1.5 and adjusted P-value < 0.1 (Benjamini–Hochberg correction).
Differential expression status agreement and clustering
From the results of DESeq2 analyses across experiments, logFC values of miRNAs from each analysis were aggregated into a single table. The concordance of differential expression status for each miRNA was evaluated for each group of experiments by comparing the logFC sign and magnitude. To systematically identify groups of miRNAs with concordant patterns across ESCs and embryo experiments, we applied hierarchical clustering to the miRNA FC profiles (Z-score normalized logFC distributions, with Ward's linkage for cluster distance and Euclidean distance between pairs of miRNAs). We calculated the average silhouette coefficient, which measures the homogeneity within clusters versus the distance between clusters, for an increasing number of clusters (two to 30), and selected the final number by maximizing this silhouette score, balanced by the number of clusters. The final indexing of clusters per experiment reflects the number of miRNAs within the cluster, from zero, the smallest cluster, to N, the largest cluster. Clustering was performed for the following groups of experiments separately: ESCs versus blastocyst-polar, TSCs versus blastocyst-mural, and blastocyst-polar versus blastocyst-mural. For each group, average logFC values (without Z-score normalization) were calculated for each cluster, and clusters grouping miRNAs with concordant logFC (either positive or negative across all comparisons) were extracted for downstream regulatory network analyses.
NanoString
Quantification
Total RNA was isolated using the RNeasy extraction kit (Qiagen 74104). One hundred fifty nanograms of total RNA in a volume of 3 µL was used as the starting material. miRNA sample preparation and miRNA CodeSet hybridization were performed following the manufacturer's protocol (MAN-C0009-07). The SPRINT cartridge was then run on nCounter SPRINT profiler. Quantification data were generated using nSolver from NanoString. Two biological replicates were performed.
Differential expression
RCC values were extracted to be used for differential expression using DESeq2 with RUV correction (Bhattacharya et al. 2021). Normalization was performed using the following three housekeeping genes: Actb, Gapdh, and Rpl19. The first component of unwanted variation was removed. DESeq2 was applied to the transformed values, and DE miRNAs were identified using the thresholds of |log2FC| ≥ 1.5 and adjusted P-value < 0.1.
Global proteomics
Sample preparation
Proteomic sample preparation was performed according to a published protocol with minor modifications (Kulak et al. 2014). In brief, 5 million cells in biological duplicates were lysed under denaturing conditions in 500 µL of a buffer containing 3 M guanidinium chloride (GdmCl), 10 mM tris(2-carboxyethyl)phosphine, 40 mM chloroacetamide, and 100 mM Tris-HCl (pH 8.5). Lysates were denatured for 10 min shaking at 1000 rpm in a thermal shaker at 95°C and sonicated in a water bath for 10 min. One hundred microliters of lysate was diluted with a dilution buffer containing 10% acetonitrile and 25 mM Tris-HCl (8.0 pH), to reach a 1 M GdmCl concentration. Then, proteins were digested with LysC (Roche; enzyme to protein ratio 1:50, MS-grade) shaking at 700 rpm for 2 h at 37°C. The digestion mixture was diluted again with the same dilution buffer to reach 0.5 M GdmCl, followed by a tryptic digestion (Roche, enzyme to protein ratio 1:50, MS-grade) and incubation overnight at 37°C in a thermal shaker at 700 rpm. Peptide desalting was performed according to the manufacturer's instructions (Pierce C18 tips, Thermo Fisher Scientific). Desalted peptides were reconstituted in 0.1% formic acid in water and further separated into four fractions by strong cation exchange chromatography (SCX, 3M Purification). Eluates were first dried in a SpeedVac, dissolved in 5% acetonitrile and 2% formic acid in water, briefly vortexed, and sonicated in a water bath for 30 sec before injection to nano-LC-MS/MS.
Run parameters
LC-MS/MS was performed by nanoflow reverse-phase liquid chromatography (Dionex UltiMate 3000, Thermo Fisher Scientific) coupled online to a Q Exactive HF Orbitrap mass spectrometer (Thermo Fisher Scientific), as reported previously (Ni et al. 2019). Briefly, the LC separation was performed using a PicoFrit analytical column (75 μm ID × 50 cm long, 15-µm Tip ID; New Objectives) packed in-house with 3-µm C18 resin (Reprosil-Pur C18-AQ, Dr. Maisch).
Peptide analysis
Raw MS data were processed with MaxQuant software (v1.6.10.43) and searched against the mouse proteome database UniProtKB with 55,153 entries, released in August 2019. The MaxQuant processed output files can be found in Supplemental Table S6, showing peptide and protein identification, accession numbers, percentage of sequence coverage of the protein, q-values, and label-free quantification (LFQ) intensities.
DE and enrichment analyses
The protein levels across the three replicates of each condition were extracted from the reported label-free quantification values from the mass spectrometry experiment. Protein intensities were scaled by the median value per sample. No proteins were removed for the differential expression analysis. The analysis was performed using limma (Ritchie et al. 2015) and Limma-Voom (Law et al. 2014). We applied a threshold of |log2FC| ≥ 1.5 and adjusted P-value < 0.1 for the identification of DE proteins. GO-term and pathway enrichment analyses were performed with the online tool WebGestalt (Liao et al. 2019), using the nonredundant sets of GO terms, and the KEGG pathways. Default parameters were kept, notably for filtering categories (minimum number of genes: five per category, maximum number: 2000) and for correction for multiple testing (Benjamini–Hochberg correction, FDR < 0.05 for filtering significant categories).
miRNA–target network
Predictions of miRNA–targets were gathered from the miRDB database (version 6.0), and annotated into three categories of confidence (low, medium, high) following the official documentation on the confidence score (associated thresholds: ≥50, ≥60, ≥80). Only medium- and high-confidence miRNA–target interactions were retained for downstream analysis. In addition, experimentally validated interactions from miRTarBase V8.0 were included, retaining only functional interactions. This led to a total of 705,242 edges (664,660 from miRDB, 30,795 from miRTarBase, 9787 from both) between 1998 miRNAs and 17,802 proteins. Annotation of the edges and their nodes was performed using the log2FC values obtained from miRNAs and proteomic differential expression analyses comparing MTORi paused ESCs against controls. We established a score for the edges defined as the difference of log2FC values between the miRNA and the target measured protein. Such a score emphasizes the expected negative regulation of miRNAs onto their target translation so that a highly up-regulated miRNA linked to a highly down-regulated protein will lead to a highly positive edge score. This resulted in a subset of 80,099 edges with annotated scores, for 558 miRNAs and 5019 targets. From these edges, three subnetworks were built after filtering for connections between miRNAs and proteins with logFC > 0. First, subsets of miRNAs of interest were defined based on their differential expression values either from the MTOR-inhibited paused ESC analysis or from their joint patterns evaluated across pausing experiments of ESC and blastocyst-polar cells. The first network consists of regulatory relationships between the 24 concordantly up-regulated miRNAs between ESC and embryos and their targets, yielding 5234 miRNA–target edges with 2104 unique proteins. As the 1% of top-scoring edges yielded only three miRNAs, we relaxed the threshold down to the top 10%, yielding a subnetwork of N = 196 edges between 17 unique miRNAs and 172 proteins. The second network consisted of the same 24 miRNAs, relaxing the score threshold down to the top 30% of miRNA–target regulatory interactions. This allowed us to explore additional regulatory relationships that do not show strong regulatory patterns (i.e., strong target down-regulation upon miRNA up-regulation), and so discover miRNA–target subnetworks that have milder phenotypic changes but are putatively still important in the context of pausing. We finally constructed a third network from the ESC experimental data only, considering the full set of miRNAs with a positive logFC from the differential expression analysis of MTOR-inhibited ESCs. As this resulted in a large network, we selected and inspected for downstream analysis only the top 1% of highest-scoring miRNA–target connections, yielding a subnetwork of N = 355 edges with 55 unique miRNAs and 266 proteins. To further assess the confidence of the retained edges, the TargetScan database was used to evaluate their support in this additional resource. The overlap was evaluated both across all TargetScan edges and after separating conserved and nonconserved miRNA–target edges. This yielded an overall support of 194/196 (98.9%) for the first subnetwork (174/196 conserved and 21/196 nonconserved), 575/588 (97.8%) for the second subnetwork (510/588 conserved, 66/588 nonconserved), and 341/355 (96.1%) for the third subnetwork (189/355 conserved, 160/355 nonconserved).
Multipartite miRNA–protein and protein–protein networks
To address how perturbation of miRNAs propagates downstream and which other proteins or subnetworks are impacted by the deregulated miRNAs, we extended the miRNA–target network to a multipartite network of miRNA–targets and PPIs assembled from multiple sources of gene connections. The use of multiple sources aimed both at covering more relationships than any single resource and at identifying connections with multiple supporting sources. PPIs were gathered from the STRINGdb database (version 12.0), filtering so as to keep the top 10% of all interactions after sorting on the combined score, as well as dropping those reported from text-mining only. These were complemented with interactions reported in the BioGrid database (version 4.4.224). This represented a total of 84,363 deduplicated, high-confidence interactions, involving 12,896 unique proteins. The nodes in this protein–protein network were annotated with the logFC values obtained from the differential proteomic analysis upon MTOR-inhibited paused ESCs. As for the miRNA–target edges, PPIs were scored using the logFC values of the nodes they connect, where we defined the edge score between two proteins as the sum of the logFC of two connected proteins, highlighting the expected coexpression of interacting proteins. This yielded a total of 34,846 protein–protein edges, including 4730 unique proteins with measured logFCs. From these, the top 1% highest-scoring edges were retained and included in each of the different miRNA–target subnetworks, resulting in a multipartite network of the most important regulatory interactions, supposedly representing the core of the dormancy network. Of note, to enhance the clarity of visualization of the resulting networks, we removed protein nodes for which the protein had only one connection (miRNA or protein) while not significantly down-regulated.
miRNA loss of function in blastocysts via miRNA inhibitor injections
Inhibitors (antimiRs) against miR-26b-5p and miR-200a/b/c-3p were purchased from Qiagen (339130 and 339160, respectively). AntimiRs in injection media (1 mM Tris-HCL at pH 7.5 and 0.5 mM EDTA in embryo grade water) were injected into each cell of two-cell-stage embryos (BL/6xCast hybrid) using a Leica DMIRB inverted microscope, Narishige MMO micromanipulators/microinjectors, an Eppendorf Celltram 4r microinjector, and an Eppendorf FemtoJet microinjector. Embryos were then transferred to fresh KSOM + AA media (Sigma-Aldrich MR-101) and cultured until the early blastocyst stage. Blastocysts were split into two groups and treated either with DMSO or 200 nM RapaLink-1. As negative control, a nontargeting inhibitor (Qiagen 339136) with no sequence hits of >70% homology with any organism in the NCBI and miRBase databases was used. The survival rate and duration of embryos in MTORi-induced pausing were scored.
miRNA overexpression
Pre-miR sequences of mir92-1 and mir92-2 were PCR-amplified and cloned into pLKO.1-puro lentiviral vector between the AgeI and EcoRI restriction sites. Virus production and transduction were performed using standard protocols. In brief, 4 ug of lentiviral plasmids was packaged with equal parts of viral packaging vectors (pVSV-G, pMDL, pRSV) by transfecting them in HEK 293T cells. Virus production was performed for 72 h. The final precipitated virus was then suspended in 200 μL ice-cold PBS. Thirty microliters of viral suspension was then used to infect 100,000 ESCs in single-cell suspension for 1 h at 37°C. After this, the infected mESCs were seeded onto a six-well culture plate. The media were changed the next day. Puromycin selection was performed starting 48 h after infection, and overexpression of respective miRNAs was assessed by miRNA qPCR using TaqMan probes against miR-92a-1-5p (mmu481275_mir), miR-92a-2-5p (mmu482577_mir), miR-92a-3p (custom made-CCU001S), miR-92b-5p (mmu482578_mir), miR-92b-3p (mmu481277_mir), and miR-290a-3p (mmu481666_mir), all from Applied Biosystems. The relative miRNA expression was calculated against the Eif1a housekeeping gene.
For overexpression in mouse embryos, pre-miR sequences of miR-200a, miR-200b, miR-200c, miR-141, miR-429, miR-26b, miR-92a, and miR-92b were PCR-amplified and cloned into pLKO.1-puro lentiviral vector between the AgeI and EcoRI restriction sites. PCR amplification of the U6 promoter with the cloned miRNA hairpin was performed and microinjected into mouse embryos at the zygote or 2C stage.
TaqMan qPCR
TaqMan probes against miR-200c-3p (mmu482938_mir), miR-26b-5p (mmu482965_mir), miR-92a-3p (custom made-CCU001S), miR-290a-3p (mmu481666_mir; positive control), and miR-29b-3p (mmu481300_mir; negative control), all from Applied biosystems, were used. The relative miRNA expression was calculated against the Eif1a housekeeping gene.
Immunofluorescence
ESCs
Cells were cultured on glass coverslips and were fixed in 4% PFA for 10 min at RT, washed once in PBS, and then permeabilized with 0.2% Triton X-100 in PBS for 5 min on ice. After washing once in PBS-T (PBS with 0.2% Tween-20), cells were blocked with blocking buffer (PBS-T, 2% BSA, and 5% goat serum; Jackson Immunoresearch/Dianova 017-000-121) for 1 h at RT. Cells were then stained with the primary antibodies PML 1:200 (Novus NB100-59787), SRSF2 1:2000 (Sigma-Aldrich S4045), and DDX6 1:400 (Novus NB200-192) overnight at 4°C; and washed for 3 × 10 min with wash buffer (PBS-T, 2% BSA); incubated with secondary antibodies (antimouse Alexa Fluor 488 [Thermo Fisher Scientific A32766] or antirabbit Alexa Fluor 568 [Thermo Fisher Scientific A10042], 1:700) for 1 h at RT, followed by 3 × 10-min washes with wash buffer. The coverslips were then mounted with Vectashield with DAPI (VectorLabs H-2000) and sealed with nail polish. Imaging was performed using a Zeiss LSM880 Airy microscope using the Airy scan mode, and image processing was performed using Zen black and Zen blue software (version 2.3). Image quantification was performed using CellProfiler (version 4.2.1), in which nuclei or cells that were denoted as primary objects were identified, and the normalized intensities of the respective protein stained were measured against nuclear or cell area (Carpenter et al. 2006). Data were plotted using GraphPad Prism (version 9).
Embryos
Embryos were fixed for 10 min in 4% PFA, permeabilized for 15 min in 0.2% Triton X-100 (Sigma-Aldrich T8787) in PBS, and incubated for 1 h at RT in blocking buffer (0.2% Triton X-100 in PBS + 2% BSA fraction V 7.5% [Thermo Fisher Scientific 15260-037] + 5% goat serum [Jackson Immunoresearch/Dianov, 017-000-121]) and then overnight at 4°C with primary antibodies diluted in blocking buffer CDX2 1:100 (Biogenex MU392A-UC), NANOG 1:100 (ReproCell Tebu Bio RCAB002P-F). Afterward, embryos were washed for 3 × 10 min with wash buffer (0.2% Triton X-100 in PBS + 2% BSA), incubated with secondary antibodies (donkey antimouse Alexa Fluor 680 [Thermo Fisher Scientific A32788] and donkey antirabbit Alexa Fluor 568 [Thermo Fisher Scientific A10042], 1:700) for 1 h at RT, and washed again for 3 × 10 min with wash buffer. Embryos were mounted on a microscope slide with a Secure-Seal spacer (eight wells, 9-mm diameter, 0.12 mm deep; Thermo Fisher Scientific S24737), covered with cover glass, and sealed with nail polish. Imaging and quantifications were performed as described above.
Apoptosis assay
Cells adherent to the plate and floating cells were collected for the apoptosis assay. Cells were dissociated using TrypLE, washed in cold PBS, and resuspended in Annexin binding buffer (10 mM HEPES, 140 mM NaCl, and 2.5 mM CaCl2 at pH 7.4). Staining for Annexin V was performed following the manufacturer's instructions (Thermo Fisher Scientific R37174) along with dead cell stain SYTOX AADvanced (Thermo Fisher Scientific S10274) for 15 min at room temperature. A FACS AriaFusion flow cell cytometer was used to analyze cell staining. Data were analyzed using FlowJo (version 10) and plotted using GraphPad Prism (version 9).
TFBS mining at candidate miRNA promoters
To identify potential TFs regulating the set of concordant up-regulated miRNAs, we performed a motif search over the promoter sequences of these miRNAs. Promoters were taken from de Rie et al. (de Rie et al. 2017), totaling 1468 promoter regions (lifted over to mm10 genome assembly), each associated to one miRNA. Overlapping regions were merged, resulting in 641 sequences. Larger regions were then identified by extending from the 3′ end by 1500 nucleotides upstream and 500 nucleotides downstream. Motifs of TFs were obtained from the JASPAR database (Castro-Mondragon et al. 2021), taking the set of 841 vertebrates’ nonredundant position frequency matrices. The Matrix-Scan tool from RSAT (Santana-Garcia et al. 2022) was applied to scan the sequences, requiring a maximum P-value per site of 0.1. Background frequencies were calculated from the input set of sequences (Markov = 1, bg_pseudo = 0.01). This scan resulted in a total of 5,389,949 motif hits across the 641 promoter sequences. Hits were further filtered on their sequence-matching score, so as to keep for each TF hits above the median hit-score, resulting in a total subset of 453,101 motif hits. Finally, for each TF, a Fisher's exact test was applied to assess whether that TF showed enriched binding sites (relative to other TFs) within the promoter sequences of the up-regulated miRNAs (N = 14) compared with a background set of promoter sequences corresponding to all other expressed miRNAs (N = 91). A total of 215 TFBS motifs presented an odds-ratio greater than one, indicating a relatively greater proportion of candidate promoters with a motif hit over other promoters. Filtering for an odds-ratio greater than two and a raw P-value lower than 0.1 yielded the set of 16 TFs whose binding sites are enriched among the concordant up-regulated miRNAs and that therefore represent potential regulators of dormancy.
CUT&Tag
Sample preparation
Frozen nuclei were used, and CUT&Tag was performed as described previously (Kaya-Okur et al. 2019). Primary antibody (TFE3, Sigma-Aldrich HPA023881, 1:50; IgG, Abcam ab46540, 1:100) incubation was performed by incubating the beads with gentle nutation overnight at 4°C. Secondary antibody (guinea pig alpha-rabbit antibody, 1:100; Antibodies Online ABIN101961) incubation was performed for 30 min at RT. Beads were separated from the secondary antibody and washed once in 200 μL of wash buffer. Homemade pA-TN5 preloaded with mosaic-end adapters was used for tagmentation in 50 μL of tagmentation buffer (10 mM MgCl2 in wash buffer) for 1 h at 37°C. DNA was purified using ChIP DNA Clean & Concentrator (Zymo Research D5205) following instructions in the manufacturer's manual. The final CUT&Tag DNA was eluted in 25 μL of elution buffer. NGS libraries were prepared as described. Library QC was performed using Agilent high-sensitivity D5000 ScreenTape system and QubitTM dsDNA HS assay (Invitrogen). Libraries were sequenced on Illumina NovaSeq in paired-end mode at 5 million to 8 million fragments per library.
Analysis
Raw reads were subjected to adapter and quality trimming with cutadapt (version 2.4; parameters: ‐‐quality-cutoff 20 ‐‐overlap 5 ‐‐minimum-length 25 ‐‐adapter AGA TCGGAAGAGC -A AGA TCGGAAGAGC) (Martin 2011) as were their respective input samples. Reads were aligned to the mouse genome (mm10) using BWA with the “mem” command (version 0.7.17, default parameters). A sorted BAM file was obtained and indexed using SAMtools (Li and Durbin 2009) with the “sort” and “index” commands (version 1.10). Duplicate reads were identified and removed using GATK (version 4.1.4.1) (McKenna et al. 2010) “MarkDuplicates” and default parameters. After careful inspection and validation of high correlation, replicates of treatment and input samples were merged, respectively, using SAMtools “merge.”
The smoothed counts per million (CPM) signal was aggregated over extended promoter regions (defined as 1500 bp upstream of and 500 bp downstream from the TSS) by taking the maximum value over the regions and scaling those by the 95th quantile value across the promoters for each condition. To further quantify the increased or decreased signal in paused over control samples, the log2 ratio of these maximum values was calculated, yielding for each promoter a positive value for relative increase signal or a negative value for relative decrease. Finally, a one-sided Mann–Whitney U test was performed to evaluate whether promoters of candidate miRNAs presented a greater increase in signal in paused samples, compared with promoters of other measured miRNAs with available signal, that are not associated with the regulation of the candidate miRNAs (N = 88 from the previous 91 promoters).
Nascent RNA expression analysis
Twenty-five thousand wild-type or Dgcr8 KO cells or morula aggregated mouse blastocysts in normal or MTORi conditions were plated onto 0.1% gelatin-coated glass coverslips. EU staining was performed using a Click-iT RNA imaging kit (Invitrogen C10329) following the manufacturer's protocol. The coverslips were then mounted with Vectashield (VectorLabs H-1000) and sealed with nail polish. Imaging and quantification were performed as described above.
Differential gene expression analysis
Transcript abundance estimations per sample were obtained with kallisto (Bray et al. 2016) and imported to R (R Core Team 2021) with the Bioconductor package tximport (Soneson et al. 2015). tximport summarizes transcript-level abundance estimates for gene-level analysis. Differential gene expression was performed with the Bioconductor package DESeq2. Differentially expressed genes between WT paused versus normal and Dgcr8 KO paused versus normal were defined as those with Padj < 0.05 and |log2FC| > 1.
Data access
All raw and processed sequencing data generated in this study have been submitted to the NCBI Gene Expression Omnibus (GEO; https://www.ncbi.nlm.nih.gov/geo/) under accession number GSE245226. The proteomic data generated in this study have been submitted to the PRIDE database (https://www.ebi.ac.uk/pride/) (Martens et al. 2005) under accession number PXD044550. The custom codes used in this paper are available as Supplemental Code and at GitHub (https://github.com/marsico-lab/mirna_embryo_pausing).
Competing interest statement
The authors declare no competing interests.
Acknowledgments
We thank Vera van der Weijden, Igor Ulitsky, Jan-Wilhelm Kornfeld, and Volker Busskamp for discussions and feedback, and the scientific service facilities of the Max Planck Institute for Molecular Genetics for excellent service. We thank Jennifer Shay, Cordula Mancini, and Birgit Romberg for assistance; Beata Lukaszewska-McGreal for proteome sample preparation; and Tuğçe Aktaş for the SRSF2 antibody. The Dgcr8 KO ES cell line was a kind gift of Constance Ciaudo. This project was supported by a German Academic Exchange Service (DAAD) PhD fellowship to D.P.I. (91730547), the Deutsche Forschungsgemeinschaft (SFB/TR-84 TP C01) to A.M. and L.M., the Helmholtz Center (A.M.), the Max Planck Society (A.B.-K.), and the Sofja Kovalevskaja Award (Humboldt Foundation) to A.B.-K.
Author contributions: A.B.-K. and D.P.I. conceived the project. D.P.I. performed all experiments except embryo laser dissections, aggregations, and CUT&Tag. Embryo manipulations were performed by L.W. and the Transgenic Facility of the Max Planck Institute. C.-Y.C. performed CUT&Tag. L.M. performed all computational analyses except bulk RNA-seq. The latter was performed by F.R.R. under the supervision of S.C. A.M. and A.B.-K. supervised the project. All authors contributed to the manuscript.
Footnotes
-
[Supplemental material is available for this article.]
-
Article published online before print. Article, supplemental material, and publication date are at https://www.genome.org/cgi/doi/10.1101/gr.278662.123.
- Received October 25, 2023.
- Accepted April 10, 2024.
This article is distributed exclusively by Cold Spring Harbor Laboratory Press for the first six months after the full-issue publication date (see https://genome.cshlp.org/site/misc/terms.xhtml). After six months, it is available under a Creative Commons License (Attribution-NonCommercial 4.0 International), as described at http://creativecommons.org/licenses/by-nc/4.0/.


