
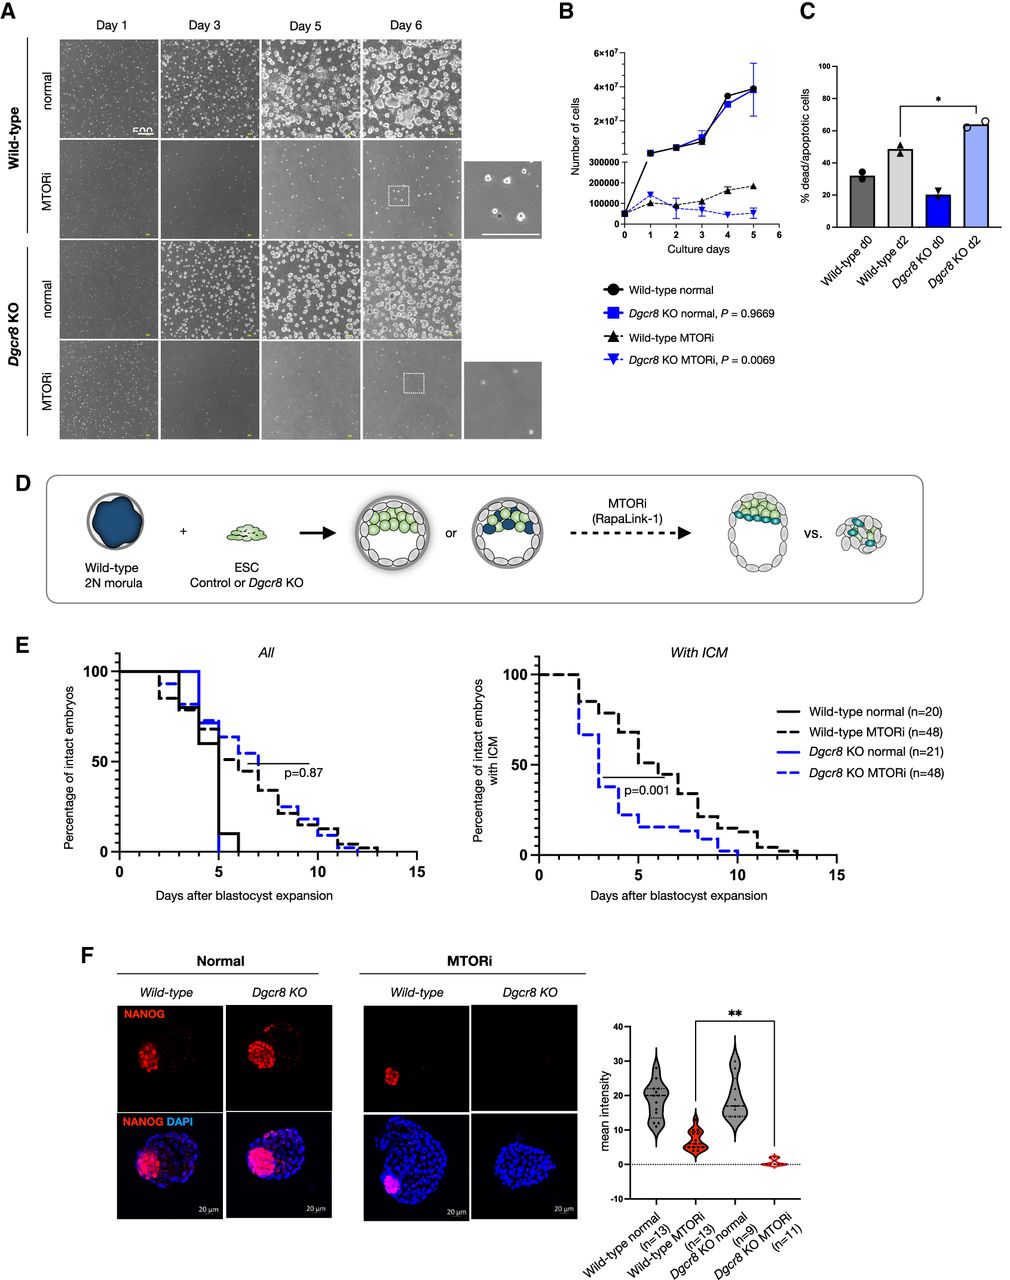
miRNAs are indispensable for the transition of mouse ESCs and embryos into dormancy. (A) White field images of wild-type and Dgcr8 KO mouse ESCs in normal (proliferative) and dormancy conditions. Cells were induced to enter a diapause-like dormant state via MTOR inhibition (MTORi). INK128, a catalytic MTOR inhibitor, was used. Scale bar, 500 µm. (B) Proliferation curves of wild-type and Dgcr8 KO ESCs in normal (proliferative) and dormancy conditions. Cells were plated at low density on six-well plates and counted on the shown days without splitting. The statistical test is a nonlinear regression (curve fit), in which Dgcr8 KO cells have been compared with the wild type for either normal or MTORi conditions. (C) Analysis of apoptosis levels via staining of Annexin V5, followed by flow cytometry analysis. The statistical test is a one-way ANOVA with multiple testing correction. (*) P-value < 0.05. (D) Schematics of morula aggregation experiments and the subsequent testing of embryo pausing efficiency. EGFP-labeled wild-type or Dgcr8 KO mouse ESCs were aggregated with wild-type morulae. These were cultured until the blastocyst stage and then treated with DMSO or MTORi. The number of expanded embryos with or without ICM was counted every day. Embryos with a blastocoel and unfragmented TE were considered intact. Dgcr8 KO ESCs contributed highly to the ICM (Supplemental Fig. S1). (E) Survival curves of chimeric wild-type or Dgcr8 KO embryos under MTORi-induced pausing conditions. (Left) All intact embryos, (right) embryos with a visible ICM. All wild-type embryos retained the ICM during pausing, whereas most Dgcr8 KO embryos lacked it. The statistical test is a Mantel–Cox test, with wild-type paused embryos as a reference data set. (F) Immunofluorescence staining of normal and MTORi-treated (day 3) blastocysts for the epiblast marker NANOG, the trophectoderm marker CDX2, and the DNA stain DAPI. Right panel shows the number of NANOG+ cells in each condition. Nine to 13 embryos were stained in each group. Dgcr8 KO embryos treated with MTORi either lack the ICM or contain NANOG− cells. Scale bar, 20 µm. Statistical test is a one-way ANOVA with multiple testing correction. (**) P-value < 0.01.


