
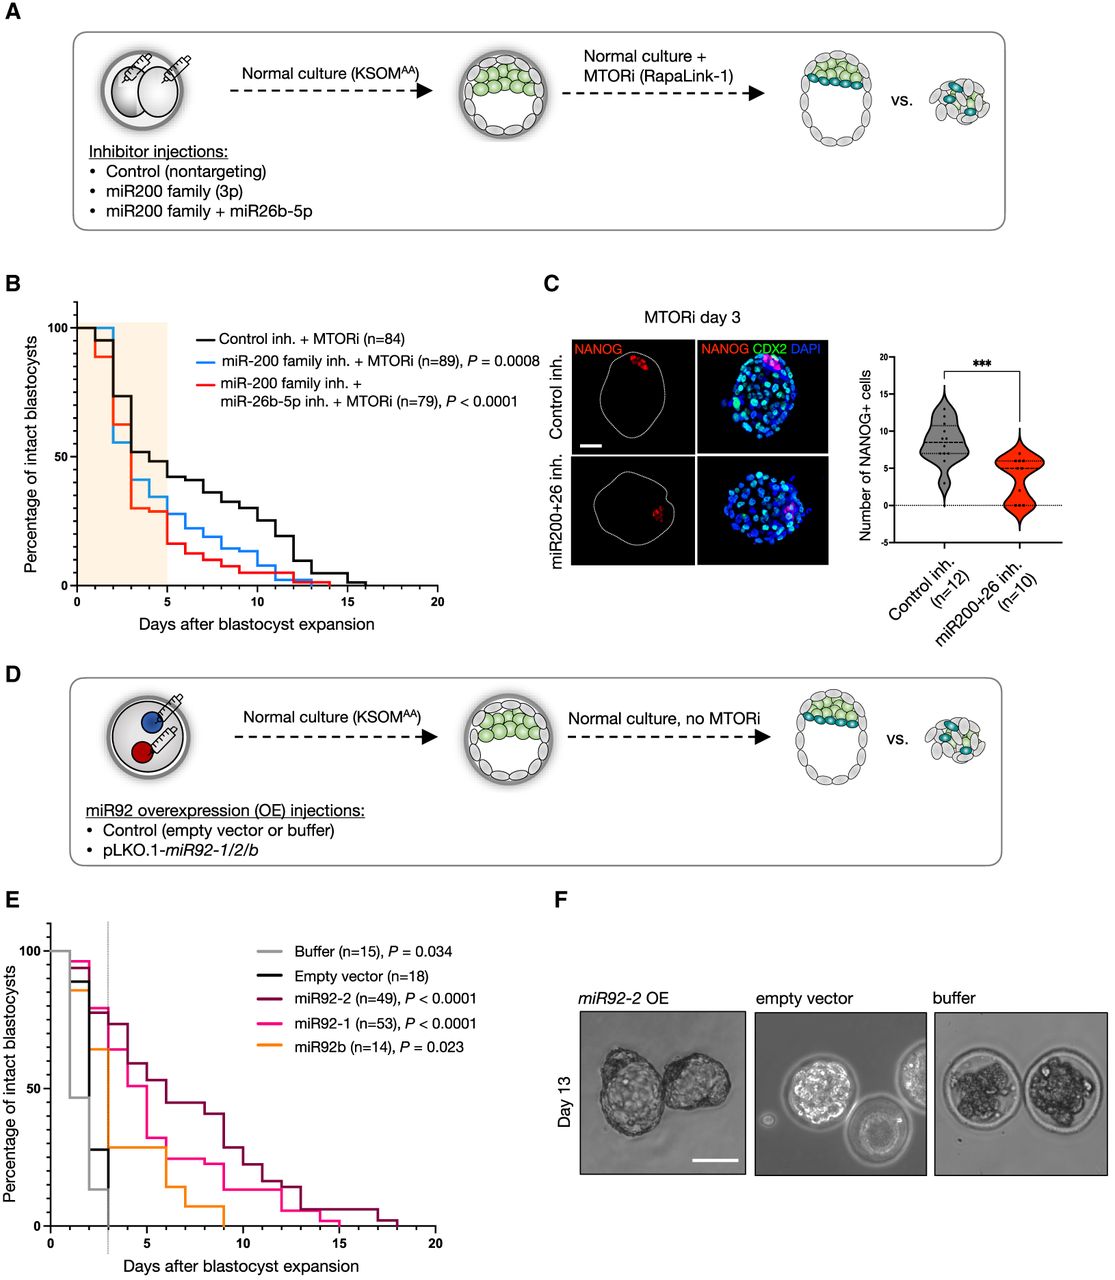
Combinatorial miRNA activity promotes efficient transition to dormancy during in vitro diapause. (A) Schematics of the experiment. Two-cell-stage embryos were microinjected with synthetic miRNA inhibitors (antimiRs) against the miR-200 family and miR-26b-5p or with a control inhibitor (nontargeting). After injection, the embryos were cultured until the blastocyst stage under standard conditions and treated afterward with DMSO or RapaLink-1 to induce in vitro diapause. (B) Survival curves of embryos generated as described above. The number of expanded embryos was counted every day. Embryos with a blastocoel and unfragmented TE were considered intact. Statistical test is a Mantel–Cox test with control inhibitor + MTORi as the reference data set. (n) Number of embryos. (C) Immunofluorescence staining of control-injected or antimiR-injected representative embryos on day 3 of MTORi treatment for the epiblast marker NANOG, the trophectoderm marker CDX2, and the DNA stain DAPI. Right panels show the number of NANOG+ cells per embryo in each condition. (n) Number of embryos. Statistical test is an unpaired t-test with Welch's correction. (***) P-value < 0.001. Scale bar, 20 µm. (D) Schematics of miR92 overexpression (OE). Zygotic pronuclei were injected with the linearized miR92 overexpression construct (pLKO.1 background, U6 promoter), empty vector, or injection buffer. The embryos were cultured in standard medium without MTORi until the end of the assay. For scoring, the same procedure as in A is applied. (E) Survival curves embryos miR92 OE or control embryos. (n) Number of embryos in each group. Statistical test is a Mantel–Cox test with empty vector injection as the control data set. (F) Bright field images of miR92 OE or control embryos on day 13 of in vitro culture without MTORi. Scale bar, 100 µm.


