
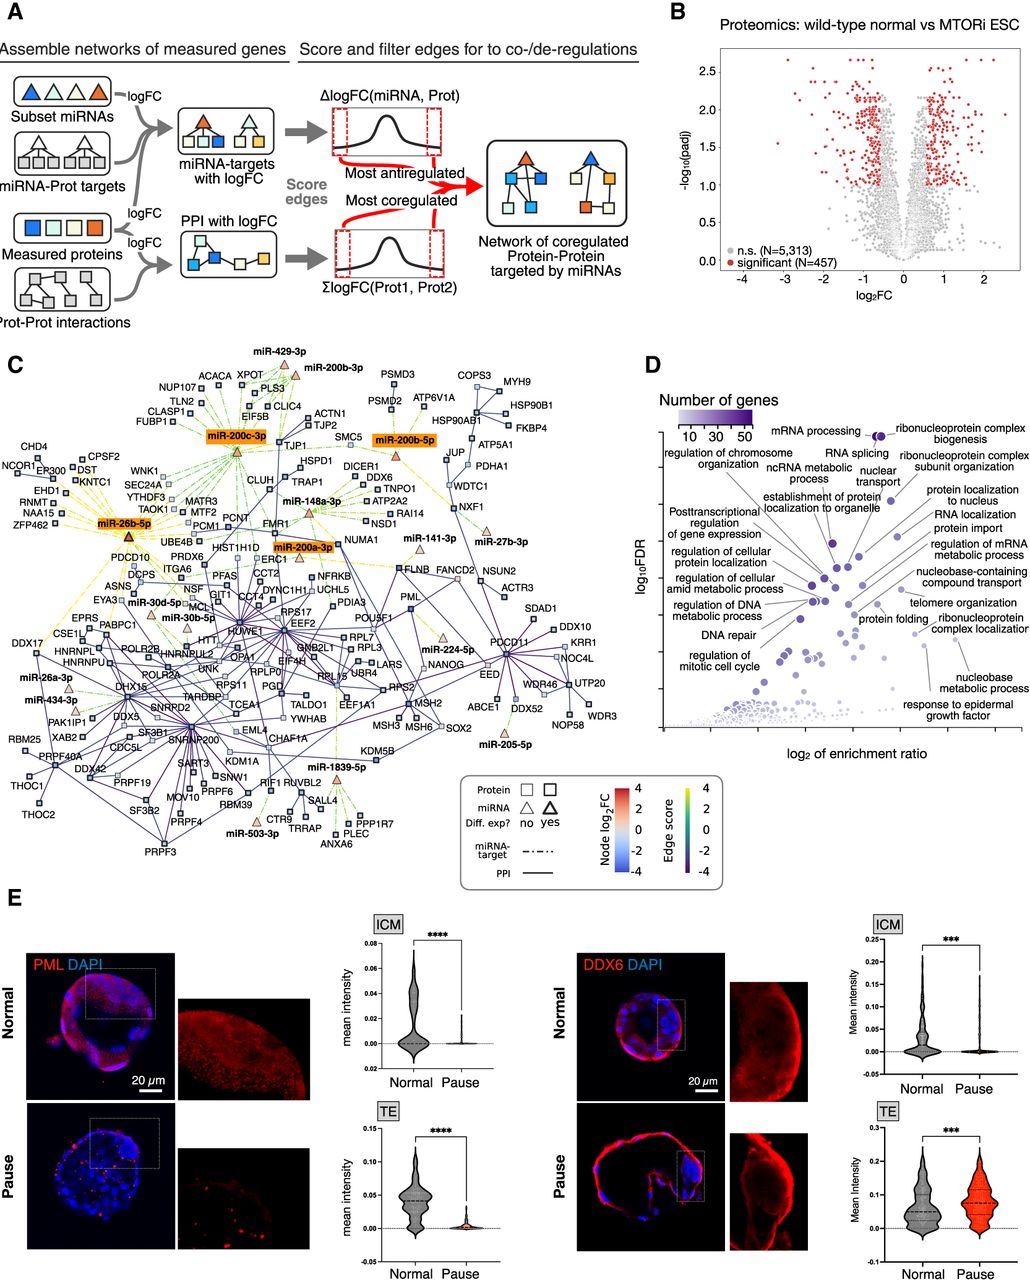
The miRNA–target network of the paused pluripotent state. (A) Schematics of the computational analysis to construct the network. From the measured logFC of proteins and miRNAs, scores are assigned to edges to assess concordant (for proteins interactions) or discordant (miRNA–target targets) regulation. Comparison of actual scores to a distribution from random pairings enables the identification of the most extreme edge scores to keep in the final network. (B) Differential expression analysis of normal and paused wild-type ESC proteomes; 457 proteins are significantly differentially expressed (216 up, 241 down) using the criteria log2FC > 0.5 and Padj < 0.1. (C) miRNA network of concordantly up-regulated miRNAs and their significantly down-regulated target proteins. A stringency cutoff is applied to keep the top 10% of miRNA–target edges and the top 1% of protein–protein interactions. P = 1.3 × 10⁻³⁰ from Fisher's exact test (one-sided) for enrichment in differentially expressed protein. A less stringent network with the first cutoff lowered to the top 30% of miRNA–target edges is in Supplemental Figure S5B, whereas an ESC-only network is provided in Supplemental Figure S6. (D) Gene Ontology analysis of in-network proteins. (E) Immunofluorescence stainings and quantifications of the in-network PML and DDX6 proteins in MTORi-paused embryos. Single-cell quantifications were performed for the ICM and TE separately by manually cropping the images. Between seven and nine embryos were stained in each group. Scale bar, 20 µm. Statistical test is an unpaired t-test. (***) P-value < 0.001; (****) P-value < 0.0001. Supplemental Figure S8 contains additional stainings in ESCs. Scale bar, 20 µm.


