
Analyzing super-enhancer temporal dynamics reveals potential critical enhancers and their gene regulatory networks underlying skeletal muscle development
- Song Zhang1,2,7,
- Chao Wang1,2,3,7,
- Shenghua Qin1,2,7,
- Choulin Chen1,2,3,
- Yongzhou Bao1,2,
- Yuanyuan Zhang1,2,
- Lingna Xu1,2,
- Qingyou Liu4,
- Yunxiang Zhao5,
- Kui Li1,2,6,
- Zhonglin Tang1,2,6 and
- Yuwen Liu1,2,6
- 1Shenzhen Branch, Guangdong Laboratory for Lingnan Modern Agriculture, Key Laboratory of Livestock and Poultry Multi-Omics of MARA, Agricultural Genomics Institute at Shenzhen, Chinese Academy of Agricultural Sciences, Shenzhen 518124, China;
- 2Innovation Group of Pig Genome Design and Breeding, Research Centre for Animal Genome, Agricultural Genomics Institute at Shenzhen, Chinese Academy of Agricultural Sciences, Shenzhen 518124, China;
- 3Key Laboratory of Agricultural Animal Genetics, Breeding and Reproduction of Ministry of Education and Key Laboratory of Swine Genetics and Breeding of Ministry of Agriculture, College of Animal Science and Technology, Huazhong Agricultural University, Wuhan 430070, China;
- 4Guangdong Provincial Key Laboratory of Animal Molecular Design and Precise Breeding, School of Life Science and Engineering, Foshan University, Foshan 528225, China;
- 5Guangxi Key Laboratory of Animal Breeding, Disease Control and Prevention, College of Animal Science and Technology, Guangxi University, Nanning 530004, China;
- 6Kunpeng Institute of Modern Agriculture at Foshan, Agricultural Genomics Institute at Shenzhen, Chinese Academy of Agricultural Sciences, Foshan 528226, China
-
↵7 These authors contributed equally to this work.
Abstract
Super-enhancers (SEs) govern the expression of genes defining cell identity. However, the dynamic landscape of SEs and their critical constituent enhancers involved in skeletal muscle development remains unclear. In this study, using pig as a model, we employed cleavage under targets and tagmentation (CUT&Tag) to profile the enhancer-associated histone modification marker H3K27ac in skeletal muscle across two prenatal and three postnatal stages, and investigated how SEs influence skeletal muscle development. We identify three SE families with distinct temporal dynamics: continuous (Con, 397), transient (TS, 434), and de novo (DN, 756). These SE families are associated with different temporal gene expression trajectories, biological functions, and DNA methylation levels. Notably, several lines of evidence suggest a potential prominent role of Con SEs in regulating porcine muscle development and meat traits. To pinpoint key cis-regulatory units in Con SEs, we developed an integrative approach that leverages information from eRNA annotation, genome-wide association study (GWAS) signals, and high-throughput capture self-transcribing active regulatory region sequencing (STARR-seq) experiments. Within Con SEs, we identify 20 candidate critical enhancers with meat and carcass-associated DNA variations that affect enhancer activity, and infer their upstream transcription factors and downstream target genes. As a proof of concept, we experimentally validate the role of one such enhancer and its potential target gene during myogenesis. Our findings reveal the dynamic regulatory features of SEs in skeletal muscle development and provide a general integrative framework for identifying critical enhancers underlying the formation of complex traits.
Skeletal muscle, which constitutes nearly half of the body weight, is the most abundant tissue and plays essential roles in contraction, movement, energy storage, energy delivery, and homeostasis (Mukund and Subramaniam 2020). For the study of skeletal muscle development, the pig (Sus scrofa) offers significant advantages, due to its anatomical, structural, immunological, genomic, and physiological similarities to humans (Lunney et al. 2021). Additionally, muscle samples from pigs can be easily obtained at various prenatal and postnatal stages from genetically similar individuals.
Porcine skeletal muscle (PSM) development is divided into prenatal myofiber formation and postnatal myofiber hypertrophy. Our previous study identified four important developmental phases: embryonic (33–65 days after conception, abbreviated as E33–E65), fetal (E70–E105), neonatal (0–60 days after birth, abbreviated as D0–D60), and adult (D80–D180) (Yang et al. 2021a). By E60 of the embryonic phase and E90 of the fetal phase, primary and secondary myofibers are fully formed, respectively (Beermann and Cassens 1977; Muráni et al. 2007). During the neonatal period, the transition between slow/fast myofiber types significantly affects pork quality (Zhang et al. 2022). The adult period, or growing–fattening stage (Van Erp-Van der Kooij et al. 2003; Scheffler et al. 2014), involves rapid myofiber hypertrophy with muscle satellite cells (MuSCs) proliferating and differentiating in response to high-nutrient diets and growth hormones (Brameld 1997; Bi and Kuang 2012). Understanding prenatal and postnatal PSM development is essential for elucidating the transcriptional regulatory networks that govern skeletal muscle growth and development.
During skeletal muscle development, myogenic differentiation is driven by transcription factors (TFs) from the myogenic regulatory factor (MRF) family (MYOD1, MYOG, MYF5, and MYF6) and myocyte enhancer factor 2 (MEF2) family (MEF2A, MEF2B, MEF2C, and MEF2D) (Hernández-Hernández et al. 2017). These TFs bind cis-regulatory elements (CREs), such as enhancers, to spatiotemporally regulate gene expression (Yan et al. 2019; Zhao et al. 2021). One approach to identifying critical enhancers underlying PMS development is by locating super-enhancers (SEs), which are characterized by dense clusters of H3K27ac modifications and play pivotal roles in regulating genes that define cell identity (Hnisz et al. 2013; Whyte et al. 2013). Another approach involves integrating population genetics data with functional genomics data. Populations with enhancer DNA variations act as natural genetic screens, shedding light on associations between enhancers and their significant biological functions. Along this line of thinking, several studies have successfully identified critical enhancers that contribute to the genetic basis of complex traits (He et al. 2015; Aneas et al. 2021; Liu et al. 2022). However, the search for these enhancers remains in its early stages compared to the identification of critical genes.
Fully exploiting enhancers to elucidate molecular mechanisms of complex traits relies on accurately and comprehensively annotating DNA regions with enhancer activity. Pioneers in this field include the Encyclopedia of DNA Elements (ENCODE), the modENCODE, and the Roadmap Epigenome Project, which characterize the enhancer landscape in humans and model organisms (Shen et al. 2012; The ENCODE Project Consortium 2012; Yue et al. 2014; Roadmap Epigenomics Consortium et al. 2015). The Functional Annotation of Animal Genomes (FAANG) consortium initiated similar enhancer profiling in livestock in 2019 (Giuffra et al. 2019), followed by other studies that collectively built annotations of potential enhancers in various pig tissues (Kern et al. 2021; Pan et al. 2021; Yuan et al. 2021; Yue et al. 2021; Zhao et al. 2021; Li et al. 2022; Zhu et al. 2022). However, in skeletal muscle, prior studies lack well-characterized temporal enhancer dynamics from prenatal to postnatal stages, and pinpointing critical trait-affecting enhancers remains largely unaddressed. In the present study, we aim to fill this gap by identifying potential critical enhancers and their gene regulatory networks during PSM development.
Our approach involves analyzing developmental trajectories of PSM SEs and incorporating SE profiling with multiomics data, and high-throughput screening for DNA variants affecting enhancer activity (Fig. 1). We first performed cleavage under targets and tagmentation (CUT&Tag) (Kaya-Okur et al. 2019) to profile H3K27ac and identify SEs in PSM samples across myofiber formation and hypertrophy stages. By developing an innovative approach integrating SE temporal patterns, eRNA annotation, genome-wide association study (GWAS) signals, and self-transcribing active regulatory region sequencing (STARR-seq) experiments, Our study not only reveals the critical enhancer-mediated mechanisms underlying PSM development but also provides a general framework for investigating how enhancers contribute to the genetic basis of complex traits.
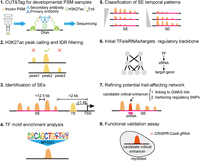
Workflow for revealing potential critical enhancers and trait-affecting gene regulatory networks during PSM development. (1) CUT&Tag libraries from frozen PSM samples across five developmental stages are produced and sequenced. (PSM) porcine skeletal muscle. (2) H3K27ac peaks are identified at each developmental stage and filtered for intragroup consistency. (IDR) irreproducibility discovery rate. (3) Identify SEs and typical enhancers (TEs) based on distal H3K27ac peaks. (ROSE) ranked order of super-enhancers, (TSSs) transcription start sites. (4) Analysis of enriched TF motifs on SEs. (5) Using hierarchical clustering to reveal temporal patterns of SEs. (6) Construct gene regulatory networks mediated by potential critical enhancers based on TF motif scanning and coexpression relationships among TFs, eRNAs, and target genes. (7) Refinement of trait-affecting regulatory network by identifying candidate critical enhancers within SEs, characterized by eRNA transcription and GWAS variants modulating enhancer activity. (8) Validate the role of candidate critical enhancers in myogenic differentiation using CRISPR–Cas9-mediated enhancer knockout in C2C12 cells.
Results
Dynamic H3K27ac landscape across prenatal and postnatal stages of PSM
To investigate the enhancer landscape during myofiber formation and hypertrophy phases in skeletal muscle, we generated high-quality CUT&Tag H3K27ac (Supplemental Table S1) profiling in domestic pigs (Landrace) across five well-characterized developmental stages (E60, E90, D0, D60, and D180) (Fig. 2A). By combining two biological replicates via the irreproducible discovery rate (IDR) method (Li et al. 2011), we identified 15,390, 31,138, 30,817, 29,991, and 42,981 H3K27ac peaks at E60, E90, D0, D60, and D180, respectively (Supplemental Fig. S1A; Supplemental Table S2). These peaks overlapped with the majority of skeletal muscle-specific enhancers identified by Zhao et al. (2021), while exhibiting low overlap with their enhancers specific to other tissues (Supplemental Fig. S1B), reinforcing the robustness of our findings. Pearson's correlation analysis (Supplemental Fig. S1C) and principal component analysis (Supplemental Fig. S1D) for H3K27ac signals revealed distinct stage-dependent segregation, with differentiation of H3K27ac signals before and after birth (Supplemental Fig. S1E). This indicates significant variation in H3K27ac modification during PSM development. Further analysis of H3K27ac dynamics, conducted using Short Time-series Expression Miner (STEM) software (Ernst and Bar-Joseph 2006), revealed 14 distinct H3K27ac signal profiles, suggesting a complex functional landscape. Increasing and decreasing H3K27ac signals (Supplemental Fig. S1F) are associated with genes exhibiting corresponding changes in expression levels, respectively (Supplemental Fig. S1G,H; Supplemental Methods). Notably, elevated H3K27ac signals were associated with genes involved in muscle development, whereas reduced signals were associated with genes related to basal metabolism (Supplemental Fig. S1I; Supplemental Methods). Together, these findings indicate that H3K27ac signals and associated gene expression undergo significant changes throughout PSM development, potentially serving as key drivers of this biological process.
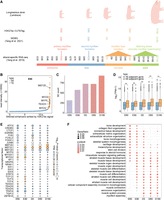
Identification and characterization of SEs. (A) Illustration of developmental PSM samples and three types of high-throughput sequencing data. CUT&Tag data were generated in this study, while whole genome bisulfite sequencing (WGBS) and strand-specific RNA-seq data were previously published by our group. (B) Classification of stitched enhancers as TEs and SEs based on H3K27ac signal (taking E90 stage as an example). Several muscle-specific genes proximal to SEs are highlighted. (C) Number of SEs identified at each developmental stage. (D) Comparison of gene expression associated with TEs and SEs at each stage. Statistical significance between groups was assessed using a two-sided Student's t-test. (*) P < 0.05, (**) P < 0.01. Unless explicitly stated, a two-sided Student's t-test is the default method for differential comparisons. (E) Top 30 TF motifs with the highest standard deviation of enrichment significance P in SEs across five developmental stages. Only TFs with significant motif enrichment (P < 1 × 10⁻¹⁰ at least at one stage) and sufficient mRNA abundance (transcripts per million [TPM] ≥ 3 at least at one stage) were retained. (F) Gene Ontology (GO) enrichment analysis of SEs at each stage.
SEs exhibit temporal regulatory features associated with PSM development
H3K27ac signals are canonical markers for active enhancers and promoters (Creyghton et al. 2010). We defined H3K27ac peaks within 1000 bp upstream and 500 bp downstream from gene transcription start sites (TSSs) as potential active promoters, while the remaining peaks were classified as potential active enhancer. Across the five developmental stages, enhancers exhibited a broader quantity spectrum and greater activity dynamics than promoters (Supplemental Fig. S2A,B). Enhancers were enriched with muscle-specific TF motifs and displayed developmental stage specificity (Supplemental Fig. S2C), whereas promoters mainly contained general TF motifs and lacked dynamic enrichment (Supplemental Fig. S2D). Additionally, the average number of enhancers per promoter increased from 1.35 to 3.60 during PSM development (Supplemental Fig. S2E), indicating growing redundancy and regulatory complexity among enhancers.
To investigate critical enhancers, we used ROSE software for SE discovery (Whyte et al. 2013), analyzing IDR-consistent H3K27ac peaks. We observed several key MRF genes (MYOD1, MYOG, and MYF5) with adjacent SEs (Fig. 2B). The number of SEs increased gradually from 321 at E60 to 929 at D180 (Fig. 2C). SE-adjacent genes exhibited significantly higher expression levels than TE-adjacent genes, aligning with previous studies that SEs have a stronger cis transcription-stimulating effect than TEs (Fig. 2D). Although both SEs (Fig. 2E) and TEs (Supplemental Fig. S3A) displayed similar stage-specific enrichment patterns for muscle-specific TF motifs, they differed in GO term enrichment. SEs were increasingly enriched in categories such as muscle development, muscle differentiation, myofibril assembly, and muscle contraction (Fig. 2F), while TEs maintained a stable pattern (Supplemental Fig. S3B). This suggests that SEs play a more significant role in dynamically regulating critical genes during PSM development, a phase characterized by substantial shifts in transcriptional programs and cell states.
To further investigate the functional significance of SEs compared to TEs, we analyzed their enrichment for various genetic features associated with regulatory activities (see Supplemental Methods). We curated GWAS hits associated with pig meat and carcass traits from the Animal Quantitative Trait Loci (QTL) Database (Animal QTLdb) (Hu et al. 2019) and cis-expression quantitative trait loci (cis-eQTLs) identified in skeletal muscle from the PigGTEx portal (Teng et al. 2024). Both TEs and SEs showed significant enrichment (Permutation test, P < 0.05) for these GWAS hits and cis-eQTLs, but SEs consistently displayed higher enrichment levels (Supplemental Fig. S3C,D), emphasizing their central role in gene regulation and trait formation within PSM. Furthermore, SE sequences showed higher enrichment for conserved DNA elements across 103 mammalian species from the Ensembl database compared to TEs (Supplemental Fig. S3E). Previous studies have highlighted the importance of conserved noncoding DNA elements in vertebrate development (Woolfe et al. 2005). These findings align with the established role of SEs in governing master regulators that define cell identity, prompting us to focus our analysis on critical enhancers within SEs.
Continuous SEs may play a prominent role during PSM development
A recent study has demonstrated that SEs exhibit differential temporal patterns associated with distinct biological functions in several cell differentiation models (Kai et al. 2021). Applying their method to standardize SE components based on tertiles of constituent units, we performed hierarchical clustering on 1587 merged SEs, revealing three distinct temporal patterns: 397 continuous (Con) SEs, 756 de novo (DN) SEs, and 434 transient (TS) SEs (Fig. 3A; Supplemental Table S3). The H3K27ac intensity of the “mother” unit, the constituent enhancer unit with the strongest H3K27ac signal in each SE (Bojcsuk et al. 2017), displayed distinct patterns: Con SEs maintained a consistently stable signal, DN SEs gradually increased, and TS SEs progressively declined (Fig. 3A,B). These SE categories were associated with different biological functions (Fig. 3C) and gene expression trajectories (Fig. 3D). Specifically, Con SEs were enriched in processes related to muscle cell differentiation and development, neighboring key MRF genes such as MYOD1, MYOG (Fig. 3B), and MYF5. DN SEs were associated with skeletal muscle contraction and metabolism, while TS SEs mainly contributed to embryonic morphogenesis and vascular development. Additionally, enhancer units in Con SEs exhibited greater fluctuations in H3K27ac activity than those in DN and TS SEs (Supplemental Fig. S4A,B), aligning with the association of dynamic H3K27ac peaks with muscle development and muscle cell differentiation (Supplemental Fig. S4C). Collectively, our findings suggest a crucial type of SEs characterized by stable mother units and highly dynamic constituent units.
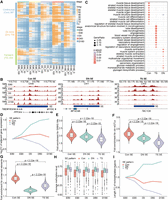
Classification and characteristics of temporal SEs. (A) Hierarchical clustering of SE signal vectors across five developmental stages, showing three distinct clusters. Each row represents an SE, characterized by its four representative enhancer units: strongest (maximum value), upper (second tertile), lower (first tertile), and weakest (minimum value), generated by a linear interpolation approach (see Methods for details). (B) Genome browser snapshots illustrating representative examples of Con, DN, and TS SEs. Tracks display H3K27ac CUT&Tag signals. (C) GO enrichment analysis for Con, DN, and TS SEs. (D) Average expression trends (relative to E60 stage) of genes associated with Con, DN, and TS SEs. Gene expression fold change (FC) values are log2 transformed. (E–G) Fold enrichment of Con, DN, and TS SEs for GWAS hits associated with pig meat and carcass traits (E), PSM cis-eQTLs (F), and mammalian conserved DNA elements (G). (H) Average DNA methylation levels of Con, DN, and TS SEs across five PSM stages. (I) Changes in the length of DNA nonmethylated regions within three types of SEs relative to the E60 stage. CpG sites are classified as methylated or nonmethylated, with contiguous nonmethylated sites merged into nonmethylated regions. See Supplemental Methods for details.
Compared to DN and TS SEs, Con SEs exhibited significantly higher enrichment for GWAS hits associated with pig meat and carcass traits (Fig. 3E), PSM cis-eQTLs (Fig. 3F), and conserved DNA elements (Fig. 3G), underscoring their prominent role in PSM development. Simulation analysis confirmed that these enrichment patterns were not confounded by the size distribution of different SE classes (Supplemental Fig. S4D). Notably, Con SEs had the lowest average DNA methylation levels across all five developmental stages (Fig. 3H), supporting the transition of enhancers from basal to active states (Sharifi-Zarchi et al. 2017) and facilitating changes in cell identity (Guo et al. 2017). Given that average methylation levels might mask local differences within SEs, we further assessed DNA methylation dynamics based on the length of nonmethylated regions within SEs (see Supplemental Methods). Our results indicated a positive correlation between the length of nonmethylated DNA region (Fig. 3I), H3K27ac intensity (Fig. 3A), and expression levels of adjacent genes of SEs (Fig. 3D), indirectly validating our SE categorization. Taken together, we present multiple lines of evidence robustly supporting the prominent regulatory role of Con SEs in PSM development.
Potential trait-affecting regulatory network mediated by candidate critical enhancers
To pinpoint critical enhancers influencing muscle-relevant traits within SEs, we constructed a transcriptional regulatory network using an innovative analytical framework (Fig. 4A). We first identified 11,807 bidirectionally transcribed eRNAs (see Supplemental Methods), which exhibited positive correlations with H3K27ac intensity and negative correlations with DNA methylation (Supplemental Fig. S5A–C). Scanning SE eRNAs for the presence of the top 30 dynamic TF motifs (Fig. 2E) and combining TF-target gene coexpression with eRNA-target gene coexpression across 27 developmental stages (Supplemental Fig. S5D,E; Yang et al. 2019), we inferred the upstream TFs and downstream target genes of the enhancers corresponding to these SE eRNAs. We then prioritized the network by retaining only SE eRNAs with GWAS variants associated with pig meat and carcass traits.
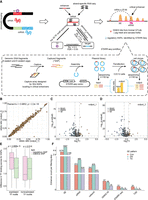
Screening strategy for candidate critical enhancers. (A) Candidate critical enhancers were defined as SE units meeting three conditions: transcribing eRNAs, overlapping with GWAS hits related to pig meat and carcass traits (trait classes from Animal QTLdb), and harboring eRNA-located GWAS single-nucleotide polymorphisms (SNPs) that modulated enhancer activity in STARR-seq experiments. (B) Correlation of allelic ratios for SNPs between two STARR-seq biological replicates. (C,D) Identification of enhancer-modulating regulatory SNPs by the change in allelic ratios between the output library, including replicate1 (C) and replicate2 (D), and the input library. Statistical significance (false discovery rate [FDR] < 0.05) was evaluated using Fisher's exact test. (E) DNA-binding motif-breaking scores were assessed for regulatory SNPs and inactive SNPs on binding motifs of TFs expressed (TPM ≥ 3 at least at one stage) and nonexpressed (TPM < 3 at all stages) in PSM. (F) Number of enhancers retained during candidate critical enhancer screening process. (TAD) topologically associating domain.
To exclude GWAS signals confounded by linkage disequilibrium (LD), we refined the network by filtering for GWAS SNPs that modulate enhancer activity using capture STARR-seq experiments. We designed a capture array targeting 300–400 bp DNA regions encompassing 610 SNPs within the retained SE eRNAs from eight eastern and eight western pigs, successfully capturing polymorphisms in 554 SNPs. The captured DNA fragments were cloned into the hSTARR-seq_ORI vector to construct input libraries, which were then transfected into mouse C2C12 myoblast cells. Fragment abundance was quantified in the output RNA-seq libraries, demonstrating robust screening performance with a high correlation in allelic ratios across biological replicates (Pearson's r = 0.98) (Fig. 4B). At FDR < 0.01 and |log2FC| > 0.58, we identified 55 regulatory SNPs affecting enhancer activity in both replicates (Fig. 4C,D; Supplemental Table S4). These SNPs showed significantly higher DNA-binding motif-breaking scores of TFs expressed in PSM compared to SNPs with no allelic enhancer activity (Fig. 4E; Supplemental Table S5). This difference was absent when considering motifs of TFs not expressed in PSM, highlighting the biological relevance (Fig. 4E). We also observed a fivefold enrichment of PSM cis-eQTLs among these regulatory SNPs (0.31 = 17/55) (Hypergeometric distribution test, P < 6.26 × 10⁻⁹), emphasizing their cis-regulatory potential in gene expression. We defined the enhancers containing these regulatory SNPs as candidate critical enhancers.
We further refined the network by filtering cis-regulatory interactions based on PSM topologically associating domains (TADs), retaining only interactions where the candidate critical enhancer and its potential target gene were within the same TAD (Zhao et al. 2021). The final network consisted of 30 candidate critical enhancers (20, 7, and 3 from Con, DN, and TS SEs, respectively) (Fig. 4F), 23 upstream TFs, and 85 downstream target genes (Fig. 5; Supplemental Table S6). Notably, nearly all regulatory SNPs (16/17) overlapping with PSM cis-eQTLs (Teng et al. 2024) resided in Con candidate critical enhancers (Supplemental Table S7). Among them, four eGenes associated with seven cis-eQTLs have been identified in our network as the target genes of these cis-eQTLs. The effects of these cis-eQTLs on eGenes and their regulatory impact on enhancers are consistent. For example, the cis-eQTL Chr12:34231267_C/T and eGene CUEDC1 showed a negative association (β = −0.19), where the T allele corresponded to reduced CUEDC1 expression. In our network, this cis-eQTL was located in an enhancer (Chr12:34230720–34231974) predicted to regulate CUEDC1, with the T allele consistently downregulating enhancer activity. These findings suggest the reliability of our network, as the observed enhancer-modulating activity aligns with eQTL associations. Overall, our approach identified candidate critical enhancers within SEs, particularly Con SEs, which likely play a pivotal role in mediating transcriptional regulatory networks related to PSM development and meat traits.
Potential trait-affecting regulatory network mediated by candidate critical enhancers. Lavender nodes represent TFs, pink nodes represent candidate critical enhancers, and light blue nodes represent target genes. The size of each node is proportional to its degree, signifying that larger nodes have more connections. Regulatory interactions flow from TFs to enhancers to target genes. The initial network was constructed by integrating TF motif scanning, TF-target gene coexpression, and eRNA-target gene coexpression. The final network was refined through a series of filtering steps: SE identification, eRNA identification, GWAS hit association, regulatory SNP identification, and TAD filtering.
A candidate critical enhancer is required for myogenic differentiation
Due to the strong association of Con SEs with muscle cell differentiation and pork traits, we hypothesized that deleting Con candidate critical enhancers using CRISPR–Cas9 would impact myogenic differentiation. To test this, we evaluated the conservation of these enhancers at three levels compared to the mouse genome (Fig. 6A) and conducted functional validation in C2C12 cells, a robust and well-established myogenesis model. Four enhancers met the following conservation criteria (Fig. 6B): having orthologous sequences in the mouse genome (sequence conservation), orthologous sequences overlapping H3K27ac signals from either of the six myogenic differentiation stages of C2C12 cells (Peng et al. 2017) (epigenomics conservation) (Fig. 6C; Supplemental Fig. S6A), and sharing the same adjacent target genes (synteny conservation).
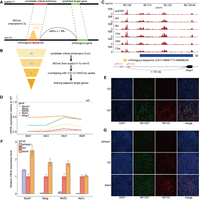
Conservation analysis and functional assay of candidate critical enhancers within Con SEs. (A) Schematic diagram illustrating the mapping of candidate critical enhancers to functional orthologous sequences in the mouse genome. (B) Flowchart illustrating the conservative filtering steps identifying functional orthologous sequences of candidate critical enhancers within Con SEs. The Arabic numerals indicate the number of candidate critical enhancers retained in each filtering step. (C) Genome browser snapshot displaying the mouse orthologous sequence of the candidate critical enhancer Chr12:34230720–34231974, extended 500 bp upstream and downstream. The tracks represent H3K27ac ChIP-seq signals across six stages during C2C12 myogenesis. The 24 h before induction of differentiation are denoted by “pre24hr,” and so forth. The gRNAs targeting the sequence and the predicted target gene were annotated. (D) qPCR analysis of the relative expression of four myogenic markers (Myod1, Myog, Mef2c, and Myhc) and one predicted target gene (Akap1) in wild-type (WT) and knockout (KO) C2C12 cells at four myogenic differentiation time points. KO cells were generated by deleting the orthologous sequence using CRISPR–Cas9. All qPCR data are presented as means ± SD of triplicate experiments. (E) Immunofluorescence staining of WT and KO C2C12 cells after 6 days of differentiation induction. Differentiated myotubes were labeled by immunostaining for MYOD1 (green) and MYHC (red), with nuclei stained by DAPI (blue). (F) qPCR analysis of the relative expression of myogenic markers in C2C12 cells with Akap1 knockdown on day 7 of myogenic differentiation. (G) Immunofluorescence staining for MYOD1 and MYHC was used to assess the effect of Akap1 knockdown on C2C12 differentiation.
Among these conserved enhancers, the one at Chr12:34230720–34231974 exhibited the highest collinear conservation, sharing the most adjacent target genes with its mouse ortholog. This enhancer is of particular interest as it contains rs81434214, a GWAS SNP associated with the obesity index (OI), a selection index in pig breeding that reflects genetic predispositions toward obesity or leanness (Kogelman et al. 2014). Lean-type pig breeds, such as western commercial Landrace and Yorkshire, exhibit higher myogenic potential compared to obese-type breeds like Chinese domestic Tongcheng and Meishan (Zhao et al. 2011, 2015; Qiu et al. 2020). This enhancer may thus play a crucial role in muscle mass and quality differences between these pig breeds.
To investigate the function of this enhancer, we performed a luciferase reporter assay, confirming that the A allele of its regulatory SNP (Chr12:34231458_T/A) reduced enhancer activity (Supplemental Fig. S6B,C), consistent with STARR-seq findings. CRISPR–Cas9 knockout of the orthologous sequence of this enhancer in C2C12 cells (Fig. 6C; Supplemental Fig. S7) led to reduced expression of myogenic marker (Myod1, Myog, Myhc) and predicted target gene Akap1 during myogenic differentiation (Fig. 6D), along with impaired differentiation (Fig. 6E). Consistently, siRNA knockdown of Akap1 (Supplemental Fig. S6D) also hindered C2C12 differentiation (Fig. 6F,G). These results serve as a proof of concept for our integrative strategy for identifying candidate trait-affecting enhancers and mapping their associated regulatory network.
Discussion
In this study, we identified dynamic SE trajectories closely linked to PSM development, introduced an innovative approach to pinpoint key enhancers driving the formation of complex traits, and applied this method to investigate the genetic basis of skeletal muscle development. To our knowledge, this study also represents the first comprehensive skeletal muscle SE landscape covering multidevelopmental stages before and after birth in any species, providing a valuable resource for skeletal muscle biology research.
Leveraging H3K27ac data from an extended developmental period, we partitioned SEs based on their temporal patterns and identified Con SEs as crucial regulators for PSM development. In mammals, prenatal myofiber formation determines postnatal myofiber number and plays a decisive role in skeletal muscle development (Ashmore et al. 1973; Picard et al. 2002). Consequently, the noncoding cis-regulatory regions of prenatal PSM were prioritized for profiling and investigation (Yue et al. 2021; Zhao et al. 2021). However, our results indicate that Con SEs, which persist in both prenatal and postnatal stages, are more closely associated with PSM development. These Con SEs are characterized by stable mother units and highly dynamic constituent units throughput PSM development. The mother units serve as the foundational precursors and cornerstones of SE architecture (Bojcsuk et al. 2017), potentially providing a primed platform for the dynamic constituent units to fine-tune gene expression during PSM development. Moreover, the low methylation levels of Con SEs ensure high accessibility of these constituent units to TFs (Moore et al. 2013), which may facilitate a rapid response to external stimuli, such as nutrition or hormones, ensuring timely and adaptive skeletal muscle development.
Our integrative approach leveraged Con SEs as regulatory hubs to identify critical enhancers affecting PSM development. A key challenge in enhancer profiling is pinpointing enhancers that truly influence phenotypes, as H3K27ac signals alone often mark both essential and nonessential enhancers. To overcome this, we employed an integrative approach that combined SE annotations with multiomics data. This strategy mirrors fine-mapping causal variants in GWAS studies and serves as an initial step to prioritize functional enhancers within SEs. SEs, known for regulating master transcriptional regulators during development, provided a fertile ground for identifying key constituent enhancers. Building on this foundation, we introduced Con SE annotation, which demonstrated a strong association with skeletal muscle GO terms and GWAS signals related to pork traits. To enhance functional annotation, we incorporated allele-specific STARR-seq signal analysis, aimed at filtering potential critical enhancers by evaluating the impacts of GWAS SNPs on enhancer activity. Together, this integrative approach offers an opportunity to identify critical enhancers supported by extensive evidence from epigenomic profiling, high-throughput enhancer screening, and population genetics.
The effectiveness of our integrative approach was highlighted by experimental validations demonstrating the regulatory impact of a candidate critical enhancer (Chr12:34230720–34231974) and its predicted target gene (AKAP1) in muscle differentiation. AKAP1 regulates mitochondrial respiration via AMPK-dependent phosphorylation (Hoffman et al. 2015), and its deficiency results in mitochondrial dysfunction (Soundararajan et al. 2022). Mitochondria function as cellular energy factories, crucial for metabolic regulation and ATP production, supporting skeletal muscle growth and development (Peterson et al. 2012; Abrigo et al. 2019). Additionally, mitochondrial function correlates with muscle fiber type and antioxidant capacity, influencing meat tenderness and flavor (Zhang et al. 2022). Hence, we hypothesized that AKAP1 might be a causal gene affecting pork yield and quality. Through the OI GWAS SNP within this enhancer, our study advances understanding of the genetic basis of pork production traits.
The recent publication of PigGTEx research provided an unprecedented amount of cis-eQTL data across various pig tissues (Teng et al. 2024), enabling a comprehensive interpretation of cis-regulatory effects underlying pig GWAS data. Compared to humans, skeletal muscle enhancers in pigs show less pronounced enrichment for skeletal muscle-specific cis-eQTLs (Supplemental Fig. S8A,B). This discrepancy may result from more precise identification of tissue-specific eQTLs in humans and broader LD regions in pigs. Given these challenges, high-throughput functional validation of enhancer-modulating SNPs, as demonstrated in this study, could effectively fine-map potentially causal variants within eQTL loci. Our findings indicate that 31% of identified enhancer-modulating SNPs correlate with PigGTEx skeletal muscle cis-eQTLs, primarily located in Con candidate critical enhancers, which are deemed essential for PSM development and pork traits. Notably, four eGenes with these cis-eQTLs were identified as potential target genes of the corresponding cis-eQTLs in our regulatory network. For these cis-eQTLs, alleles associated with enhanced enhancer activity consistently showed increased gene expression. This consistency suggests that our approach could facilitate the fine-mapping of functional cis-eQTL variants and potentially act as a proxy in situations where limited sample sizes hinder robust eQTL detection.
Our framework has several limitations and areas for improvements. We initially classified distal H3K27ac peaks as potential enhancers and proximal ones as promoters based on Ensembl TSS annotations (Ling et al. 2024; Wang et al. 2024), which may be incomplete for pigs. To address this, we used a lenient initial screen to retain potential enhancers, followed by STARR-seq for functional validation. Future improvements could involve better TSS annotations and integrating more histone marks. We also refined our regulatory network using published TADs, which assign distal regulatory elements to target genes (Choi et al. 2021; Zuin et al. 2022; Wang et al. 2024). For greater precision, capture Hi-C could improve enhancer–gene mapping, though it is resource-intensive and has limitations (Roberts et al. 2024). Hi-C offers a static view of chromatin, so applying it to PSM across developmental stages would provide deeper insights. Additionally, our approach focuses on enhancer variants and may miss GWAS signals from coding mutations or other cis-regulatory regions like promoters, UTRs, silencers, insulators, or splicing sites. Nonetheless, with a few adjustments, integrating such GWAS signals with high-throughput allele-aware reporter assays targeting other types of cis-regulatory variants could significantly complement the enhancer-centric approach outlined in this study.
Methods
Preparation and sequencing of CUT&Tag libraries
Skeletal muscle (longissimus dorsi) from Landrace pigs was sourced from our previous report (Yang et al. 2019, 2021a,b). The nuclear extraction protocol for frozen tissue was adapted from established methods with minor modifications (Nègre et al. 2006; Corces et al. 2017). Isolated nuclei were used to prepare the H3K27ac-modified library with a commercial CUT&Tag Kit (Vazyme TD901). Each experimental system required ∼50,000 nuclei, 3 μg of primary antibody (Abcam ab4729), and 1 μg of secondary antibody (Abcam ab6702). CUT&Tag libraries were sequenced on the NovaSeq 6000 platform (Illumina), generating 150 bp paired-end reads.
CUT&Tag data analysis
Raw reads from CUT&Tag libraries were filtered using Trim Galore! (v0.6.7) (https://github.com/FelixKrueger/TrimGalore), then aligned to the pig (S. scrofa) genome (Ensembl release 112) using Bowtie 2 (v2.4.2) (Langmead and Salzberg 2012). High-quality aligned and deduplicated reads were processed with SAMtools (v0.1.19) (Li et al. 2009) for H3K27ac peak calling via MACS2 (v2.2.7.1) (Zhang et al. 2008). Peaks with high intragroup repeatability were identified using IDR (v2.0.3) (Li et al. 2011). Initially, peaks were called from the merged BAM file with MACS2, using a loose threshold with a cutoff P of 0.01. Next, peaks with high coincidence with IDR peaks of each stage were retained using the BEDTools intersect command (v2.30.0, -F 0.5 -u) (Quinlan and Hall 2010), resulting in final merged peaks. Reads within these peaks were counted with the multiBamSummary function of BEDTools, and depth was normalized by calculating TPM. Finally, edgeR (v3.40.0) (Robinson et al. 2010) of the R software (R Core Team 2023) was used to correct library size and obtain the final peak signal intensity matrix. For motif enrichment analysis, genomic features within 100 bp of peak summits were analyzed using the HOMER findMotifsGenome.pl program (v4.11) (Heinz et al. 2010).
Classification of the temporal patterns of SEs
SEs consist of various constituent units, each with different quantities and positions. To cluster SEs, a previously established method was employed, creating four artificial constituent units for each SE (Kai et al. 2021). These artificial units were based on the zeroth, 33.3th, 66.6th, and 100th percentiles of the H3K27ac intensity range of each stage's true constituent units. H3K27ac intensities of all artificial units across all five developmental stages were combined to generate a 20-column signal matrix for SEs. The pheatmap (v1.0.12) R package (https://CRAN.R-project.org/package=pheatmap) was used for hierarchical clustering and visualization of this matrix.
Construction of a TFs/eRNAs/targets regulatory network
Seqmonk (v1.47.2) was used to detect bidirectional transcription of eRNAs within ±500 bp of enhancer regions and quantify eRNA expression levels (see Supplemental Methods), following a previous study (Carullo et al. 2020). An initial TFs/eRNAs/targets network was constructed based on the top 30 dynamic TF motifs (Fig. 2E) in SE eRNAs using the HOMER scanMotifGenomeWide.pl tool, coexpression of TFs and genes (Spearman's correlation Rs ≥ 0.3, FDR < 0.05), and coexpression of eRNAs and genes (distance ≤1 Mb, Spearman's correlation Rs ≥ 0.3, FDR < 0.05). The corr.test function in the psych R package (v2.2.5) was used to calculate correlation values and statistical significance. The final trait-affecting network was then refined by retaining only SE eRNAs that overlapped (within ±20 kb) with GWAS hits associated with pig meat and carcass traits (Hu et al. 2019) and harbored regulatory SNPs that modulate enhancer activity.
Identification of regulatory SNPs by STARR-seq
The enhancer-modulating capacity of SNPs in the initial network was evaluated by allele-specific STARR-seq strategy referring to our previous work (Liu et al. 2017a,b; Wang et al. 2024). Briefly, genomic regions containing candidate PigVar SNPs (Zhou et al. 2017) were isolated from a pooled genomic DNA sample from eight eastern and eight western pigs using the Enzyme Plus Library Prep Kit (iGeneTech Biotech C10011) and TargetSeq One Hyb and Wash Kit v2.0 (iGeneTech Biotech C10331), with fragment lengths of 100–200 bp. Captured fragments were ligated into the hSTARR-seq_ORI vector (Addgene 99296). Recombinant vectors were transformed into Escherichia coli DH10B cells (Life Technologies) using a Gene Pulser Xcell Electroporation System (Bio-Rad Laboratories) to construct an input plasmid library, which was then electroporated into C2C12 cells using an Amaxa 4D-Nucleofector (Lonza). Cells were harvested after 24 h. Total RNA was extracted, and mRNA was enriched and reverse transcribed. cDNA was amplified by PCR to generate an output library. High-throughput sequencing on the input and output libraries was performed using the PE150 strategy on the Illumina platform. Allelic ratio fold change (output/input) was calculated as the effect size of each SNP, and two-tailed Fisher's exact tests determined the significance of allele ratio differences.
Generation of enhancer-deleted C2C12 cells by CRISPR–Cas9
pgRNAs targeting the 5′- and 3′-flanking regions (500 bp upstream and 500 bp downstream) of the targeted regulatory locus were designed using the CRISPOR web tool (Concordet and Haeussler 2018) and synthesized by Tsingke Biotech Co., Ltd. for CRISPR–Cas9-mediated deletion. The pgRNA sequences are listed in Supplemental Figure S7. The pgRNAs were assembled into the lentiviral vector pLV[2gRNA]-Puro-U6>Scramble[gRNA#1]-U6>Scramble[gRNA#2] (VectorBuilder VB220224-1316qur) by Tsingke Biotech Co., Ltd using a seamless cloning approach. Lentivirus was produced by transfecting the lentiviral vector and packaging plasmids into HEK293T cells using jetPRIME reagent (Polyplus). C2C12 myoblasts with stable Cas9 expression were infected with the lentivirus. Positive cells after puromycin selection were seeded into 96-well plates by dilution plating and grown into single-cell colonies. Cell clones with the deletion of the target region were verified by PCR and sequencing.
Investigation of the enhancer function in myogenesis
The C2C12 cells were switched to a differentiation medium consisting of 2% horse serum (Gibco) and 1% penicillin–streptomycin in DMEM, followed by a 5-day myogenic induction. Immunofluorescence was conducted using anti-MYHC antibody (DHSB MF20), anti-MYOD1 antibody (Proteintech 18943-1-AP), anti-rabbit FITC antibody (Servicebio GB22301), anti-mouse CY3 antibody (Servicebio GB21303), and DAPI for nuclei labeling. The stained cells were observed under an inverted fluorescence microscope. Total RNA was extracted from the collected cells using M5 Universal Plus RNA Mini Kit (Mei5 Biotechnology MF036) and reverse transcribed using HiScript III RT SuperMix for qPCR (Vazyme R323-01). qPCR was performed using ChamQ Universal SYBR qPCR Master Mix (Vazyme Q341-02) in a QuantStudio3 system (Applied Biosystems). qPCR primers are listed in Supplemental Table S8.
Investigation of the role of Akap1 in myogenesis
The siRNAs targeting Akap1 (5′-TGCACAGAGACCATCTCAA-3′) and NC were custom synthesized by Ribo Biological Co., Ltd. C2C12 cells were transfected with the siRNAs using the jetPRIME reagent (Polyplus) when they reached 80% confluency. After 8 h, the differentiation medium was added to induce myogenic differentiation. An additional siRNA transfection was performed after 3 days, continuing the differentiation process for another 3 days. The degree of differentiation was evaluated using immunofluorescence and qPCR analyses.
Data access
The raw CUT&Tag and STARR-seq data generated in this work have been submitted to the Genome Sequence Archive (GSA; https://ngdc.cncb.ac.cn/gsa/) under accession number CRA011158.
Competing interest statement
The authors declare no competing interests.
Acknowledgments
This work was supported by the China National Key R&D Program during the 14th Five-year Plan Period China (2021YFF1200500 to Y.L.), the National Natural Science Foundation of China (32070595 and 32372858 to Y.L.), and the Shenzhen Science and Technology Innovation Commission (JCYJ20190814163803664 to Y.L.).
Author contributions: Y.L. and S.Z. designed this study. S.Z. worked on the preparation and sequencing of CUT&Tag libraries. S.Z., C.W., Q.L., and Y.Zhao analyzed the data. S.Q., C.C., Y.B., Y.Zhang, S.Z., and L.X. performed the functional validation experiments. Y.L. supervised the study. S.Z. wrote the manuscript. Y.L. guided the writing and revised the manuscript. Z.T. and K.L. provided samples and revised the manuscript. All authors provided feedback during the drafting process and approved the final version.
Footnotes
-
[Supplemental material is available for this article.]
-
Article published online before print. Article, supplemental material, and publication date are at https://www.genome.org/cgi/doi/10.1101/gr.278344.123.
- Received July 29, 2023.
- Accepted October 15, 2024.
This article is distributed exclusively by Cold Spring Harbor Laboratory Press for the first six months after the full-issue publication date (see https://genome.cshlp.org/site/misc/terms.xhtml). After six months, it is available under a Creative Commons License (Attribution-NonCommercial 4.0 International), as described at http://creativecommons.org/licenses/by-nc/4.0/.


