
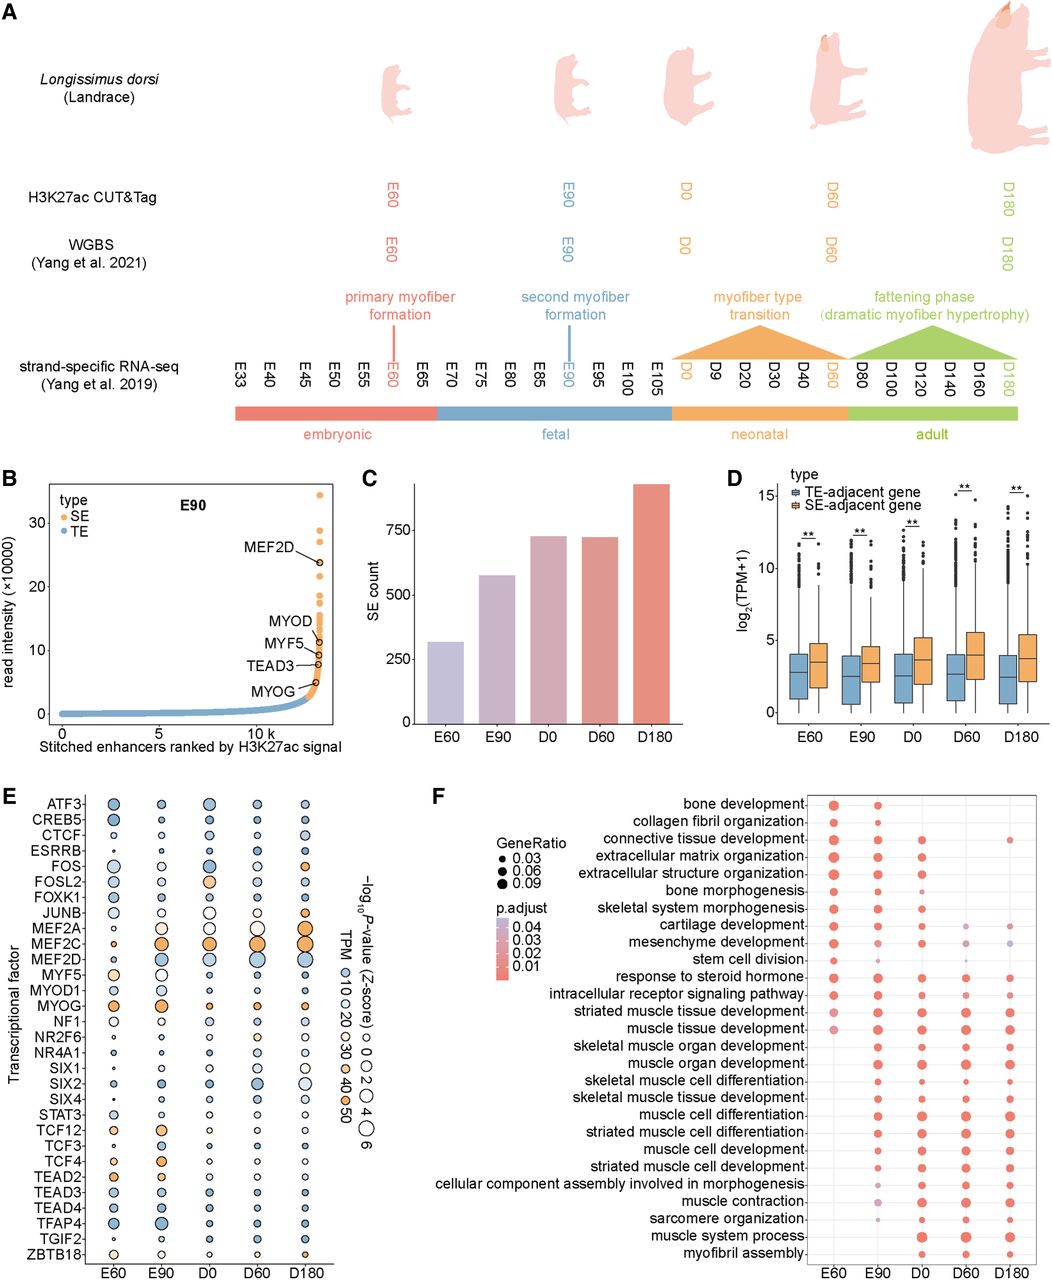
Identification and characterization of SEs. (A) Illustration of developmental PSM samples and three types of high-throughput sequencing data. CUT&Tag data were generated in this study, while whole genome bisulfite sequencing (WGBS) and strand-specific RNA-seq data were previously published by our group. (B) Classification of stitched enhancers as TEs and SEs based on H3K27ac signal (taking E90 stage as an example). Several muscle-specific genes proximal to SEs are highlighted. (C) Number of SEs identified at each developmental stage. (D) Comparison of gene expression associated with TEs and SEs at each stage. Statistical significance between groups was assessed using a two-sided Student's t-test. (*) P < 0.05, (**) P < 0.01. Unless explicitly stated, a two-sided Student's t-test is the default method for differential comparisons. (E) Top 30 TF motifs with the highest standard deviation of enrichment significance P in SEs across five developmental stages. Only TFs with significant motif enrichment (P < 1 × 10⁻¹⁰ at least at one stage) and sufficient mRNA abundance (transcripts per million [TPM] ≥ 3 at least at one stage) were retained. (F) Gene Ontology (GO) enrichment analysis of SEs at each stage.


