
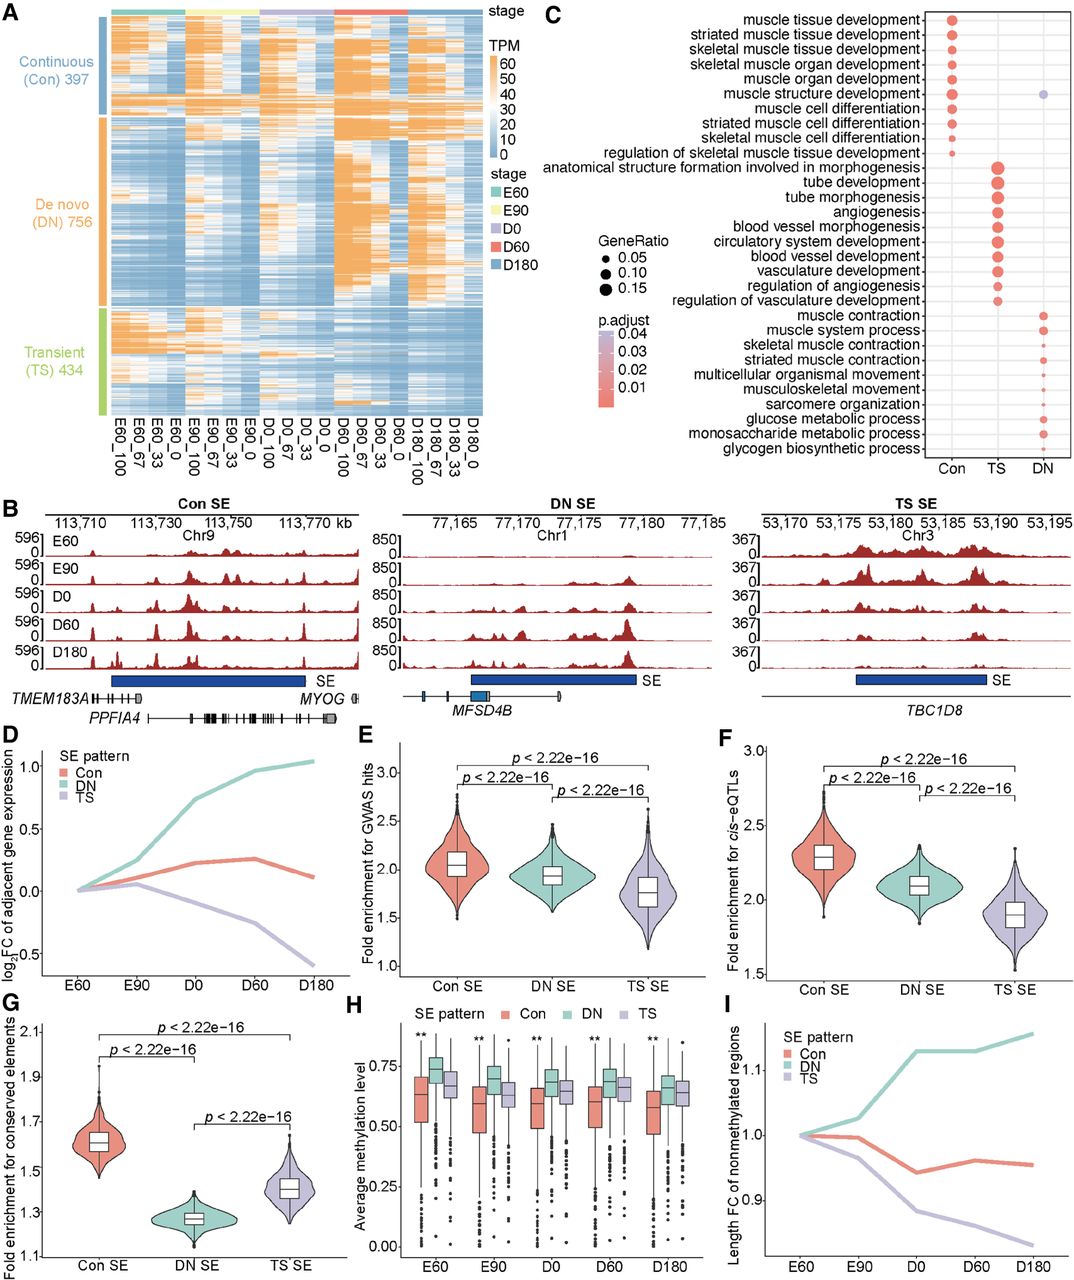
Classification and characteristics of temporal SEs. (A) Hierarchical clustering of SE signal vectors across five developmental stages, showing three distinct clusters. Each row represents an SE, characterized by its four representative enhancer units: strongest (maximum value), upper (second tertile), lower (first tertile), and weakest (minimum value), generated by a linear interpolation approach (see Methods for details). (B) Genome browser snapshots illustrating representative examples of Con, DN, and TS SEs. Tracks display H3K27ac CUT&Tag signals. (C) GO enrichment analysis for Con, DN, and TS SEs. (D) Average expression trends (relative to E60 stage) of genes associated with Con, DN, and TS SEs. Gene expression fold change (FC) values are log2 transformed. (E–G) Fold enrichment of Con, DN, and TS SEs for GWAS hits associated with pig meat and carcass traits (E), PSM cis-eQTLs (F), and mammalian conserved DNA elements (G). (H) Average DNA methylation levels of Con, DN, and TS SEs across five PSM stages. (I) Changes in the length of DNA nonmethylated regions within three types of SEs relative to the E60 stage. CpG sites are classified as methylated or nonmethylated, with contiguous nonmethylated sites merged into nonmethylated regions. See Supplemental Methods for details.


