
dbEmbryo multi-omics database for analyses of synergistic regulation in early mammalian embryo development
- Xin Huang1,2,6,
- Xiaohan Tang3,6,
- Xuemei Bai1,3,6,
- Honglei Li4,
- Huan Tao1,2,
- Junting Wang1,3,
- Yaru Li1,
- Yu Sun1,
- Yang Zheng1,
- Xiang Xu1,
- Longteng Wang5,
- Yang Ding1,
- Meisong Lu3,
- Pingkun Zhou2,
- Xiaochen Bo1,
- Hao Li1 and
- Hebing Chen1
- 1Institute of Health Service and Transfusion Medicine, Beijing 100850, China;
- 2Beijing Institute of Radiation Medicine, Beijing 100850, China;
- 3Department of Obstetrics and Gynecology, The First Affiliated Hospital of Harbin Medical University, Harbin 150001, China;
- 4Beijing Cloudna Technology Company, Limited, Beijing 100029, China;
- 5Center for Statistical Science, Center for Bioinformatics, School of Life Sciences, Peking University, Beijing 100871, China
-
↵6 These authors contributed equally to this work.
Abstract
During early mammalian embryo development, different epigenetic marks undergo reprogramming and play crucial roles in the mediation of gene expression. Currently, several databases provide multi-omics information on early embryos. However, how interconnected epigenetic markers function together to coordinate the expression of the genetic code in a spatiotemporal manner remains difficult to analyze, markedly limiting scientific and clinical research. Here, we present dbEmbryo, an integrated and interactive multi-omics database for human and mouse early embryos. dbEmbryo integrates data on gene expression, DNA methylation, histone modifications, chromatin accessibility, and higher-order chromatin structure profiles for human and mouse early embryos. It incorporates customized analysis tools, such as “multi-omics visualization,” “Gene&Peak annotation,” “ZGA gene cluster,” “cis-regulation,” “synergistic regulation,” “promoter signal enrichment,” and “3D genome.” Users can retrieve gene expression and epigenetic profile patterns to analyze synergistic changes across different early embryo developmental stages. We showed the uniqueness of dbEmbryo among extant databases containing data on early embryo development and provided an overview. Using dbEmbryo, we obtained a phase-separated model of transcriptional control during early embryo development. dbEmbryo offers web-based analytical tools and a comprehensive resource for biologists and clinicians to decipher molecular regulatory mechanisms of human and mouse early embryo development.
During early mammalian embryo development, the epigenome controls the transcriptional program dynamically. The interaction between different epigenetic marks and their combinatorial effects contributes to major events in early embryo development, such as zygotic gene activation (ZGA) (Hamatani et al. 2004; Lee et al. 2014) and lineage commitment. With breakthroughs in experimental and low-input chromatin analysis technologies adapted for the preimplantation of mammalian embryos, large amounts of sequencing data were generated, which provided us with a comprehensive perspective of the dynamics of epigenetic information mediating transcription by genome-wide studies. However, utilization of different sequencing data has been restricted by technical difficulties, including the complexity of data processing, the requirement of massive computational resources, and the large scale of raw data.
Therefore, to facilitate biologists to use sequencing data of early mammalian embryo development, 10 databases integrated with different bioinformatics tools for data analysis have been developed. The EMAGE (Richardson et al. 2014), eMouseAtlas (Armit et al. 2015), DBTMEE (Park et al. 2015), and EmExplorer (Hu et al. 2019) are primarily related to the transcriptomics. The MetaImprint (Wei et al. 2014), DevMouse (Liu et al. 2014), iHMS (Gan et al. 2017), GED (Bai et al. 2017), and MethBank 3.0 (Li et al. 2018) are mainly focused on epigenetics. DevOmics (Yan et al. 2021) integrates data on genomic, transcriptomic, and epigenomic patterns for human and mouse early embryos (Supplemental Fig. S1; Supplemental Tables S1, S2). Different epigenetic information is closely interconnected to reshape the transcriptional landscape (Atlasi and Stunnenberg 2017), whereas these databases lack analytical tools to study the global landscape of the spatiotemporal relationships between epigenetic regulation with transcription, as well as the interactions between regulatory elements and their associative effects. Thus, it may hamper the opportunity for biologists and clinicians without a bioinformatics background to study synergistic regulation through multi-omics data analysis. Therefore, it is necessary to construct a customized database containing multi-omics data across developmental stages. It integrates spatiotemporal analysis tools for synergistic regulation to study how the interplay between regulatory elements reshapes the transcriptional landscape in human and mouse early embryos.
Here, we present an integrated and interactive multi-omics database for understanding the synergistic regulation in early mammalian embryo development (dbEmbryo; https://sysomics.com/dbEmbryo/). dbEmbryo integrates sequencing data, including gene expression, DNA methylation, histone modifications, chromatin accessibility, and high-order chromatin structure of different developmental stages in human and mouse early embryos. dbEmbryo provides a user-friendly and comprehensive platform integrating customized analysis tools, which support the analysis of internal data or uploaded files. dbEmbryo helps users study the synergistic change between regulatory events and explore their combinatorial effects on the transcriptional landscape in early embryos with a spatial and temporal perspective.
Results
Database overview and features
dbEmbryo overview
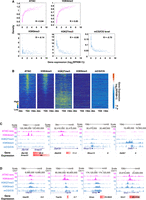
dbEmbryo is designed to store gene expression, DNA methylation, histone modification (of different types), chromatin accessibility, and three-dimensional (3D) chromatin structure information of human and mouse early embryo development in the temporal order. It provides a comprehensive platform that integrates diversified functions. The “multi-omics visualization” offers visualization of epigenetic signals on the genome. The “Gene&Peak annotation” can be used for the functional annotation of gene sets or epigenetic peaks at different embryonic developmental stages. “ZGA gene cluster” can be used to define gene clusters for ZGA genes that represent different synergistic epigenetic mechanisms. “Synergistic regulation” can be used to show the synergistic relationship between gene expression and epigenetic markers. “Promoter signal enrichment” can be used to compare the enrichment of epigenetic marks on gene promoters between species in the temporal order. In addition, the “cis-regulation” can be used to locate transcription factor binding sites (TFBSs) by assay for transposase accessible chromatin with high-throughput sequencing (ATAC-seq) data or transcription factors (TFs). The “3D genome” function can visualize the 3D genome information across early embryo development stages in different resolutions. When using these tools, alternatives are available for the species (human or mouse), signal type (“RNA-seq,” “ATAC-seq,” or “ChIP-seq”), or developmental stage (“oocyte,” “sperm,” “zygote,” “early two-cell,” “two-cell,” “late two-cell,” “four-cell,” “eight-cell,” “morula,” “ICM,” “TE,” “hESC/mESC,” “TSC,” “E6.5 Epi,” “E7.5 Epi,” or “E8.5 embryo”) (Fig. 1; Supplemental Table S2).
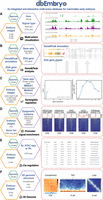
The main functions of dbEmbryo. (A) “Multi-omics visualization” searches and browses the tracks of epigenetic signals by gene names or chromosomes. (B) “Gene&Peak analysis” contains two functions. “Gene&Peak annotation” performs GO and KEGG functional annotation of specific gene sets or peaks for epigenetic signals. “ZGA gene cluster” defines different gene clusters for ZGA genes to represent different synergistic epigenetic mechanisms. (C) “Synergistic regulation” examines the correlation of different epigenetic signals with gene expression at various developmental stages. (D) “Promoter signal enrichment” compares the enrichment of different epigenetic signals at gene promoters spanning developmental stages. (E) “Cis-regulation” identifies transcription factor (TF) binding sites (TFBSs) based on ATAC-seq or TFs. (F) “3D genome” visualizes the 3D genome information (e.g., compartment, TAD, loop) across early embryo development stages in different resolutions.
dbEmbryo features and usage
Multi-omics visualization
The primary goal of dbEmbryo is to provide resources for research on early embryo development. “Multi-omics visualization” is an interactive tool for visually exploring genomic data.
Users can easily browse signals on the genome by entering gene symbols (e.g., Pou5f1) or chromosome loci (e.g., Chr 1: 11,258,601–11,260,573) on the “search” box and through “species,” “embryo stages,” and “signal type.” The graphical interface displays the level of epigenomic regulation, gene expression, aligned annotation tracks, and genome coordinates. Importantly, users could further click on the “show available track” to view all signals accessible and detailed information about these signals (Fig. 1A).
Gene&Peak analysis
It contains the following two sections: One is the clustering of ZGA genes, and the other is the exploration of the functions of genes and genome regions.
-
Gene&Peak annotation. It can help users to explore biological processes and functional pathways. A graphical interface and table displaying Gene Ontology (GO) terms and Kyoto Encyclopedia of Genes and Genomes (KEGG) pathways will be provided through “by gene sets” or “by peaks,” with the settings “species,” “embryo stages,” and “P-value.” Users can upload the gene sets and regions they are interested in through “upload files” (Fig. 1B).
-
ZGA gene cluster. It further defines different gene clusters for ZGA genes to represent different synergistic epigenetic mechanisms. The cluster of ZGA genes and their promoters (2 kb upstream of the transcription start site [TSS]) will be provided by clicking the “with” or “without” button of “ATAC-seq,” “H3K4me3,” and “H3K27me3” during ZGA stages. For example, the gene cluster corresponding to ZGA genes with chromatin accessibility, H3K4me3, and without H3K27me3 at promoters will be provided by clicking the “with” of “ATAC-seq” and “H3K4me3” and “without” of “H3K27me3.” Users can upload the ZGA gene sets they defined through “upload files” (Fig. 1B).
Synergistic regulation
Early embryo development is a dynamic and precisely regulated process in which gene expression is strictly regulated by epigenetic modification. To help researchers explore the synergistic relationship between gene expression and epigenetic markers, dbEmbryo provides the “synergistic regulation” function.
Users can use “protein-coding genes” in “gene sets” and choose the gene expression or epigenetic signal of “marker1” and “marker2.” The graphical interface will display the correlation of markers. Notably, users can select one or more stages in “embryo stages”; dbEmbryo will provide two types of graphs. dbEmbryo supports users in uploading the gene sets through “upload files” to explore synergistic regulation (Fig. 1C).
Promoter signal enrichment
It can compare the enrichment of different epigenetic signals at gene promoters spanning species and stages. Global dynamic changes in epigenetic modification signals in promoters across stages can be explored.
Users can choose genes with “expression level top 10%,” “expression level top 20%,” or “expression level top 30%” in the “gene list.” Next, dbEmbryo provides a graphical interface to display the enrichment of epigenetic signals at gene promoters after setting “epigenetic markers,” “species,” and “embryo stages.” Notably, users can select more than one stage in “embryo stages” to better compare different stages of a single epigenetic signal. Users can also select more than one “epigenetic marker” to compare several different epigenetic signals. dbEmbryo supports users in uploading the gene sets they are interested in through “upload files” (Fig. 1D).
Cis-regulation
TFs are key cellular components regulating gene expression. They identify specific DNA sequences, known as TFBSs, and then bind to specific areas of the genome, where they can recruit transcription cofactors and chromatin regulators to fine-tune spatiotemporal gene regulation (Lai et al. 2019). Thus, TFBS identification is essential for understanding gene expression. However, TFBS identification requires specific analytical tools, such as finding individual motif occurrence (FIMO) analysis (Grant et al. 2011). A customized web server for TFBS identification in early embryos is currently unavailable, which is inconvenient for researchers without bioinformatics backgrounds. Thus, dbEmbryo provides a “cis-regulation” function for users to identify TFBSs based on ATAC-seq data or TFs at different stages.
Users can choose “TF” for TFs or “ATAC-seq” for chromatin accessibility at early embryo stages provided by dbEmbryo to identify TFBSs. Then, dbEmbryo will provide a table interface displaying the TFBSs containing chromosome loci, motif ID, motif sequences, and P-values. Users could upload the genomic regions of interest and get the potential TF motif outputs through “upload files.” All the analytical results can be downloaded (Fig. 1E).
3D genome
During early mammalian development, 3D chromatin structure undergoes reprogramming (Du et al. 2017). Visualizing chromatin interactions around the queried locus helps users visualize the reprogramming process of higher-order chromatin structures during early embryo development. The “3D genome” function provides an interface to view 3D genome information at early embryo development stages.
Users can query certain developmental stages and visualize the genome, chromosome, compartment, topologically associating domain (TAD), and loop at different resolutions (5 kb, 10 kb, 20 kb, 50 kb, 100 kb, 200 kb, 500 kb, 1 Mb, 2 Mb). In addition, users can input the genomic regions of interest to visualize and detect long-range contacts. The results can be downloaded in high resolution (Fig. 1F).
Data download
All outputs produced can be downloaded from the interface. Data (RNA sequencing [RNA-seq], ATAC-seq, chromatin immunoprecipitation sequencing [ChIP-seq] for H3 lysine 4 trimethylation (H3K4me3), ChIP-seq for histone H3 lysine 9 trimethylated (H3K9me3), ChIP-seq for histone H3 at lysine 27 trimethylation (H3K27me3), ChIP-seq for histone H3 lysine 27 acetylation (H3K27ac), and high-throughput chromosome conformation capture [Hi-C]) of human and mouse early embryos can be downloaded on the “data download” page.
Comparison of dbEmbryo with other databases
Currently, 10 databases provide gene expression and epigenetics information about early mammalian embryo development with different layers of data (Supplemental Fig. S1; Supplemental Tables S1, S2). To illustrate the uniqueness of dbEmbryo and help researchers select the suitable database for analysis, we compared dbEmbryo with these databases and provided an overview of them from the aspect of the data types, species, developmental stages, and characteristic tools (Supplemental Fig. S1; Supplemental Table S2).
The databases can be divided into three categories by data resources: transcriptomic information, epigenetic information, and multi-omics data with the most comprehensive coverage of early embryos.
The EMAGE (Richardson et al. 2014), eMouseAtlas (Armit et al. 2015), DBTMEE (Park et al. 2015), and EmExplorer (Hu et al. 2019) mainly provide transcriptome data (Supplemental Table S2). In addition to text-based descriptions of gene expression, EMAGE and eMouseAtlas also provide spatial maps of gene expression patterns of mouse embryos. DBTMEE provided the gene expression profile of early mouse embryos established by their whole-transcriptome analysis. In contrast to the above database, which only provides mouse transcriptomic data, EmExplorer provides transcriptomic data of five species.
MetaImprint (Wei et al. 2014), iHMS (Gan et al. 2017), DevMouse (Liu et al. 2014), GED (Bai et al. 2017), and MethBank 3.0 (Li et al. 2018) mainly contain epigenetic information (Supplemental Table S2). MetaImprint contains imprinted gene information from eight mammalian species, which is unique information. DevMouse and MethBank 3.0 are both single-base-resolution methylomes based databases. DevMouse provides methylation information across 12 mouse developmental stages, and MethBank 3.0 provides differentially methylated promoters (DMPs) and methylated CpG islands (mCpGIs) between stages identified from SRMs. iHMS integrates whole-genome histone modification maps covering a wide spectrum of the early human embryo. GED provides information on DNA methylation, histone modification, and RNA regulation during 16 gametogenesis stages of seven mammal species.
DevOmics (Yan et al. 2021) and dbEmbryo provide multi-omics data containing gene expression, epigenetic information, and 3D chromatin architecture profiles of human and mouse early embryos (Supplemental Table S2). Compared with DevOmics, dbEmbryo covers more developmental stages.
Next, we compared dbEmbryo with other databases through characteristic tools. The unique aspect of EMAGE is that it contains standardized spatial representations of the sites of gene expression for each gene, denoted against a set of virtual reference embryo models, and users can view arbitrary sections of mapped 3D image data through the IIP3D viewer. eMouseAtlas provides two analytical tools: the “find similar spatial query” tool captures gene expression patterns that are coexpressed in mouse embryos; the “spatial clustering” tool detects syn-expression groups with the clustering of genes of unknown function alongside well-characterized genes. DBTMEE installed a “regulation browser” for visualizing and identifying potential key TFs involved in transcriptional initiation in fertilized oocytes. EmExplorer provides a tool that enables the comparison of species at the single-gene, multi-genes, and pathway levels for the same stage. MetaImprint provides an “epigenetic changes analysis tool” to identify epigenetic differences in the average epigenetic signal levels of imprinted genes across tissues and cell types. DevMouse facilitates the quantitative analysis of methylation dynamics, such as entropy-based quantification of methylation variation, identification of differentially methylated genes/regions, and hierarchical clustering analysis of methylation profiles. GED provides a “pathway prediction” tool to identify the active regulatory pathways of gametogenesis. MethBank 3.0 provides the “identification of differentially methylated promoters (IDMP)” tool to identify DMPs. DevOmics provides an “allelic explorer” to show paternal- and maternal-specific gene expression and epigenomic modifications.
Compared with these databases, dbEmbryo ingrates five specific analytical tools for synergistic analysis of early embryo development: “ZGA gene cluster,” “synergistic regulation,” “promoter signal enrichment analyses,” “cis-regulation,” and “3D genome.” “Synergistic regulation” reveals the global dynamics of correlations between different layers of data at a multigene level, which is more comprehensive than the correlation analysis of DevOmics. “Cis-regulation” analysis is an online tool for identifying cis-regulation factors (e.g., TFBSs), which is not available in other databases focusing on early embryos. “3D genome” supports an analysis of 3D chromatin structures and helps researchers investigate synergistic regulatory networks from a spatiotemporal perspective, which is unique. In addition, dbEmbryo is more interactive than other databases, for all functions support data uploading for analysis.
Although these databases do not provide synergistic analysis tools, their data resources and functions are valuable. Together, if researchers are interested in the dynamics in the genome from fertilization to ZGA, DBTMEE will provide a valuable data resource. EmExplorer is suitable for researchers to perform cross-species studies of transcription. If researchers want to obtain the potential active regulatory pathways involved in gametogenesis and relate them to experiments, they can choose GED. Methbank 3.0 is a good choice for digging deeper into methylation data. DevOmics is suitable for multi-omics data analyses.
Application and summary: a phase-separated model of transcriptional control during early embryo development
To help users understand how to use dbEmbryo to explore the different layers of epigenetic marks that shape transcriptional programs in early embryos and guide them to select suitable functions, we present a summary of the dbEmbryo application. We undertook a time-resolved study of epigenetic marks, which revealed the synergistic actions of multiple epigenetic molecules in the early transcription program in a spatiotemporal manner. We applied the “multi-omics visualization,” “synergistic regulation,” “promoter signal enrichment,” and “3D genome” functions to perform a time-resolved integrative analysis of transcriptional control. The case study of functions in dbEmbryo is displayed in the Supplemental Case Study.
The two-cell stage: accessible chromatin initiates transcriptional activity
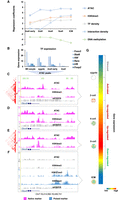
Following fertilization, “pioneer” TFs recognize and bind to repressed chromatin, which is opened and recruits more TFs and epigenetic modifiers, thereby driving zygotic gene expression (Lee et al. 2014; Oldfield et al. 2014; Sherwood et al. 2014; Zaret and Mango 2016). Consequently, the accessibility of chromatin reflects the total amount of TF binding and the regulatory potential of the gene locus (Klemm et al. 2019). To show the usage of “synergistic regulation,” we used genes that were only activated in preimplantation embryos (hereafter referred to as “ZGA genes”) as input for “gene sets” to measure the effects of chromatin accessibility on gene expression. The result indicated that gene expression correlated significantly with the density of accessible chromatin in promoters from the two-cell stage when the major ZGA occurs. The strongest correlation was observed in the eight-cell stage; thereafter, in the inner cell mass (ICM) and mouse embryonic stem cell (mESC) stages, it weakened (Fig. 2A). We found that globally accessible chromatin was widely established in the two-cell stage and that >20% of the ATAC-seq peaks overlapped with the promoter (Supplemental Fig. S2A). Moreover, much of the accessible chromatin maintained from the previous stage was located near TSSs (Supplemental Fig. S2B), allowing the transcriptional machinery to access gene promoters. Many key genes were accessible at the two-cell stage or earlier. For example, Arntl is associated with the rhythmic opening of chromatin at promoters and regulates DNA accessibility for other TFs (Menet et al. 2014); Nfya forms a histone-like structure binding to DNA and promotes chromatin accessibility and ZGA (Nardini et al. 2013; Oldfield et al. 2014; Lu et al. 2016). To quickly browse signals of chromatin accessibility on these key genes, we searched “Arntl” and “Nfya” in the “multi-omics visualization” function. We found Arntl was accessible during the entire preimplantation stage. Nfya was accessible at the two-cell embryo stage (Fig. 2B).
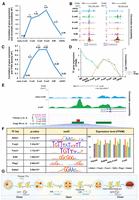
Accessible chromatin initiates transcriptional activity in the two-cell stage. (A) Correlations between gene expression (NCBI Gene Expression Omnibus [GEO; https://www.ncbi.nlm.nih.gov/geo/] GSE66582) and chromatin accessibility (GEO; GSE66581) in promoters (2 kb upstream of TSSs) of ZGA-only genes. Correlation coefficients (R2 values) were calculated by Pearson's linear correlation: (*) 1 × 10⁻⁵< P < 1× 10⁻¹⁰, (**) 1 × 10⁻¹⁰< P < 1 × 10⁻²⁰, (***) P < 1× 10⁻²⁰. (B) UCSC plots show chromatin accessibility (GSE66581) in promoters of the genes Arntl and Nfya. (C) Correlations between gene expression (GSE66582) and TFBS density in promoter regions (2 kb upstream of TSSs) of ZGA-only genes. Correlation coefficients (R2 values) were calculated by Pearson's linear correlation. (*) 1 × 10⁻⁵< P < 1 × 10⁻¹⁰, (**) 1 × 10⁻¹⁰< P < 1 × 10⁻²⁰, (***) P < 1 × 10⁻²⁰. (D) The green line shows the average expression level for 395 TFs, determined as described in the Methods; the orange line shows correlation coefficients between gene expression (GSE66582) and TFBS density. (E) UCSC plot shows chromatin accessibility (GSE66581) of Rpl38 in the early two-cell and two-cell stages. DHSs (GSE76642) and ATAC peaks (GSE66581) by other studies are also shown. (F) TFBSs scanned in corresponding ATAC peak. P-value is calculated by FIMO. Motif figures are collected from the HOCOMOCO (v10) database. The bar plot shows expression levels of TFs. (G) Transcriptional regulatory model in early embryo development.
Most TFs recruit RNA polymerase II, which binds to TFBSs and then regulates gene expression. In general, we found a weak correlation between TFBS density and the expression of ZGA genes in the early two-cell stage. The relationship between TFBSs and gene expression was strongest in the four-cell and eight-cell stages and weakened sharply in the ICM and mESCs (Fig. 2C). We then examined the expression levels of TF genes. Changes in these expression levels were consistent with the observed correlations (Fig. 2D) because adequate amounts of TF RNA transcripts were required for TF binding to DNA sequences.
To understand how accessible chromatin affects the activation of transcriptional programmers, we characterized a class of active genes regulated by TFs inherited from oocytes. We found that Rpl38, a gene related to RNA binding and a structural constituent of the ribosome, was silenced until the two-cell stage (Supplemental Fig. S2C). We search “Rpl38” in the “multi-omics visualization” function to compare chromatin accessibility between the two-cell and previous stages by integrating DNase I (Lu et al. 2016) and ATAC-seq data (Wu et al. 2016). As expected, the promoter of Rpl38 was accessible by the two-cell stage (Fig. 2E). Several highly expressed TFs (RPKM ≥ 10), such as Nr6a1, Foxj3, and Foxo1, can bind to accessible chromatin and thus may contribute to Rpl38 activation (Fig. 2F). Genome-wide analysis showed that two-thirds of the peaks at two-cell were gained compared with at the one-cell stage and that >60% of them were accessible for highly expressed TFs (Supplemental Fig. S2D). Genes with new peaks targeted by TFs were expressed at higher levels than other genes (Supplemental Fig. S2E). Together, these findings show that TFs inherited from oocytes in two-cell embryos bind to cis-regulatory elements embedded in accessible chromatin and may contribute to the activation of transcriptional programmers (Fig. 2G).
The four-cell stage: H3K4me3 facilitates gene up-regulation
The dynamic process of chromatin accessibility is always accompanied by the redistribution of histone marks (Soufi et al. 2012; Respuela et al. 2016; Zaret and Mango 2016; Krishnakumar et al. 2018). We next investigated the details of H3K4me3 dynamics and their contribution to transcriptional activity. We examined the correlation between H3K4me3 density in promoters of ZGA genes and gene expression level using the “synergistic regulation” function. We found gene expression correlated weakly with H3K4me3 density in early two-cell and two-cell embryos; the strength of this correlation increased sharply from the four-cell stage (Fig. 3A).
H3K4me3 facilitates gene up-regulation in the four-cell stage. (A) Correlations between gene expression (GSE66582) and H3K4me3 (GSE71434) signal levels in promoters (2 kb upstream of TSSs) of ZGA-only genes. Correlation coefficients (R2 values) were calculated by Pearson's linear correlation. (*) 1 × 10⁻⁵< P < 1 × 10⁻¹⁰. (B) UCSC plots show chromatin accessibility (GSE66581) and H3K4me3 (GSE71434) signal surrounding gene Alppl2. Bar plot shows the expression level of gene Alppl2. (C) UCSC plots show chromatin accessibility (GSE66581) and H3K4me3 (GSE71434) signal surrounding gene Cyp26a1. Bar plot shows the expression level of gene Cyp26a1. (D) Pie charts show the percentage of up-regulated genes with and without H3K4me3 (GSE71434) peaks in the promoter (left) and chromatin accessibility of up-regulated genes that are targeted by H3K4me3 (GSE71434) peaks in the promoter (right).
To reveal the relationship between H3K4me3 dynamics and chromatin accessibility and the combinatory effects of these factors on transcriptional activity, we analyzed the gain or loss of H3K4me3 peaks in four-cell embryos. More than 70% of H3K4me3 peaks in the four-cell embryos were new (i.e., absent in two-cell embryos), and ∼75% of these gained H3K4me3 peaks were accessible in the four-cell or earlier stages (Supplemental Fig. S3A). For example, we searched “Alppl2” in the “multi-omics visualization” function and found that the promoter of Alppl2 was accessible in two-cell embryos and that the H3K4me3 level increased in the four-cell and eight-cell stages; thus, Alppl2 was active in the two-cell stage, and its expression level increased nearly sixfold in the four-cell and eight-cell stages. Alppl2 was silenced in the ICM, which we attributed to the closing of chromatin and the low H3K4me3 signal (Fig. 3B). Next, we focused on the H3K4me3 peaks that disappeared from the four-cell stage. More than 75% of the lost H3K4me3 peaks were inaccessible before the four-cell stage (Supplemental Fig. S3B). For example, we searched “Cyp26a1” in the “multi-omics visualization” function and found that the promoter of Cyp26a1 was inaccessible during early embryo development. The H3K4me3 peak was present in the early two-cell and two-cell stages but disappeared thereafter. Thus, Cyp26a1 was silenced during the entire implantation period (Fig. 3C). In four-cell embryos, H3K4me3 targeted the promoters of 87% of all up-regulated genes, and >75% of these genes were accessible (Fig. 3D).
To summarize, a strong correlation between the H3K4me3 level and gene expression was observed from the four-cell stage. Gain and loss of the H3K4me3 signal were associated directly with chromatin accessibility and may facilitate gene up-regulation (Fig. 2G).
The eight-cell stage: 3D chromatin structures enhance transcriptional activity
The multiparadigm that 3D chromatin structure combines with epigenetics is an emerging model for understanding gene regulation mechanisms. Many studies have revealed that histone marks, enhancer RNAs (eRNAs), and chromatin accessibility are involved in chromatin organization (Joshi et al. 2015; Ghirlando and Felsenfeld 2016; Ji et al. 2016; Wang et al. 2016). Thus, we used the “3D genome” to examine the establishment of the higher-order chromatin structure and lower-order chromatin significant interactions and their effects on gene expression. Dynamic analysis showed that 37%–53% of the TAD boundaries were new in each stage from the late two-cell to the eight-cell stage. In contrast, <30% of TAD boundaries were new after the eight-cell stage (Fig. 4A). Gene TSSs were significantly enriched in TAD boundaries (P < 0.01, permutation test) (Supplemental Fig. S4A). Expression levels of genes located in TAD boundaries were significantly higher than those of genes outside TAD boundaries from the late two-cell stage, and their expression levels peaked in the eight-cell stage (Fig. 4B). These results indicated that the chromatin structure undergoes changes before the eight-cell stage and is associated with transcription activity since that time.
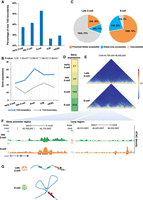
3D chromatin structures enhance transcriptional activity in the eight-cell stage. (A) The bar plot shows the percentage of TAD boundaries (GSE82185) that are new in the current compared with the previous stages. (B) The average expression level of genes is located in the TAD boundary and outside the TAD boundary (GSE82185). P-values were calculated by t-test. (C) Pie charts show genes with accessible chromatin (GSE66581) in the promoter or the chromatin interaction loop region (GSE82185). (D) The expression level of Sidt2. (E) Hi-C heatmaps of Sidt2 and associated loop region at 5-kb resolution for late two- and eight-cell embryos. (F) UCSC plots show chromatin accessibility (GSE66581) of Sidt2 and the associated significant interaction region. (G) The model shows that accessible chromatin in the eight-cell stage is condensed by widespread interaction loops, thus enhancing transcriptional activity.
We next explored the effect of significant chromatin interactions on gene regulation. Significant Hi-C interactions increased after fertilization (Supplemental Fig. S4B), indicating that the complex chromatin organization was compressed into densely connected significant interactions. As open chromatin regions direct the binding of key TFs (e.g., CCCTC-binding factor) (Dowen et al. 2014; Ji et al. 2016) and subsequently mediate chromatin looping, we compared the accessibility of chromatin significant interactions in the late two-cell and eight-cell stages (four-cell Hi-C data were not available). More than 50% of significant interactions in eight-cell embryos, but only 20% of domains in late two-cell embryos, contained accessible chromatin (Supplemental Fig. S4C). Whereas 70% of up-regulated genes were inaccessible in distal regions in the late two-cell stage, indicating weak regulation by chromatin significant interactions, 95% of up-regulated genes were accessible at promoters or distal chromatin significant interactions and thus could be targeted by regulatory factors such as TFs, in the eight-cell stage (Fig. 4C).
The accessible chromatin in spatially proximate promoter and distal regions generally contributed to the increase in gene expression. Thus, we combined “multi-omics visualization” and “3D genome” to examine chromatin accessibility and Hi-C interactions at genes that were up-regulated in the eight-cell stage. For example, Sidt2, which mediates direct uptake of DNA (Aizawa et al. 2017), was active in the late two-cell stage and up-regulated in the eight-cell stage (Fig. 4D). After querying the genomic region and embryo stage for “3D genome,” we found no significant interactions surrounding Sidt2 were detected in the late two-cell stage. However, a significant interaction (P = 2.9 × 10−38) was observed in the eight-cell stage (Fig. 4E). The promoter of Sidt2 was accessible in both stages, but the interaction region was open only in the eight-cell stage (Fig. 4F).
To summarize, the “3D genome” shows that accessible chromatin in the eight-cell stage is condensed by widespread significant interactions compared with the late two-cell stage, thus enhancing transcriptional activity (Fig. 4G).
The ICM: multifaceted regulation of epigenetic marks
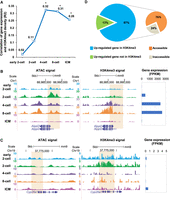
Reprogramming in epigenetic marks occurs at the ICM and trophectoderm (TE), which begin to segregate when the first lineage specification starts in the morula stage (Xiang et al. 2020). H3K27me3 begins to emerge at canonical Polycomb target promoters (Zheng et al. 2016), and the signal is significantly more potent than at the onset of ZGA (Supplemental Fig. S5A). DNA demethylation is completed and then sharply increased in post-implantation (Supplemental Fig. S5B; Smith et al. 2012; Zhang et al. 2018). CG methylation was much weaker in the ICM than the two-cell stage (Supplemental Fig. S5C). Large-scale reestablishment of H3K9me3 occurs immediately after fertilization, and parental H3K9me3 remains in disequilibrium until the ICM stage (Wang et al. 2018). Although the imbalance in parental H3K4me3 signals persists until the ICM (Zhang et al. 2016a), the global H3K4me3 signal in the ICM was comparable to that in the two-cell stage (Supplemental Fig. S5D). To explore the synergistic relationship between epigenetic marks and transcription of ZGA genes, we used the “synergistic regulation” function to explore the correlation between gene expression level and densities of epigenetic modifications at the gene promoter. We found that gene expression correlated positively with chromatin accessibility and the H3K4me3 level in the gene promoter and negatively with H3K27me3 (Fig. 5A). The H3K9me3 level correlated weakly with gene expression (Fig. 5A). For DNA methylation, a strong correlation between the mCG/CG level and gene expression can be observed. However, the mCG/CG level decreased sharply to 0.05 when the expression level (FPKM) was >3 (Fig. 5A).
Multifaceted regulation of epigenetic marks at ICM stage. (A) Scatter plots show the correlations between gene expression (GSE66582) and epigenetic signals (ATAC-seq: GSE66581; H3K4me3: GSE71434; H3K9me3: GSE97778; H3K27me3: GSE76687; mCG/CG: GSE56697) in promoters (2 kb upstream of TSSs). Correlation coefficients were calculated by Pearson's linear correlation. (B) Heatmaps show the enrichment of epigenetic marks (ATAC-seq: GSE66581; H3K4me3: GSE71434; H3K9me3: GSE97778; H3K27me3: GSE76687; mCG/CG: GSE56697; normalized RPKM) in the ICM stage; a bar chart shows the expression level of corresponding genes. (C,D) UCSC plots show epigenetic signals (ATAC-seq: GSE66581; H3K4me3: GSE71434; H3K9me3: GSE97778; H3K27me3: GSE76687; mCG/CG: GSE56697) surrounding Zfp106, Snap23, Zfp639, Rhox13, Defb7, Usp29, Top3a, Gnas, and Vnn1. The bar plot shows gene expression level.
To examine the epigenetic signals surrounding the TSSs of ZGA genes, we used the “promoter signal enrichment” function to perform promoter signal enrichment analysis. First, we uploaded the ZGA genes as input in the “gene list.” Then, we set “ATAC,” “H3K4me3,” “H3K27me3,” “H3K9me3,” and “mCG” in “epigenetic marker,” and we choose “ICM” in “embryo stages.” From the graphs, we found that the ATAC-seq and H3K4me3 signals were enriched in genes with high expression levels, whereas broad H3K27me3 domains were enriched in silenced genes. However, the H3K9me3 signal and CG dinucleotide (mCG/CG) level were indiscriminate (Fig. 5B). To explore the multifaceted regulation of epigenetic markers in the ICM stage, we viewed genes with strong epigenetic signals through the “multi-omics visualization” function. We found that genes targeted by strong and active markers but weak poised markers were highly expressed, whereas the expression levels of genes targeted by strong poised markers but weak active markers were deficient (Fig. 5C). The transcription activity was indeterminable when genes were targeted by strong active and poised markers (Fig. 5D).
Therefore, using the “promoter signal enrichment” function in the ICM, we found that major modifications contributed to the regulation of gene expression in the ICM. Accessible chromatin and H3K4me3 served as activators, whereas H3K9me3, H3K27me3, and DNA methylation were substantial barriers to the transcriptional program.
Different layers of epigenetic marks shape transcriptional programs
To understand how different epigenetic marks control the expression of the genetic code in a stepwise manner, we integrated different layers of epigenetic marks and quantitatively described their effects on transcriptional activity for ZGA genes. We make a linear regression analysis to determine the specific forms of correlation between epigenetic markers and gene expression. In the early two-cell stage, we observed weak levels of epigenetic regulation (Fig. 6A). Both the genome-wide transcriptional activity (Supplemental Fig. S6A) and chromatin accessibility were generally weak (Supplemental Fig. S2B). However, a large amount of residual TF messenger RNA (mRNA) remained from the oocyte stage (Fig. 2D), which may have led to chromatin accessibility and the recruitment of chromatin-remodeling complexes. This process would facilitate the binding of “reader,” “eraser,” and “writer” complexes, enabling different epigenetic marks to direct or facilitate gene expression. In the two-cell stage, with the completion of paternal chromatin accessibility reprogramming (Lu et al. 2016), genome-wide accessible chromatin plays a significant role in the activation of transcriptional programs and may lead to ZGA. In the four-cell stage, the effect of active H3K4me3 increased, and a portion of genes targeted by H3K4me3 was activated or up-regulated. In the eight-cell stage, as spatial segregation of the chromatin structure could be observed and the allelic differences in chromatin compartments were apparent (Du et al. 2017), the higher-order chromatin architecture separated genes with high expression levels, and chromatin interactions provided spatial regulation of gene expression. During the first lineage specification, cells are segregated into the ICM and TE (Zernicka-Goetz et al. 2009). The transcriptional regulation is very complex, with multiple epigenetic marks functioning together to up- or down-regulate gene expression. Furthermore, we performed a multiple regression analysis to combine major epigenetic factors in regulating gene expression. As expected, after ZGA at the two-cell stage, the density of epigenetic marks is significantly correlated with transcription activity (Supplemental Fig. S6B).
Different layers of epigenetic marks shape transcriptional programs. (A) The linear regression quantitatively describes the effects of different layers of epigenetic marks (ATAC-seq: GSE66581; H3K4me3: GSE71434; HiC: GSE82185; DNA methylation: GSE56697) on transcriptional activity in preimplantation embryos. The analysis was conducted on ZGA-only genes. (B–G) Gene Obox6 illustrates the relationship between different layers of epigenetic information (ATAC-seq: GSE66581; H3K4me3: GSE71434; H3K9me3: GSE97778; H3K27me3: GSE76687; mCG/CG: GSE56697) and transcriptional activity (GSE66582). (B) TFBSs scanned in accessible chromatin of Obox6. Expression levels of these TFs were high (FPKM ≥ 10). (C–F) UCSC plots show the epigenetic signal surrounding gene Obox6 for two-, four-, and eight-cell embryos and ICM. (G) Colormap shows the expression level of Obox6 during preimplantation.
We used the “multi-omics visualization” function to explore Obox6 as an example to illustrate relationships between different layers of epigenetic information and transcriptional activity (Fig. 6B–G). Soon after fertilization, Obox6 was silenced; however, residual TF mRNAs from the oocyte and zygote remained, and corresponding TFBSs could be scanned in the Obox6 promoter (Fig. 6B), enabling chromatin accessibility. As expected, the Obox6 promoter was accessible in the two-cell stage, leading to the active transcription of Obox6 (Fig. 6G). The H3K4me3 signal was weak, and the mCG/CG level was high (Fig. 6C). In the four-cell stage, chromatin accessibility of the gene promoter was sustained, and the H3K4me3 signal increased significantly; thus, Obox6 was up-regulated (Fig. 6D,G). In the eight-cell embryo, the expression of Obox6 peaked, and a TAD boundary where Obox6 was located was constructed (Fig. 6E). Finally, in the ICM, although the Obox6 promoter was targeted with strong poised modifications, including H3K27me3 and H3K9me3, the chromatin accessibility and H3K4me3 signal decreased to low levels. Thus, Obox6 showed low expression levels (Fig. 6F,G).
In summary, these applications for “multi-omics visualization,” “synergistic regulation,” “promoter signal enrichment,” “cis-regulation,” and “3D genome” showed that chromatin accessibility is associated strongly with gene expression in earlier embryonic development (two- to eight-cell stages), whereas this association weakens markedly in the ICM and mESC stages. One possible explanation for this result is that early gene expression depends merely on the chromatin state at that time. Further regulation by H3K4me3 in the four-cell stage and spatial regulation by the 3D chromatin structure depend on chromatin accessibility. However, with the addition of DNA methylation and poised histone modifications, such as H3K27me3, chromatin accessibility becomes progressively restricted and transcriptional activity becomes multiregulated.
Discussion
Herein, we presented dbEmbryo, an integrated and interactive multi-omics database of human and mouse early embryos. dbEmbryo provides a user-friendly website interface that integrates customized analytical tools enabling the integrative analysis of different types of sequencing data from a spatiotemporal perspective. It helps researchers investigate precise synergistic regulatory networks within multi-omics data and the underlying molecular mechanisms involving chemical modifications of chromatin, changes in chromatin accessibility, and chromatin interaction response in human and mouse early embryos.
We compared dbEmbryo with 10 existing databases containing data on early embryo development and provided an overview. We summarized the purpose, data types, and features to help users select the databases meeting their needs. These databases do not offer analysis of the global dynamics of synergistic regulations between epigenetic marks and gene expression, whereas the integrative analysis of multi-omics data on early embryo development is urgently needed. Thus, dbEmbryo is necessary for biologists and clinicians without a bioinformatics background.
Previous studies (Atlasi and Stunnenberg 2017) have described the interplay between different epigenetic marks, but whether these factors coregulate transcriptional activity synchronously or asynchronously remains unclear. Our application based on dbEmbryo indicates that the regulation of chromatin accessibility precedes H3K4me3. Chromatin accessibility increases sharply in the two-cell stage and decreases gradually after that, whereas the H3K4me3 level increases significantly in the four-cell stage. H3K4me3 peaks are depleted in zygotes and can be observed after major ZGA (Zhang et al. 2016a), indicating the completion of H3K4me3 reprogramming in late two-cell embryos, which is later than the previously reported rapid reprogramming of chromatin accessibility at the PN3 stage (Lu et al. 2016).
Together, our analyses through dbEmbryo extend the knowledge of the dynamic landscapes of how epigenetic mechanisms regulate transcriptional activity in a stepwise manner by revealing their complex spatiotemporal relationships, which helps to elucidate the fundamental mechanisms of the transcriptional program in early embryo development. Of course, the current version of dbEmbryo needs further improvements. For example, the data of new technologies, such as single-cell and spatial transcriptomics, need to be researched and followed up. We will continue to enhance the dbEmbryo database through advances in data sequencing, ultimately enabling comprehensive multi-omics studies related to early mammalian embryos in a manner that is convenient for biologists and clinicians.
Methods
The general processes of data collection, processing, and major functions are illustrated in Supplemental Figure S7.
Data sources
We manually collected publicly available early human and mouse embryo data from the European Nucleotide Archive (ENA; https://www.ebi.ac.uk/ena/browser/search) and the NCBI Gene Expression Omnibus (GEO; https://www.ncbi.nlm.nih.gov/geo/) (Barrett et al. 2013). We selected 11 studies generated by RNA-seq for gene expression analysis (Hamatani et al. 2004; Wu et al. 2016; Zhang et al. 2016b); ChIP-seq for H3K4me3 (Liu et al. 2016; Zhang et al. 2016b; Xia et al. 2019), H3K9me3 (Wang et al. 2018), H3K27me3 (Liu et al. 2016; Xia et al. 2019), and H3K27ac (Dahl et al. 2016; Zheng et al. 2016; Xia et al. 2019); ATAC-seq for chromatin accessibility analysis and TFBSs identification (Wu et al. 2016, 2018; Xia et al. 2019); MethylC-Seq for DNA methylation analysis (Wang et al. 2014); and Hi-C for 3D chromatin structure analysis (Du et al. 2017). dbEmbryo documents multi-omics data of human and mouse embryos across 15 developmental stages (human and mouse embryos: oocyte, sperm, zygote, early two-cell, two-cell, late two-cell, four-cell, eight-cell, morula, blastocyst [ICM and TE], human/mouse embryonic stem cells [hESCs/mESCs], trophoblast stem cells [TSCs], E6.5 Epi, E7.5 Epi, and E8.5 embryo). All data sets deposited in dbEmbryo are summarized in Supplemental Table S3. Mouse gene annotations (mm9) were obtained from Mouse Genome Informatics (MGI) (Blake et al. 2017). Human gene annotations (hg19) were obtained from GENECODE (https://www.gencodegenes.org/) (Frankish et al. 2021).
Data processing
We constructed pipelines to process the collected data. The preprocessed data were stored in a MySQL-based database and uploaded with cloud computing for fast and efficient query and integrated downstream analysis. The expression data and genomic annotations are stored in bedGraph-format files for quick access by JBrowse (version 1.16.6) (https://jbrowse.org/blog/) (Supplemental Fig. S7; Buels et al. 2016).
Our study was based on the mm9 genome reference. To harmonize the reference genome, the data sets aligned to mm10 were converted to mm9 genome reference by LiftOver (https://genome.ucsc.edu/cgi-bin/hgLiftOver) (Kuhn et al. 2013). Realigning the reads to hg38 or mm10 would not significantly affect the conclusions because the signal and peaks surrounding protein-coding genes using hg38 and mm10 were consistent with hg19 and mm9 (Supplemental Method; Supplemental Fig. S8). Specifically, first, the percentages of promoters (2 kb upstream of TSSs) overlapping with the ATAC-seq peak using mm10 were consistent with mm9 (Supplemental Fig. S8A). Second, the signal densities using mm9 and mm10 for the same samples were highly correlated (R ≥ 0.94) (Supplemental Fig. S8B). Third, the signal and peaks surrounding gene Rpl38 using mm10 were consistent with mm9 (Supplemental Fig. S8C). Furthermore, the original mm9 peaks were consistent with the converted mm9 peaks of Rpl38 (peaks on mm9 converted from peaks on mm10 by LiftOver (https:// genome.ucsc.edu/cgi-bin/hgLiftOver) (Supplemental Fig. S8D; Kuhn et al. 2013).
The detailed parameters of the publicly processed data are summarized in Supplemental Table S4. The data processing information of all collected data sets is displayed in Supplemental Table S5. Scripts used to convert data format are provided as Supplemental Code.
Quality control
We applied a customized pipeline to process the collected sequencing data (Supplemental Fig. S7). First, the quality of the raw sequencing data is evaluated by FastQC (http://www.bioinformatics.babraham.ac.uk/projects/fastqc), and low-quality read ends and adapter sequences are filtered and removed using Trim Galore! (https://www.bioinformatics.babraham.ac.uk/projects/trim_galore/).
RNA-seq analysis
To show the gene expression information in “multi-omics visualization,” we downloaded the raw data of mouse and human embryos from GEO (https://www.ncbi.nlm.nih.gov/geo/) (Barrett et al. 2013). We ran STAR (version 2.7.10a) (https://github.com/alexdobin/STAR/) (Dobin et al. 2013) to map the reads to the mm9 (GSE66852) or hg19 (GSE101571) reference genome with default parameters, and only uniquely mapped reads were retained. Then the BAM files of samples at the same developmental stage were merged through SAMtools (version 1.7) (https://github.com/samtools/samtools) (Li et al. 2009). deepTools (version 3.5.1) (https://github.com/deeptools/deepTools) (Ramírez et al. 2016) was applied with the following command: “bamCoverage ‐‐bam ‐‐outFileName,” to obtain bigWig files for the visualization of gene expression. Scripts used to analyze data are provided as Supplemental Code.
ATAC-seq and ChIP-seq analysis
Definition of accessible chromatin dynamics during preimplantation
Accessible chromatin that was “maintained” was defined as accessible chromatin in the current stage with ≥25% overlapped with the previous stage identified using bedops (parameters: bedops -element-of 25%; the argument to ‐‐element-of is a value that species to the degree of overlap for elements). The value is either integral for per-base overlap or fractional for overlap measured by length. Accessible chromatin that was “gained” in the current stage was defined as accessible chromatin without overlap with the previous stage at least 25% (parameters: bedops -n -25%; the ‐‐not-element-of operation shows elements in the reference file that do not overlap elements in all other sets), and accessible chromatin that was “lost” in the previous stage was defined as accessible chromatin without overlap with the current stage at least 25% (parameters: bedops -n -25%).
Determination of epigenetic mark density in gene promoters
To examine the level of chromatin accessibility, histone modifications, and DNA methylation, we first counted the total ATAC-seq or ChIP-seq reads at the gene promoters (2 kb upstream of TSSs), and then called the density by calculating the fragments per kilobase of transcript per million reads mapped (FPKM) of each marker by the Perl (https://www.perl.org/) program.
Examination of correlations between gene expression and epigenetic marks
For each developmental stage, we sorted genes in descending order of expression, divided the genes into 100 copies, and calculated a mean value for each copy. Correlation coefficients (R2 values) and P-values were calculated by Pearson's linear correlation.
Identification of TFBSs
Position-specific weight matrices of 395 TFs corresponding to 427 motifs were collected from the HOCOMOCO (v10) database (Kulakovskiy et al. 2016). Genomic sequences from an accessible chromatin region in the mm9 genome were used as input for FIMO analysis (Grant et al. 2011). A custom library containing all 427 motifs was used to scan for motifs at a P-value threshold of 10−5. For each TF, multiple motifs, if present, were combined to generate the corresponding TFBSs.
Hi-C data analysis
As for Hi-C data, HiC-Pro (version 2.11.4) (https://github.com/nservant/HiC-Pro) (Servant et al. 2015) was used to process the allvalidpairs data to generate normalized “.matrix” files in different resolutions. Then, we converted “.matrix” files to “.h5” files using HiCExplorer (version 3.5.1) (Wolff et al. 2020; https://hicexplorer.readthedocs.io/en/latest/index.html) command “hicConvertFormat -matrices ‐‐inputFormat hicpro -bedFileHicpro -outFileName ‐‐outputFormat h5” for calculating and visualizing the genome, chromosome, compartment, TAD, and significant interactions (loop) in “3D genome” analysis. Scripts used to build matrix and convert format are provided as Supplemental Code.
Identification of significant interactions, TAD boundaries, and compartment
The “.h5” files were subjected to the HiCExplorer (version 3.5.1) (https://hicexplorer.readthedocs.io/en/latest/index.html) (Wolff et al. 2020) to identify significant interactions using hicDetectLoops with a default parameter (P-value = 0.01) in 5-kb resolution. TAD in Figure 6, C and E, was detected by using a 40-kb resolution normalized contact matrix described in the previous work (Schmitt et al. 2016). TAD boundaries were identified by using the insulation score method at 40-kb resolution (Oldfield et al. 2014), with two minor modifications.
dbEmbryo construction: system design and implementation
dbEmbryo is freely available at https://sysomics.com/dbEmbryo/. All raw data were preprocessed and stored on the cloud server in formats such as BED, bigWig, and TXT. For the convenience of retrieval, commonly used data such as gene locus information are stored in the MongoDB (version 4.2.1; https://www.mongodb.com/try/download/community) database. The web interface was implemented using Node.js (version 12.13.0) (https://nodejs.org/en/download/). The business logic and presentation layers were separated by using the model-view-controller design pattern. Distributed task scheduling was implemented using Celery (version 4.4.0) (https://docs.celeryq.dev/en/stable/index.html). All plots are generated by server-side R (R Core Team 2022) scripts. In addition, the genome browser function is implemented by JBrowse (version 1.16.6) (https://jbrowse.org/blog/) (Buels et al. 2016).
Competing interest statement
The authors declare no competing interests.
Acknowledgments
We thank the Beijing Cloudna Technology Co., Ltd., for technical support. This work was supported by the National Natural Science Foundation of China (http://www.nsfc.gov.cn; no. 31900488, 82001520, 62173338, and 61873276 to Hao Li, X.T., H.C., and X.Bo, respectively) and the Beijing Nova Program of Science and Technology (https://mis.kw.beijing.gov.cn; no. Z191100001119064 to H.C.).
Footnotes
-
[Supplemental material is available for this article.]
-
Article published online before print. Article, supplemental material, and publication date are at https://www.genome.org/cgi/doi/10.1101/gr.276744.122.
-
Freely available online through the Genome Research Open Access option.
- Received March 10, 2022.
- Accepted July 15, 2022.
This article, published in Genome Research, is available under a Creative Commons License (Attribution-NonCommercial 4.0 International), as described at http://creativecommons.org/licenses/by-nc/4.0/.


