
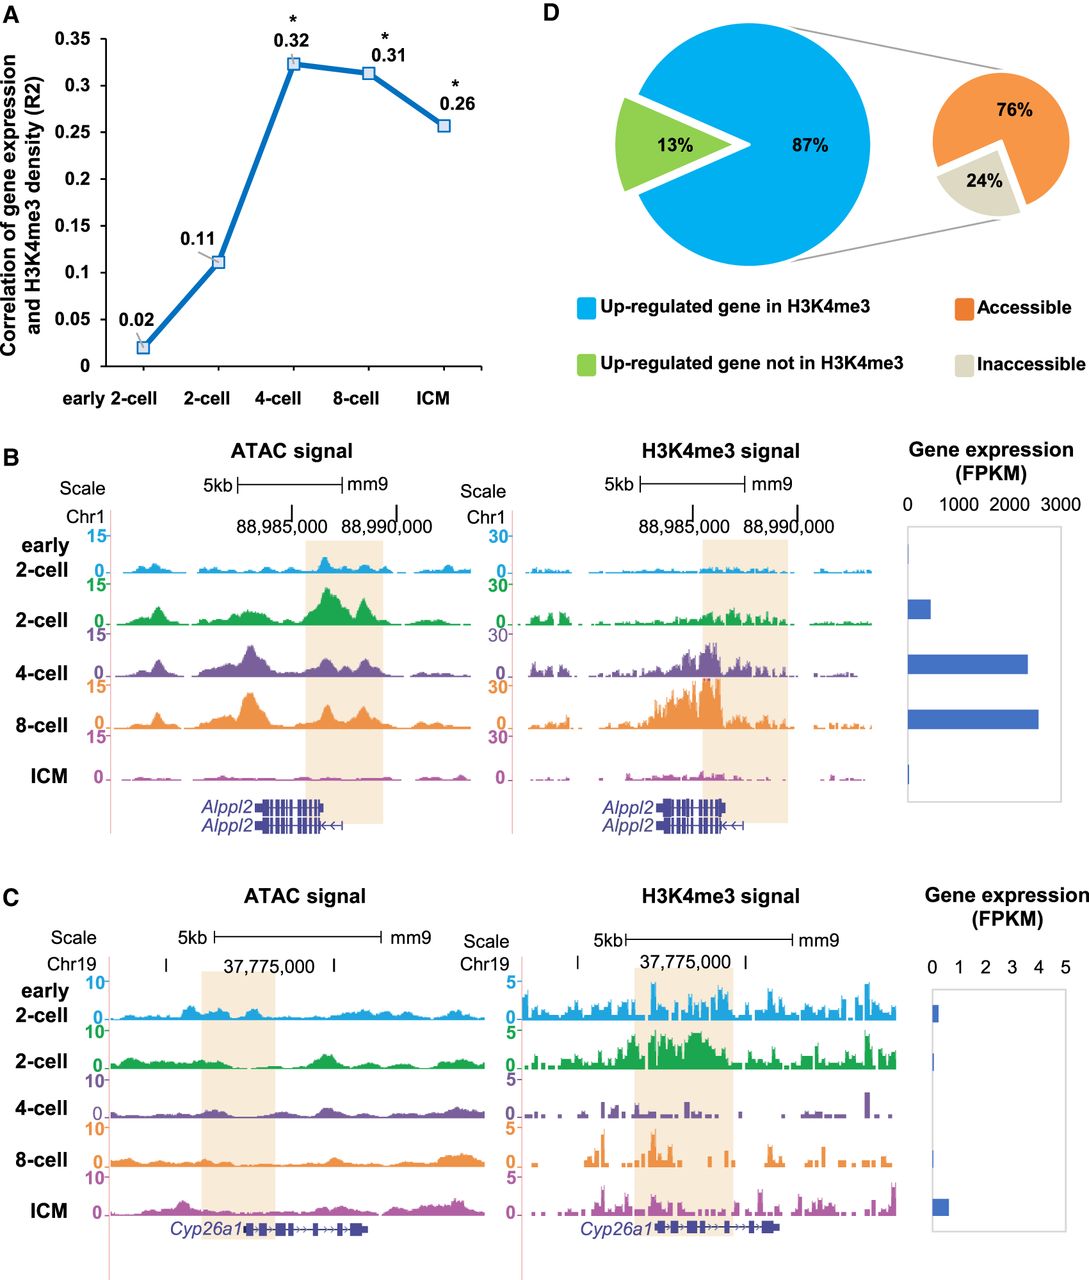
H3K4me3 facilitates gene up-regulation in the four-cell stage. (A) Correlations between gene expression (GSE66582) and H3K4me3 (GSE71434) signal levels in promoters (2 kb upstream of TSSs) of ZGA-only genes. Correlation coefficients (R2 values) were calculated by Pearson's linear correlation. (*) 1 × 10⁻⁵< P < 1 × 10⁻¹⁰. (B) UCSC plots show chromatin accessibility (GSE66581) and H3K4me3 (GSE71434) signal surrounding gene Alppl2. Bar plot shows the expression level of gene Alppl2. (C) UCSC plots show chromatin accessibility (GSE66581) and H3K4me3 (GSE71434) signal surrounding gene Cyp26a1. Bar plot shows the expression level of gene Cyp26a1. (D) Pie charts show the percentage of up-regulated genes with and without H3K4me3 (GSE71434) peaks in the promoter (left) and chromatin accessibility of up-regulated genes that are targeted by H3K4me3 (GSE71434) peaks in the promoter (right).


