
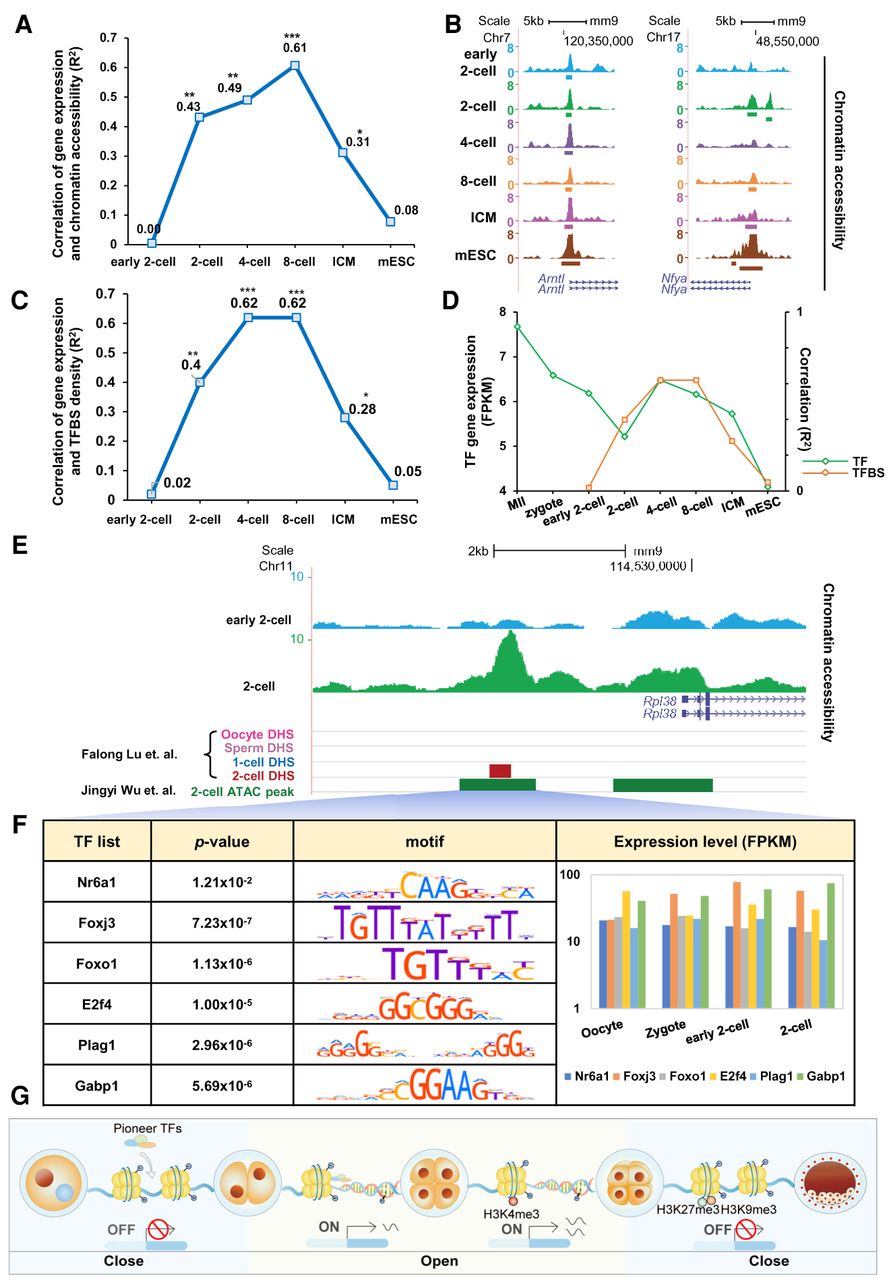
Accessible chromatin initiates transcriptional activity in the two-cell stage. (A) Correlations between gene expression (NCBI Gene Expression Omnibus [GEO; https://www.ncbi.nlm.nih.gov/geo/] GSE66582) and chromatin accessibility (GEO; GSE66581) in promoters (2 kb upstream of TSSs) of ZGA-only genes. Correlation coefficients (R2 values) were calculated by Pearson's linear correlation: (*) 1 × 10⁻⁵< P < 1× 10⁻¹⁰, (**) 1 × 10⁻¹⁰< P < 1 × 10⁻²⁰, (***) P < 1× 10⁻²⁰. (B) UCSC plots show chromatin accessibility (GSE66581) in promoters of the genes Arntl and Nfya. (C) Correlations between gene expression (GSE66582) and TFBS density in promoter regions (2 kb upstream of TSSs) of ZGA-only genes. Correlation coefficients (R2 values) were calculated by Pearson's linear correlation. (*) 1 × 10⁻⁵< P < 1 × 10⁻¹⁰, (**) 1 × 10⁻¹⁰< P < 1 × 10⁻²⁰, (***) P < 1 × 10⁻²⁰. (D) The green line shows the average expression level for 395 TFs, determined as described in the Methods; the orange line shows correlation coefficients between gene expression (GSE66582) and TFBS density. (E) UCSC plot shows chromatin accessibility (GSE66581) of Rpl38 in the early two-cell and two-cell stages. DHSs (GSE76642) and ATAC peaks (GSE66581) by other studies are also shown. (F) TFBSs scanned in corresponding ATAC peak. P-value is calculated by FIMO. Motif figures are collected from the HOCOMOCO (v10) database. The bar plot shows expression levels of TFs. (G) Transcriptional regulatory model in early embryo development.


