
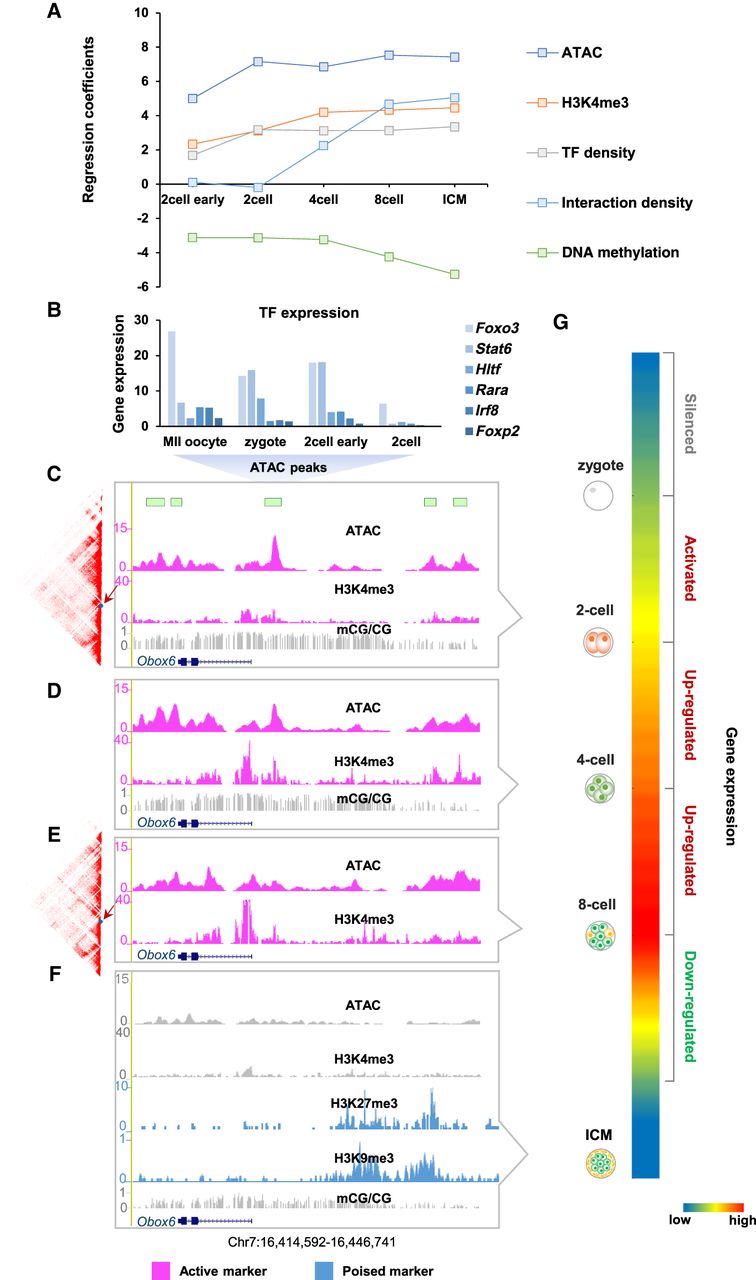
Different layers of epigenetic marks shape transcriptional programs. (A) The linear regression quantitatively describes the effects of different layers of epigenetic marks (ATAC-seq: GSE66581; H3K4me3: GSE71434; HiC: GSE82185; DNA methylation: GSE56697) on transcriptional activity in preimplantation embryos. The analysis was conducted on ZGA-only genes. (B–G) Gene Obox6 illustrates the relationship between different layers of epigenetic information (ATAC-seq: GSE66581; H3K4me3: GSE71434; H3K9me3: GSE97778; H3K27me3: GSE76687; mCG/CG: GSE56697) and transcriptional activity (GSE66582). (B) TFBSs scanned in accessible chromatin of Obox6. Expression levels of these TFs were high (FPKM ≥ 10). (C–F) UCSC plots show the epigenetic signal surrounding gene Obox6 for two-, four-, and eight-cell embryos and ICM. (G) Colormap shows the expression level of Obox6 during preimplantation.


