
Cell cycle arrest explains the observed bulk 3D genomic alterations in response to long-term heat shock in K562 cells
- 1Beijing Institute of Genomics, Chinese Academy of Sciences, and China National Center for Bioinformation, Chaoyang District, Beijing 100101, China;
- 2School of Life Science, University of Chinese Academy of Sciences, Beijing 101408, China;
- 3School of Kinesiology, Shanghai University of Sport, Shanghai 200438, China;
- 4Department of Cell Biology and Genetics, Core Facility of Developmental Biology, Chongqing Medical University, Chongqing 400016, China;
- 5Division of Cell, Developmental and Integrative Biology, School of Medicine, South China University of Technology, Guangzhou 510006, China
-
↵6 These authors contributed equally to this work.
Abstract
Heat shock is a common environmental stress, although the response of the nucleus to it remains controversial in mammalian cells. Acute reaction and chronic adaptation to environmental stress may have distinct internal rewiring in the gene regulation networks. However, this difference remains largely unexplored. Here, we report that chromatin conformation and chromatin accessibility respond differently in short- and long-term heat shock in human K562 cells. We found that chromatin conformation in K562 cells was largely stable in response to short-term heat shock, whereas it showed clear and characteristic changes after long-term heat treatment with little alteration in chromatin accessibility during the whole process. We further show in silico and experimental evidence strongly suggesting that changes in chromatin conformation may largely stem from an accumulation of cells in the M stage of the cell cycle in response to heat shock. Our results represent a paradigm shift away from the controversial view of chromatin response to heat shock and emphasize the necessity of cell cycle analysis when interpreting bulk Hi-C data.
Environmental fluctuations are part and parcel of living organisms. For example, temperature change is a common environmental stress, and the mechanism for heat shock (HS) response reported in the literature showed certain consensus patterns from yeasts to humans (Hartl et al. 2011). More specifically, cells globally repress their transcription (Vihervaara et al. 2018), RNA processing (Biamonti and Caceres 2009; Shalgi et al. 2014), and translation for most genes during HS (Panniers 1994; Shalgi et al. 2013), whereas many HS proteins (HSPs), acting as molecular chaperons, are induced, such as HSP70 and HSP90 (Kregel 2002; Fujimoto and Nakai 2010). As HSPs are also prominent in various tumor types (Khalil et al. 2011), HS is not just a simple model system for gene regulation studies but also a bellwether for related diseases.
Cells may have distinct reactions, depending on the length of heat treatment (Kühl and Rensing 2000). This is plausible because cells must both respond to immediate environmental crises and adapt to the resultant altered environment, or return to the prestimulus status after a sufficiently long period of experiencing persistent change (Roti Roti et al. 1992; Lenis Sanin et al. 2015). However, to the best of our knowledge, most mechanistic studies concerning gene transcription regulation in animal cells are conducted under short-term HS (SHS) (Vihervaara et al. 2018).
Gene transcription is repressed during HS (Mahat et al. 2016; Vihervaara et al. 2017), whereas the behavior of chromatin spatial structures associated with gene regulation (Hübner et al. 2013) in response to HS remains controversial. On the one hand, changes in chromatin spatial structure, such as genome compartments (Lieberman-Aiden et al. 2009), topological associated domains (TADs) (Dixon et al. 2012), and chromatin loops (Rao et al. 2014), have been reported to occur in association with transcriptional responses to HS in many species. For example, in yeast, up-regulated HSP genes undergo a dynamic alteration of their 3D genome structure (Chowdhary et al. 2017, 2019). In Drosophila kc167 cells, HS induces relocalization of architectural proteins from the TAD borders to the interior of TADs, causing dramatic arrangement in the 3D organization of chromatin (Li et al. 2015). In mammalians, it has been shown that chromatin loops undergo pronounced changes in human ES cells in response to HS and that the frequency of the loop interactions is correlated with the level of nascent transcription (Lyu et al. 2018). On the other hand, in the human myelogenous leukemia cell line (K562) and Drosophila S2 cells, the chromosomal architecture remained largely stable after SHS (Ray et al. 2019). These divergent findings call for a more intensive study of chromosomal architecture in reaction to HS.
At the cellular level, HS treatment can probably arrest cells at various phases of the cell cycle, depending on the cell type (Kühl and Rensing 2000; Velichko et al. 2013). For example, in human glioblastoma cells, heat-induced expression of HSP 70 correlates with the induction of CDKN1A and subsequent G1 cell cycle arrest (Fuse et al. 1996). In K562 cells, heat treatment caused significant accumulation of cells in the G2/M phase at 12–30 h post exposure (Mannerling et al. 2010).
However, the responses toward LHS at the levels of chromatin structure appear to be an underexplored topic in the literature, and it is far from clear if cells respond to SHS and LHS in a similar manner. To address these questions, we profiled chromatin conformation and chromatin accessibility in human K562 cells under normal, SHS, and LHS conditions. We also evaluated the possible effect of HS-induced cell cycle arrest on chromatin conformation changes by analyzing the chromatin conformation of FACS-sorted G1/S and G2/M cells. Our results not only revealed the underlying mechanism of gene regulation in reaction to immediate crisis and environmental adaptation but also showed the impact of cell cycle redistribution on bulk Hi-C data of HS and other stimuli.
Results
Chromatin conformation remains largely stable after SHS but undergoes substantial changes after long-term heat treatment
To understand the response of chromosomal conformation to SHS and LHS, we performed Hi-C experiments (Lieberman-Aiden et al. 2009) on human K562 cells under normal culture temperature (37°C, NHS) and for 30 min (SHS) and 6 h (LHS) at 42°C with at least two biological replicates for all conditions (Supplemental Fig. S1A). The Hi-C library was highly reproducible, given that the median GenomeDISCO (Ursu et al. 2018) scores between replicates were at least 0.85 among all chromosomes for all three conditions with a bin size ≥50 kb (Supplemental Fig. S1B). We merged the replicates, which yielded about 490 million, 315 million, and 567 million pairs of contacts for NHS, SHS, and LHS, respectively, for all subsequent analysis (Supplemental Table S1).
Hi-C contact maps were highly similar between NHS and SHS but substantially changed after LHS (Fig. 1A; Supplemental Fig. S1C). First, the overall contact matrices and contact frequency decay curves (also known as p(s)-curves) (Fudenberg and Mirny 2012) were similar between NHS and SHS, whereas they were very different from those of LHS. The GenomeDISCO score between the Hi-C map of NHS and SHS was comparable to the score between the biological replicates (median = 0.91, bin size = 50 kb), whereas this same score was significantly smaller between SHS and LHS (median = 0.73, bin size = 50 kb) (Supplemental Fig. S1D). Using Jensen–Shannon divergence (JSD) to measure the closeness of two p(s)-curves, we found the JSD to be 0.012 and 0.062 between NHS and SHS and between SHS and LHS, respectively (Fig. 1B). The much smaller JSD indicates a relatively stable p(s)-curve in response to SHS, whereas changes happened after LHS, for example, increased distal contact frequency from ∼0.5 Mb to 13.2 Mb for LHS (Fig. 1B).
Chromatin conformation remained stable after short-term HS (SHS), whereas it is mostly altered after long-term HS (LHS). (A) Chr 6 is shown with 500-kb resolution as an example of the contact maps in K562 cells during the process of HS. (B) Contact frequency decay curves at normal HS (NHS), SHS, and LHS conditions. (C) Chromatin compartmentalization at the three conditions. Chr 6 is shown as an example. The autocorrelation matrices together with the first eigenvector profiles are shown. In the first eigenvector, compartment B is colored as blue and A as orange. (D) Genome-wide compartment scores at each condition. (E) TADs detected in a 4-Mb region centered at the TSS of HSPA1A gene are shown as an example, together with the corresponding contact maps. The insulation score profiles of the same region are also shown below. The detected TADs are shaded. (F) Genome-wide insulation score profiles around TAD boundaries at the three conditions. (G) Numbers and proportions of overlap of chromatin loops at the three conditions. (H) Distributions of z-scores of LHS-specific loops in NHS and SHS conditions. Dashed lines indicate the distributions of z-scores of the randomly chosen bin pairs with the same genome distances. Black dashed line shows the proportion of LHS-specific loops that had z-scores of contacts greater than two compared with their flanking regions.
Second, HS lasting 30 min slightly shrank the A/B compartments (Lieberman-Aiden et al. 2009) but substantially changed the plaid pattern in the autocorrelation matrices after LHS (Fig. 1C). Genome-wide, 3.6% of bins underwent compartment switches between NHS and SHS, whereas more than sixfold more bins (23.04%) switched compartments after LHS (Supplemental Fig. S1E). Quantitatively, the differences in compartment strengths (AB/AA + BB) between NHS and SHS were minor, as the chromosome-wise average compartment strengths were 0.2143 and 0.2069 (P = 0.0014, t-test), respectively, whereas they grew to 0.3045 in LHS (P = 1.6 × 10⁻⁴, and 5.71 × 10⁻⁵, comparing LHS with NHS and SHS, respectively, t-test) (Fig. 1D).
Third, TADs remained largely unshifted in response to HS (Dixon et al. 2012), irrespective of the duration of heat treatment, whereas they became much weaker after LHS (Fig. 1E). Using deDoc (Li et al. 2018), we called 2104, 2207, and 2307 TADs in NHS, SHS, and LHS at 10-kb resolution, respectively. CTCF peaks (The ENCODE Project Consortium 2012) were enriched in the called TAD boundaries. About 33% of TAD boundaries in NHS condition overlapped with at least one CTCF peak compared with no more than 14% in randomly chosen regions, indicating accuracy of the called TADs. When comparing the TAD boundaries between any two conditions, at least 40% of boundaries remained stable, not shifting more than one bin (Supplemental Fig. S2A). The percentage of stable TAD boundaries between conditions was threefold greater than that between cell lines. For example, only ∼11.2% of TAD boundaries were found to be stable between GM12878 and K562 based on public Hi-C data (Rao et al. 2014). The similarity between NHS and SHS was comparable to that between replicated libraries, as ∼56% and 54% of boundaries were found to be stable, respectively. We also called condition-specific TAD boundaries and found that insulation scores (ISs) of condition-specific boundaries were also lower than their flanking regions in conditions in which the boundaries were not identified, further indicating that the position of TAD boundaries kept stable (Supplemental Fig. S2B). In addition, we specially analyzed the loop domains (Rao et al. 2014; Sanborn et al. 2015) and found their position also kept stable during HS (Supplemental Material; Supplemental Fig. S2C). Despite the stability of TAD positions and the similarity of TAD strengths between NHS and SHS, those strengths became much weaker after LHS. The ISs of TAD boundaries (Ramírez et al. 2018) in SHS only reflected 0.19% of changes compared with NHS, that is, with mean IS = −2.3722 and −2.3768 (P = 0.0028, paired t-test), respectively, whereas they reflected 1.91% of changes after LHS (IS = −2.3269, P = 1.15 × 10−67, paired t-test) (Fig. 1F). Moreover, TAD strength scores (defined as the fraction of inter-TAD contacts in total intra-chromosome contacts) (Gong et al. 2018) in SHS were only 0.99% different from those of NHS, that is, chromosome-wise mean TAD strength = 0.3838 and 0.3876 (P = 0.036, paired t-test), respectively, whereas they increased 18.45% to 0.4546 at LHS (P = 1.23 × 10⁻¹⁹, paired t-test) (Supplemental Fig. S2D). Taken together, we found that TADs could remain stable within 30 min of HS exposure and largely remain unshifted but became much weaker after 6 h of HS.
Fourth, chromatin loops were less stable in response to HS; however, the strength and significance of these changes were minor. Using HiCCUPS (Durand et al. 2016), we identified 5623, 4533, and 9497 chromatin loops >200 kb, initiating from 8150, 6494, and 13,781 anchors in NHS, SHS, and LHS, respectively (Fig. 1G). Although only 2779 loops were shared by all three conditions (Fig. 1G), the following evidence supports that the alterations of condition-specific loops were minor. We compared the observed/expected (O/E) contact frequencies of condition-specific loops in different conditions. For a pair of conditions, loops specific to one condition also tended to have highly enriched contact frequencies in the other condition (Supplemental Fig. S2E, upper panel). Moreover, we used cosine similarity to compare the contact frequencies of condition pairs between conditions called as loops and those not, with results >0.95 in all comparisons (Supplemental Fig. S2E, lower panel). This was still the case when we merged all the reads in the three conditions and formed a reference loop list (Supplemental Material; Supplemental Fig. S2F,G). Because the fraction of shared loops between NHS and SHS is nearly comparable with that of shared loops between biological replicates in the public GM12878 data set (Fig. 1G; Supplemental Fig. S2H; Rao et al. 2014), we now mainly focus on loops specific to LHS. Here, we found that the contacts between LHS-specific loop anchors in the NHS and SHS conditions were also significantly higher than those in the flanking region; that is, 92.16% and 88.62% of LHS-specific loops also had z-scores of contacts greater than two compared with their flanking regions in the NHS and SHS conditions, respectively (see Methods) (Fig. 1H), whereas only ∼17% of such bin pairs could be seen in random control (Fig. 1H). This observation indicated that contacts had been concentrated between these LHS-specific loop anchors in the NHS and SHS conditions. Furthermore, the binding affinities of CTCF to the anchors of LHS-specific loops were nearly comparable with those of all combined loops in NHS (P = 0.05, t-test) (Supplemental Fig. S2I). Finally, genes located in the anchors of these LHS-specific loops did not enrich any Gene Ontology (GO) (The Gene Ontology Consortium et al. 2000) functional terms (with threshold Q-value < 0.05) (Supplemental Table S2). These data collectively imply that the condition-dependent specificity of these loops may be rather weak or may result from the insensitivity of the state-of-the-art chromatin loop callers (Lagler et al. 2021).
Altogether, our data suggested that chromatin conformation may remain stable under SHS but that it could gain notable changes after long-term heat exposure at all levels.
Local nucleosomal environment remains stable during the whole process of HS
To characterize the local nucleosomal environment, for example, the accessibility of chromatin, we performed ATAC-seq with two biological replicates (Buenrostro et al. 2013), obtaining 55, 64, and 54 million de-duplicated reads for NHS, SHS, and LHS cells in total, respectively. The data were highly reproducible (Fig. 2A) and had characteristic peaks in fragment size distribution representing mono-, di-, and trinucleosomes (Supplemental Fig. S3A), indicating high quality.
Local chromatin environments remains stable during the whole process of HS. (A) ATAC-seq signal profiles (observed/expected calculated by MACS2) of the biological replicates at the NHS, SHS, and LHS conditions. The 200-kb region centered at the TSS of HSPA1B gene is shown. Only a part of gene symbols is listed owing to the limited space. (B) Distribution of ATAC-seq peaks over genome elements in the three conditions. (C) Numbers and overlaps of accessible genes (TSSs covered by NFRs) in the three conditions. (D) Distributions of NFRs around TSSs of accessible genes. (E) Volcano plot showing the results of the differential accessibility analysis in NFRs before and after HS. Accessibility was measured by the coverage depth of short ATAC-seq fragments. (F) Comparisons of accessibility levels of promoters and dTREs before (NHS) and after LHS. The lines mark the regression fits.
As the indicator for the local nucleosomal environment, the characteristics of ATAC-seq remained stable after HS. First, the ATAC-seq signaling profiles were highly correlated with each other in the three conditions with similar cosine measurements larger than 0.95 when comparing any two conditions (Fig. 2A). A total of 30,326 (21.96 Mb), 25,503 (18.49 Mb), and 26,358 (19.01 Mb) recurrent peaks were called for NHS, SHS, and LHS by MACS2 (Zhang et al. 2008), respectively. About 58% to 63% of the genome identified as peaks in one condition could also be identified as peaks in the other two conditions. This ratio was similar to that between biological replicates (55% to 63%) (Supplemental Fig. S3B). Notably, 13.61 Mb of the genome was called as peaks in all three conditions, thereby occupying >50% of the regions called as peaks in any condition (Supplemental Fig. S3B). Fewer than 5% of the peaks were identified as different between conditions by DESeq2 (FC > 1 and P < 0.01) (Supplemental Fig. S3C; Love et al. 2014). The distribution of ATAC-seq peaks over genome elements was also found to be nearly identical among the three conditions (Fig. 2B) with most peaks located in the promoters and enhancers. Second, nucleosome-free regions (NFRs) in the promoters, as a particularly interesting local chromatin feature, were found to be highly stable in response to heat. Using our nucleosome detection algorithm, deNOPA (Xu et al. 2022), we identified 113,429, 90,101, and 95,576 high-quality NFRs in NHS, SHS, and LHS, respectively (Supplemental Fig. S3D,E). Highly enriched ubiquitin-related GO terms in HS specifically accessible genes (with TSS covered by NFR) further indicated the high quality of the called NFRs (Supplemental Fig. S3F; Aprile-Garcia et al. 2019). Overall, HS had little effect on NFRs. For example, compared with NHS, the percentages of intact NFRs in SHS and LHS (52.50% and 53.20%, respectively; see Methods) were comparable to those between biological replicates (55.17% in NHS). Most (84.86%) of the expressed protein-coding genes covered by NFRs in the TSS in one condition also contained NFRs in other conditions (Fig. 2C; Vihervaara et al. 2017) with almost identical distribution in the TSS regions among conditions (Fig. 2D). The enriched GO terms in these genes were also almost identical among the three conditions (Supplemental Fig. S3G). Third, the accessibility of chromatin, especially in NFRs, was largely stable during HS. We measured accessibility of the NFRs using coverage depth of short fragments (insertion lengths ≤ 101 bp). Results showed that <2% of NFRs had significant accessibility changes after heat stress, even at the loose threshold of FDR < 0.05; that is, 67 and 583 NFRs were changed after SHS and LHS, respectively (Fig. 2E).
We then quantitatively measured and compared the accessibility of two classes of the most important regulatory elements, promoters and distal transcription regulatory elements (dTREs), using the coverage depths of short ATAC-seq fragments. The accessible levels of both promoters and dTREs were globally maintained, even after LHS, with larger variability for dTREs (R2 is 0.95 and 0.74 for promoters and dTREs, comparing LHS and NHS) (Fig. 2F). No more than 1% of promoters or dTREs were identified as differential accessible regions under threshold FDR < 0.05. These results indicated that the accessibility of regulatory elements underwent little change upon HS.
Collectively, our results showed that the local nucleosomal environment was largely unchanged during the whole process of HS.
Chromatin conformation of G1/S cells remains largely intact after HS
The cell cycle can be arrested under HS (Rowley et al. 1993; Kühl and Rensing 2000; Kakihana et al. 2019). In addition, chromatin conformation was significantly different between G1/S and G2/M cells (Naumova et al. 2013; Nagano et al. 2017). Therefore, we asked whether alteration of the Hi-C contact map we observed could have resulted from redistribution of the cell cycle status in the cell population after LHS. Indeed, we observed a substantially increased percentage of G2/M cells after LHS by FACS analysis (Supplemental Fig. S4A). Again, we asked how much of the Hi-C map differences we observed could be attributed to this redistribution of cell cycle status, especially because overall local chromatin accessibility was considered stable during the cell cycle (Hsiung et al. 2015; Coux et al. 2020). To address these questions, we sorted the cells into G1/S and G2/M phases by FACS in three conditions and performed Hi-C experiments for all sorted cells. The results for G1/S and G2/M cells are presented in this section and the next, separately. For G1/S cells, 236 million, 616 million, and 559 million of high-quality contacts were obtained for NHS, SHS, and LHS conditions, respectively, with high reproducibility between the biological replicates (Supplemental Fig. S4B; Supplemental Table S1).
The overall Hi-C contact maps of G1/S cells are almost identical after SHS and LHS (Fig. 3A). The chromosome-wise average GenomeDISCO scores between any two conditions were larger than 0.85, which is much higher than the scores between NHS and LHS in mixed cells (P < 1 × 10⁻¹⁰, paired t-test) (Supplemental Fig. S4C). The p(s)-curves of G1/S cells were also similar among the different conditions (Fig. 3B), considering that the JSD scores of two p(s)-curves between two temporally sequential conditions were 0.038 and 0.023, respectively, both much smaller than the JSD between SHS and LHS in mixed cells. From the p(s)-curve, little increase of ultralong interactions (>10 M) was noted after HS, which is also revealed by the fold change of contact profiles (Supplemental Fig. S4D), but the change is slight compared with that of mixed cells (Supplemental Fig. S1C).
Chromatin conformation in G1/S cells remains largely intact after LHS. (A) An example showing the contact maps of G1/S-phase cells in the process of HS; Chr 6 is shown with 500-kb resolution as in Figure 1A. (B) The contact frequency decay curves at the three conditions in G1/S-phase cells. (C) Chromatin compartmentalization at the three conditions in G1/S-phase cells. Chr 6 is shown as an example as in Figure 1C. The autocorrelation matrices, together with the first eigenvector profiles, are shown. (D) The chromosome-wise compartment scores at each condition in the G1/S-phase cells. (E) TADs detected in the same region as that shown in Figure 1E with G1/S cells, together with the corresponding contact maps and the insulation score profiles, are also shown. (F) Genome-wide insulation score profiles of G1/S cells around TAD boundaries at the three conditions. (G) Numbers and proportions of overlap of chromatin loops at the three conditions for G1/S cells.
The A/B compartment patterns were much more stable in G1/S cells than those in mixed cells. None of the alterations observed in mixed cells, for example, shrinkage of the autocorrelation matrix and the large proportion of compartment switching, were observed in G1/S cells (Fig. 3C; Supplemental Fig. S4E). Compared with the near 0.09 increase of average compartment strength in the mixed cells after LHS (Fig. 1D), the score changes in any comparisons with G1/S cells were smaller than 0.04 (P < 10−5, paired t-test) (Fig. 3D). A much smaller percentage of genome regions had also switched compartments after SHS and LHS, that is, 11.3% and 6.1% in G1/S versus 3.6% and 23.04% in mixed cells, respectively (Supplemental Figs. S1E, S4E).
G1/S cells showed intact TAD structure during HS (Fig. 3E). We identified 2684, 2846, and 2713 TADs in NHS, SHS, and LHS with median lengths of 740 kb, 750 kb, and 780 kb, respectively, in G1/S cells. Compared with ∼40% in mixed cells (Supplemental Fig. S2A), ∼50% of TAD boundaries were shared between any two conditions in G1/S (Supplemental Fig. S5A). Similar to the mixed cells, ISs of condition-specific boundaries remained lower than their flanking regions in conditions in which the boundaries were not identified, further indicating the stability of TAD boundaries in G1/S cells (Supplemental Fig. S5B). Both IS and TAD scores were slightly elevated when comparing SHS with NHS (P = 4.9 × 10⁻⁶ and 4.05 × 10⁻¹¹, respectively, paired t-test) and remained stable for IS (P = 0.20, Fig. 3F), or only slightly decreased for the TAD score (P = 5.43 × 10⁻⁷) (Supplemental Fig. S5C), when comparing LHS with SHS. However, the magnitude of the changes in both IS and TAD scores was significantly smaller than that between NHS and LHS in the mixed cells (Fig. 1E,F).
Loop structures were also largely stable after HS in G1/S cells with fewer condition-specific loops found compared with mixed cells. There were 7445, 5761, and 6357 intra-chromosome loops called in NHS, SHS, and LHS conditions separated by >200 kb, respectively (Fig. 3G). Among these, 2164 loops were shared among different conditions, and the proportion of common loops between any two conditions was comparable to that between biological replicates in the public GM12878 data set (Fig. 3G; Supplemental Fig. S2H). In addition, loops specific to one condition also tend to have enriched contact frequencies (with O/E contact frequency larger than one) in other conditions. Moreover, the cosine similarity scores of the contact frequencies between conditions called as loops, or not, were consistently high (>0.9 in all comparisons) (Supplemental Fig. S5D). This, again, further illustrates the stability of loops for G1/S cells.
We noticed few conformation changes for G1/S cells when comparing SHS with NHS. However, such change is minor in comparison to the observed changes after LHS in mixed cells. In addition, because they are independent of SHS-induced transcription regulation, these minor changes may have no biological significance. We investigated the correlation between the sign of gene expression changes (sign of log2 fold changes of PRO-seq signals) and the 3D structure changes after SHS, for example, switch of A/B compartment and changes of TAD strength, and little significant correlation was seen. More than 93% of differential expressed genes after SHS remained in the same compartment (Supplemental Fig. S4F, left panel). Condition-specific dTREs were also not correlated with compartment switches (P = 0.81, chi-square test of contingency tables) (Supplemental Fig. S4F, right panel). Changes in ISs between HS-induced and -repressed genes or between condition-specific dTREs were not significantly different (P > 0.01 in any comparison, K–S test) (Supplemental Fig. S4G). In addition, no significant correlation between the regulatory direction of genes or dTREs and condition-specific loops was detected (P > 0.01 in any comparison, chi-square test of contingency tables) (Supplemental Fig. S4H).
Altogether, the overall consensus of p(s), A/B compartments, TADs, and loops showed a rather stable pattern between SHS and LHS and slight, or no, changes compared with NHS for G1/S cells. These slight changes were not associated with HS-induced transcription regulation.
Chromatin conformation of G2/M cells changes in the same direction as mixed cells, but to a lesser degree
For sorted G2/M cells, two biological replicates were conducted with high reproducibility, and 477 million, 488 million, and 623 million valid contacts were obtained from NHS, SHS, and LHS, respectively (Fig. 4A; Supplemental Fig. S6A). The overall Hi-C contact maps of G2/M cells experienced similar, but fewer, changes after SHS and LHS compared with those of mixed cells (Fig. 4A; Supplemental Fig. S6B).
Chromatin conformation of G2/M cells changes slightly during LHS. (A) Contact maps in G2/M-phase cells before and after HS. Chr 6 is shown at 500-kb resolution as in Figure 1A. (B) Contact frequency decay curves in G2/M-phase cells. (C) Chromatin compartmentalization in G2/M-phase cells. Chr 6 is shown as an example as in Figure 1C. Autocorrelation matrices, together with the first eigenvector profiles, are shown. (D) Chromosome-wise compartment scores in G2/M-phase cells in each condition. (E) TADs detected in same region as that shown in Figure 1E are shown as an example for G2/M cells, together with the corresponding contact maps and insulation score profiles. Detected TADs are shaded. (F) TAD strengths indicated by TAD scores in G2/M-phase cells at the three conditions. (G) Numbers and proportions of overlap of chromatin loops in G2/M-phase cells. (H) APA scores for the LHS-specific loops are shown in NHS and SHS conditions.
The Hi-C contact matrices of G2/M cells were similar between NHS and SHS and changed somewhat in LHS (Fig. 4A); that is, median GenomeDISCO scores were 0.83 and 0.81 between NHS and SHS and between SHS and LHS, respectively (Supplemental Fig. S6B), which is larger than that of scores in the mixed cells after LHS (0.74 and 0.72, when comparing LHS with NHS or SHS, respectively). Similarly, the JSD score of p(s)-curves between SHS and LHS in G2/M cells was 0.040, smaller than that in mixed cells (0.062) (Figs. 1B, 4B; Supplemental Fig. S6C).
The A/B compartment of G2/M cells changed during LHS, although the changes were smaller than those of mixed cells. The plaid pattern of autocorrelation matrix also shrank at LHS for G2/M cells but to a lesser degree than that in mixed cells (Figs. 4C, 1C). Quantitatively, compartment scores were comparable between NHS and SHS (with chromosome-wise average compartment scores of 0.22 and 0.20, P = 0.03, paired t-test) but were elevated significantly in LHS (0.26, P = 3.14 × 10⁻⁹) (Fig. 4D). However, after LHS, the compartment score was still smaller than that of the mixed cells, indicating stronger compartmentalization than that in the mixed cells (0.30, P = 0.02, paired t-test). In addition, fewer chromatin regions switched compartments between any two conditions in the G2/M cells compared with the mixed cells (<8.5%) (Supplemental Fig. S6D). In both the G1/S and G2/M cells, the compartmentalization was stronger than that in the mixed cells after LHS; therefore, the redistribution of cell cycle stages could be the most reasonable explanation for the compartmentalization shrinkage of mixed cells.
TAD structure of the G2/M cells also remained intact in SHS but slightly changed in LHS, albeit to a minor degree in comparison to that in the mixed cells (Fig. 4E; Supplemental Fig. S7A). Similar to the mixed cells, ISs of condition-specific boundaries were also lower than their flanking regions in conditions in which the boundaries were not identified (Supplemental Fig. S7B). The position of loop domains also kept stable in the G2/M cells (Supplemental Material; Supplemental Fig. S7C). Quantitatively, the chromosome-wise average TAD scores were 0.3397 and 0.3437 in NHS and SHS, respectively (P = 0.10, paired t-test), whereas they increased to 0.3796 after LHS (P = 1.16 × 10⁻¹²) (Fig. 4F), which was still smaller than that found in the mixed cells (0.4546, P = 2.08 × 10⁻¹⁶).
Similar to the mixed cells, some weak alterations were found at the loop level. There were 2326, 3550, and 5831 loops called in NHS, SHS, and LHS for G2/M cells with distances >200 kb between anchors, respectively; 1099 loops were found overlapped among the three conditions (Fig. 4G). Loops specific to one condition also tend to have enriched contact frequencies (with O/E contact frequency larger than one) in other conditions for which they were not called (Supplemental Fig. S7D). This stability of loops was also validated by APA analysis of condition-specific loops in conditions not called (Fig. 4H). Further, few differences of CTCF-binding strength (Supplemental Fig. S7E) or of heat-shock-related GO terms enrichment (Supplemental Table S3) were found for LHS-specific loop anchors.
Taken together, the slight changes of chromatin conformations in both the G1/S and G2/M cells under LHS indicate that the most plausible model for the observed chromatin conformation alteration in the mixed cells would be changes in the composition of cell stages.
Redistribution of G1/S and G2/M cells in response to HS explains Hi-C contact map changes after LHS
Given the rather stable chromatin conformation observed in the G1/S and G2/M cells in response to HS, it was natural to speculate that the changes observed in the mixed cells stemmed from the changes of cell composition of the cell cycle per se. By FACS, we found that the percentage of G2/M cells changed from 14.64% in NHS to 12.93% and 25.68% in SHS and LHS, respectively (Supplemental Fig. S4A). Using pubic PRO-seq data (Vihervaara et al. 2017), we found that “cell division” and “cell cycle” were among the most affected biological processes under SHS, which further validates the changes of distribution of cell cycle (Supplemental Fig. S8A; Supplemental Table S4). So, we asked whether cell cycle arrest might explain the observed Hi-C contact map changes.
First, the alteration of chromatin conformation from NHS to LHS mimicked the transition from G1/S to G2/M. Conformation was reported to be different between interphase and metaphase cells (Nagano et al. 2017), in which the M-phase cells were characterized by a slow decrease in p(s)-curve between 100 kb and 10 Mb, together with loss of compartments and TAD structure (Naumova et al. 2013). Similarly, in our data, we observed the same pattern when comparing LHS to SHS and NHS according to p(s)-curves (Fig. 1B). We also observed weaker compartmentalization and TAD strength in LHS (Fig. 1C,D,F; Supplemental Fig. S2D). In addition, the increased proportion of M-phase cells in G2/M cells coincided with chromatin conformation changes of G2/M cells during the HS process. To quantify the proportion of M cells in G2/M, we manually counted M cells from FACS-sorted G2/M cells by microscope (see Methods). In total, we manually counted 343, 285, and 409 G2/M cells in three independent inspections and identified an average of 34.7%, 36.8%, and 47.7% M cells in NHS, SHS, and LHS, respectively (Fig. 5A; Supplemental Table S5). Further, the Hi-C contact maps of the mixed cells seemed to be an average of those of the G1/S and G2/M cells. The p(s)-curve of the mixed cells was found to be located between the curves of the G2/M and G1/S cells, and TAD length also showed the same distributions (Supplemental Figs. S6C, S8B).
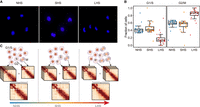
Cell cycle redistribution after LHS contributes to observed Hi-C contact map changes. (A) Representative images showing cell cycle phase in sorted G2/M cells for the three conditions. (B) Estimated cell fractions of G1/S- and G2/M-phase cells in mixed cells before and after HS calculated from different chromosomes. (C) Schematic diagram shows the main discoveries of our study.
Second, we conducted a simple linear deconvolution method to deduce the proportion of cell cycle states from the mixed Hi-C map. Briefly, the Hi-C contact maps were first transformed into distance matrices (Sheskin 1995) and then a linear model was constructed with matrices in G1/S and G2/M cells as independent variables and those of mixed cells as response variables (Methods). The transformation was designed to make the distance matrices merely independent to sequencing depth to avoid calculating the number of reads per cell. By applying this method to the three conditions, we found that the proportion of G1/S cells remained largely intact in SHS (P = 0.15, paired t-test) (Fig. 5B). After LHS, however, the proportion of G1/S cells was estimated to be decreased for most chromosomes (P < 10−8, paired t-test). In contrast, the proportion of G2/M cells was found to be increased for most chromosomes (Fig. 5B). This trend of cell fraction changes during the process of HS calculated from the Hi-C data was consistent with our FACS analysis (Supplemental Fig. S4A).
This evidence strongly points to a model in which redistribution of cell cycle plays a vital role in the observed changes of chromatin conformation in response to LHS in mixed cells (Fig. 5C).
Discussion
In this study, we explored how cells responded to SHS and LHS with changes in chromatin organization and accessibility. The chromatin conformation of K562 cells was notably stable in response to SHS, whereas it showed some characteristic changes after long-term heat treatment. Meanwhile, chromatin accessibility remained stable during the whole process. At the cell cycle level, we found that chromatin conformation of G1/S cells remained largely stable throughout the whole process of HS, whereas G2/M cells changed slightly after LHS. Based on these data, a cell cycle–stage redistribution model, namely, the accumulation of cells at M stage in response to LHS, emerged, and it was further supported by in silico and experimental evidence.
In agreement with the report of Ray et al. (2019) on K562 cells, we observed stable chromatin organization in SHS, which was inconsistent with the reported chromatin remodeling in fly and yeast (Li et al. 2015; Chowdhary et al. 2019). This discrepancy may not be completely explained by a species-specific response as notable chromatin loop remodeling in response to SHS was also reported in human embryonic stem cells (Lyu et al. 2018). Our findings were based on Hi-C, whereas Lyu et al. (2018) reported loop remodeling by HiChIP, which detected different types of interactions. In addition, although the K562 cell was a common model in 3D genome studies, with characteristic expression profiles of HSP genes (Supplemental Fig. S9), and responded to heat stress in transcription levels (Vihervaara et al. 2017) and HS factor redistribution (Vihervaara et al. 2013), we still cannot totally exclude the existence of cell type–specific chromatin conformation responses to HS, especially regarding the change in cell cycle timing. Moreover, cells in large and homothermal animals such as humans may be much more heterogeneous in tolerance to temperature changes than the cells of the fly and yeast (Mackey et al. 1992; Kühl and Rensing 2000). Thus, further studies may be needed to comprehensively survey mammalian cell types to profile the landscape of cellular response to HS in chromatin structure remodeling.
For LHS, we observed substantial changes in chromatin structure for mixed cells. The conformation of G1/S cells largely remained stable, and G2/M cells only slightly changed in structure during the whole process of HS. We proposed and showed evidence to support a model whereby conformation changes of mixed cells occurred through the redistribution of cells in cell cycle stages (Fig. 5B). It is not surprising that the mixture of subcomponents with little change results in larger changes in mixed cells, as chromatin structure is not simple linear combinations. We showed an example in the Supplemental Material and Supplemental Figure S10. Although PRO-seq of SHS cells has shown changes of cell cycle–related processes, we only observed the redistribution of cells in cell cycle at LHS, possibly resulting from the half-life of global mRNA in mammalian cells of about several hours (Shyu et al. 1989; Sharova et al. 2009). We did not provide evidence supporting stable chromatin conformation at each individual cell stage, such as G1, S, G2, and M. Therefore, although we could not completely exclude the possible existence of significant changes at the individual cell stages, it is rather unlikely, considering the principle of parsimony. G1/S mixed cells were found to have stable Hi-C maps during HS (Fig. 3), and the difference between G1 and S was reported to be minor (Nagano et al. 2017). If G1 and/or S cells experienced significant changes in chromatin conformation, a rather complicated regulation would need to be applied in order to achieve this overall stability. Although only a minor change was observed in G2/M mixed cells (Fig. 4), our simple simulation with the equally simple assumption of stable G2 and M conformation showed that such a change could be explained by the accumulation of M cells, as also directly observed through imaging. Finally, unchanged chromatin accessibility during the whole heat process for mixed cells further supported our model (Fig. 2). Genome-wide assessment of chromatin accessibility using DNase-seq, or ATAC-seq, has shown that mitotic chromosomes preserve significant levels of chromatin accessibility (Hsiung et al. 2015; Coux et al. 2020). Thus, if further study was to reveal that the chromatin structure at either cell stage changes significantly in response to LHS in K562 cells, it would be a result worth investigating in the future.
Post-translational modifications (PTMs) are a faster mechanism than chromatin conformation reacting to environmental stress, and most of the studies on the mechanism of HS have focused on protein PTM. For example, HS causes proteotoxic stress and can affect cell cycle at different phases (Kühl and Rensing 2000). The phosphorylation of checkpoint kinase CHEK2 and the expression of TP53 were reported to cause G1 arrest (Nitta et al. 1997). M phase is a main target of HS (Giordano et al. 2020), and abnormal formation of the mitotic spindle may be a major cause of arrest in the mitotic progressing (Vidair et al. 1993; Vertii et al. 2015), for example, via HSP105-dependent activation of the spindle assembly checkpoint (Kakihana et al. 2019). Recently, accumulated evidence has shown that PTM may be a major player in regulating liquid–liquid phase separation (LLPS) (Hofweber and Dormann 2019), which is sensitive to temperature changes. Thus, whether or not the higher-level chromatin architectures beyond the capacity of 3C-based assays could be altered by the reformation of intra-nuclear LLPS droplets remains a large unanswered question.
Stable chromatin structure raises an interesting question in relation to the mechanism of gene repression in response to HS. At the molecular level, it was reported that RNA polymerase II pause-release is the step at which the gene's response to stress is defined (Vihervaara et al. 2018). The release of paused RNA polymerase II into elongation is inhibited and accumulates at the promoter-proximal pause site of heat-repressed genes in mammals (Vihervaara et al. 2017). In addition, changes in expression are accompanied by changes in chromatin environment, including nucleosome dynamics (Mueller et al. 2017), chromatin sumoylation (Niskanen et al. 2015), and histone acetylation (Vihervaara et al. 2017), and, hence, changes in LLPS states of key regulators or chromatin (Rawat et al. 2021). Accordingly, it would be interesting to see the overall epigenetic dynamics in the HS process, particularly SHS. SHS might more readily respond to environmental stimulation with chromatin loops, which typically react in minutes owing to fast loop extrusion (Rao et al. 2017), compared with global alteration of epigenetic changes, which may react more slowly (Sandholtz et al. 2020).
More time points during the HS process are needed in the future to further clarify the percentage of 3D genome changes resulting from cell cycle redistribution. We measured the cell cycle distribution of K562 cell after 1 h of HS and found that the proportion of M-stage cells elevated from ∼13% in NHS to ∼20% (Supplemental Fig. S11). This result indicates that cell cycle redistribution may have an effect in shorter time points. It also remains unclear if the accumulation of arrested cells in M stage after LHS is an adaption to heat environment or an indication of the middle stages of transition to apoptosis. At least in our FACS inspection, apoptosis was inconsequential (Supplemental Fig. S4). Prolonged heat treatment may be needed to answer this question, and it is also subject to the caution of cell type specificity. Collectively, then, our results reached some consensus on the cellular response to HS and also highlighted the necessity of considering cell cycle in interpreting observed changes of chromatin conformation with mixed Hi-C.
Methods
Cell culture and HS treatment
K562 cells were maintained at 37°C under 5% CO2 in RPMI-1640 medium (Sigma-Aldrich) supplemented with 10% FBS, 2 mM L-glutamate, and streptomycin/penicillin. For SHS, growing cells were placed in a water bath for 30 min at 42°C. For LHS, the cell incubator was adjusted to 42°C one night in advance, and then cells were placed in the incubator for 6 h at 42°C. Cells were brought to 25°C by mixing with one volume of 4°C RPMI-1640 medium and cross-linking immediately.
In situ Hi-C library preparation
In situ Hi-C was conducted according to the literature (Ke et al. 2017). Briefly, K562 cells were cross-linked in 1% formaldehyde solution for 10 min and then quenched with 0.125 M glycine. Then cells were lysed and digested with the MboI restriction enzyme (NEB R0147). Biotin-14-dATP was used to mark the DNA ends, followed by proximity ligation in intact nuclei. After cross-link reversal, samples were sheared to a length of ∼300 bp and then treated with the end repair/dA-tailing module (NEB E7442L) and ligation module (NEB E7445L), following the manufacturer's instructions. Then biotin-labeled fragments were pulled down using Dynabeads MyOne streptavidin C1 beads (Invitrogen 65602). Finally, the Hi-C library was amplified for about 10 cycles of PCR with the Q5 master mix (NEB M0492L), following the manufacturer's instructions. Size selection was performed with AMPure XP beads, quantified, and sequenced on an Illumina HiSeq X Ten instrument with 2 × 150-bp reads.
ATAC-seq library preparation
ATAC-seq was performed as previously described with a few modifications (Corces et al. 2017). Briefly, approximately 50,000 fresh cells were resuspended in 50 μL of ATAC-seq resuspension buffer (RSB; 10 mM Tris-HCl at pH 7.4, 10 mM NaCl, and 3 mM MgCl2) containing 0.1% NP-40, 0.1% Tween-20, and 0.01% digitonin and incubated for 3 min on ice. After lysis, 1 mL of ATAC-seq RSB containing 0.1% Tween-20 (without NP-40 or digitonin) was used to wash the nuclei. The nuclei were washed and resuspended in 50 μL of transposition mix (10 μL 5 × TTBL, 5 μL TTE Mix V50, and 35 μL water) and mixed by pipetting up and down 20 times (Vazyme TD501). Then the transposition reactions were incubated for 30 min at 37°C in a thermomixer. After “tagmentation,” the sample was purified using Ampure XP beads. The ATAC-seq library was amplified for 11 cycles of PCR with TAE mix (Vazyme TD501), following the manual instructions. The amplified DNA was purified with size selection, quantified, and sequenced on an Illumina sequencing platform.
Cell cycle analysis
Two million cells were collected and cross-linked by 1% formaldehyde solution. Then samples were washed, resuspended with 500 μL PBS containing 2% FBS, and permeabilized with 0.1% Triton X-100 for 20 min. Then 30 μL 1 mg/mL propidium iodide (PI) solution and 4 μL 10 mg/mL RNase A were added to the samples. After incubation for 30 min at 37°C, cells were analyzed by flow cytometry.
DAPI nuclear staining
About 50,000 cells were fixed with 1% formaldehyde and permeabilized with 0.1% Triton X-100. Then nuclear counterstaining was performed with DAPI for 5 min at RT. The coverslips were then mounted onto glass slides and sealed with nail polish. Images were acquired with an upright fluorescence microscope (DM5000) with a 100× objective.
Preprocessing and quality control of sequencing reads
The quality of all libraries was assessed using FastQC (http://www.bioinformatics.babraham.ac.uk/projects/fastqc/). Reads with a mean quality score less than or equal to 30 were removed. For the Hi-C libraries, the 5′-most 15 bp of both read 1 and 2 was clipped out because of their low complexity. Adapters were removed by cutadapt (Martin 2011), and fragments with length ≤30 bp were removed.
ATAC-seq data processing
All ATAC-seq reads were mapped to human reference genome hg19 using Bowtie 2 (Langmead and Salzberg 2012) in very sensitive mode with option –X 2000 to restrict the largest fragment lengths from the mapping (Buenrostro et al. 2013). The uniquely aligned fragments with mapping qualities smaller than five from both sides were filtered out by SAMtools (Li et al. 2009), and duplicates were removed by MarkDuplicates in Picard (https://broadinstitute.github.io/picard/). Signal tracks were built using the bdgcmp subcommand of MACS2 with the fold enrichment over control (FE) mode without any control provided (Zhang et al. 2008).
Accessibility for any given region was measured by the number of short fragments (with insertion lengths ≤ 101 bp) with alignment overlapping by ≥1 bp. Differential analysis using DESeq2 (Love et al. 2014) was performed to measure the significance of the accessibility changes.
MACS2 peaks were called using the callpeak subcommand of the MACS2 package (Zhang et al. 2008) with the following parameter combination: “callpeak -f BAM -n MACS2 -g hs -q 0.01 ‐‐nomodel ‐‐shift -100 ‐‐extsize 200 ‐‐keep-dup all.” Peaks were first called in individual replicates. Then reads from different replicates were merged, and another round of peak calling was performed. Repeated peaks were then taken as those called from the merged reads that overlapped with one of those called in each replicate. The NFR regions were directly called from the merged reads in all replicates using the default configuration of the deNOPA program (Xu et al. 2022). Annotations of the regions (peaks or NFRs) were performed using the ChIPseeker package (Yu et al. 2015) against the RefSeq protein-coding genes. The promoters were taken as the interval between the 2 kb upstream of and 500 bp downstream from the TSSs.
The similarity for any pair of region sets (peaks or NFRs, denoted as A and B) was defined as  , where |*| denoted the number of regions in the set, and
  meant regions in the two sets with an intersection size >50% of the two.
Hi-C data processing
Hi-C reads were processed using the HiC-Pro pipeline (Servant et al. 2015) with genome assembly hg19. This genome assembly was used to keep in line with the transcriptome data (Vihervaara et al. 2017). The conclusions in this study were not affected by the choice of specific genome assembly as contact maps and replication scores were very similar when aligned to hg19 or GRCh38 genome (e.g., see Supplemental Fig. S12). Contact reads mapping to Chr Y and Chr M or with MAPQ = 0 were filtered out. The p(s)-curves were calculated from genome distances of 20 kb to 50 Mb separated into 500 bins logarithmically. Contacts were then converted into the HIC format used for Juicer tools (Durand et al. 2016).
An A/B compartment profile was called by analyzing the first eigenvector of the KR normalized contact maps at 100-kb resolution (Lieberman-Aiden et al. 2009). The compartment with the higher H3K27ac ChIP-seq signals was defined as compartment A.
TADs were called using deDoc at 10-kb resolution with default configuration (Li et al. 2018). This tool was chosen for libraries in this study with limited sequencing depths. Although it was more sensitive to higher-level TADs, the TADs and boundaries it called were of high accuracy (Supplemental Material; Supplemental Fig. S13). IS profiles were calculated using bandwidth of 500 kb and a step size of 10 kb.
Loops in this paper were defined as the bin pairs that have significantly higher-than-expected Hi-C contact frequency at the resolution of 10 kb and were called using the “hiccups” subcommand of Juicer tools (Durand et al. 2016) with the following parameter combination: “-m 2048 -r 10000 -k KR -f 0.01.” Given the 10-kb resolution, we only analyzed loops >200 kb as the shorter loops would be severely affected by the strong neighboring interactions. Aggregated peak analysis was conducted using the apa subcommand of Juicer tools in 10-kb resolution with the following parameter combination: “-n 20 -w 10 -r 10000 -k KR –u.” Loop differential analyses were conducted based on the called loops using the hiccupsdiff subcommand of Juicer tools with the default configuration.
The similarity between any TAD boundary sets, B1 and B2, was defined as the proportion of the boundaries in B1 with distance to the nearest one in B2 <20 kb. Two loops were considered the same if and only if the positions of their anchors were exactly the same.
The z-score of a loop was calculated as follows. Suppose the contact matrix was denoted as {ci,j}. Then for a loop linking bins i and j, the z-score was defined as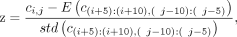 where E and std stand for the mean and standard deviation, respectively.
Briefly, deconvolution was conducted as follows. The contact maps of each chromosome were normalized by matrix balancing (Imakaev et al. 2012). The normalized contact maps were then converted into the distance matrices following the description of Sheskin (1995). A linear model was built using the distances at G1/S and G2/M stages as independent variables and of mixed cells as a dependent variable for each chromosome, and the normalized regression coefficients were then reported as the cellular proportions.
Data access
All raw and processed sequencing data generated in this study have been submitted to the Genome Sequence Archive in the National Genomics Data Center (Wang et al. 2017), Beijing Institute of Genomics (BIG), Chinese Academy of Sciences (https://ngdc.cncb.ac.cn/) under accession numbers CRA001889, CRA001891, and HRA001637.
Competing interest statement
The authors declare no competing interests.
Acknowledgments
We thank all members of the Zhihua Zhang laboratory for providing helpful advice and support for this project. We thank Mr. David Martin for English language editorial services and Ziyang An for help with the figures. This work was supported by Beijing Natural Science Foundation (Z200021); the Strategic Priority Research Program of the Chinese Academy of Sciences, China (XDA24020307); Special Investigation on Science and Technology Basic Resources of the MOST, China (2019FY100102); the National Key R&D Program of China (2018YFC2000400); the National Nature Science Foundation of China (31671342, 31871331, 91940304); and the Beijing Advanced Discipline Fund (115200S001).
Author contributions: B.X., X.G., F.L., and Z.Z. conceived this project. X.G., X.L., and Y.J. performed the experiments. B.X., X.G., F.L., and Z.Z. analyzed data. B.X., X.G., F.L., and Z.Z. prepared the manuscript. All authors read and approved the final manuscript.
Footnotes
-
[Supplemental material is available for this article.]
-
Article published online before print. Article, supplemental material, and publication date are at https://www.genome.org/cgi/doi/10.1101/gr.276554.122.
- Received January 5, 2022.
- Accepted June 13, 2022.
This article is distributed exclusively by Cold Spring Harbor Laboratory Press for the first six months after the full-issue publication date (see https://genome.cshlp.org/site/misc/terms.xhtml). After six months, it is available under a Creative Commons License (Attribution-NonCommercial 4.0 International), as described at http://creativecommons.org/licenses/by-nc/4.0/.


