
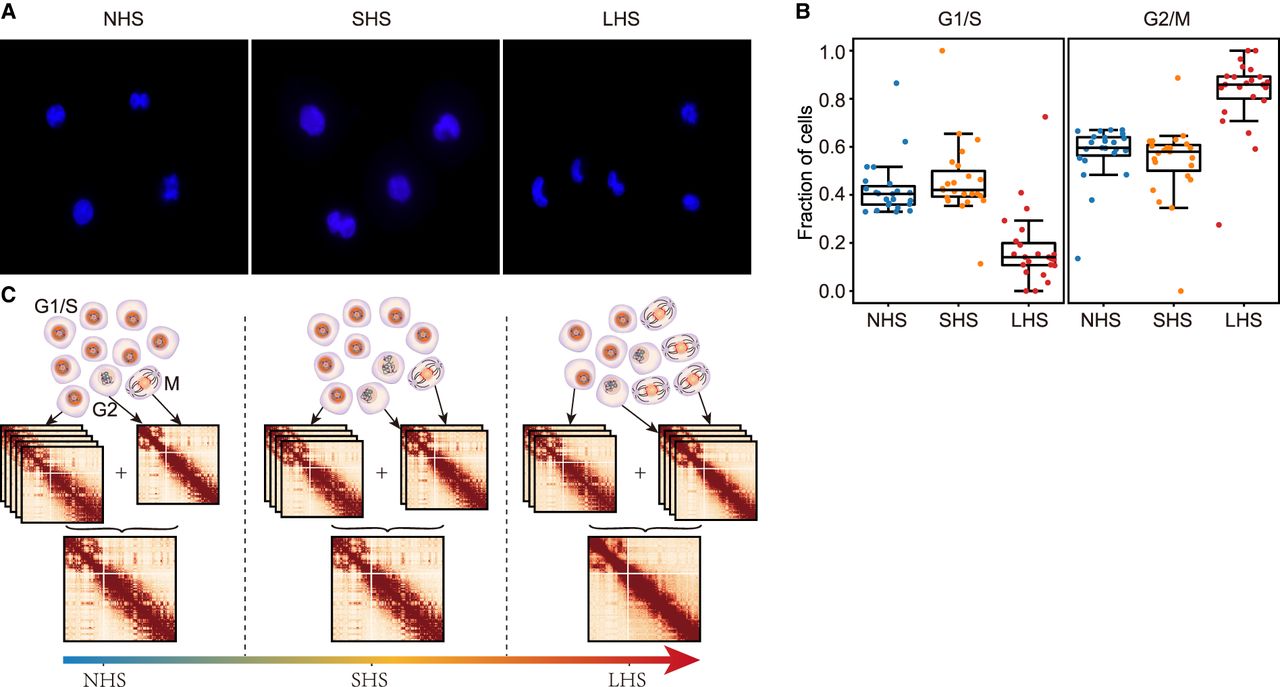
Figure 5.
Cell cycle redistribution after LHS contributes to observed Hi-C contact map changes. (A) Representative images showing cell cycle phase in sorted G2/M cells for the three conditions. (B) Estimated cell fractions of G1/S- and G2/M-phase cells in mixed cells before and after HS calculated from different chromosomes. (C) Schematic diagram shows the main discoveries of our study.


