
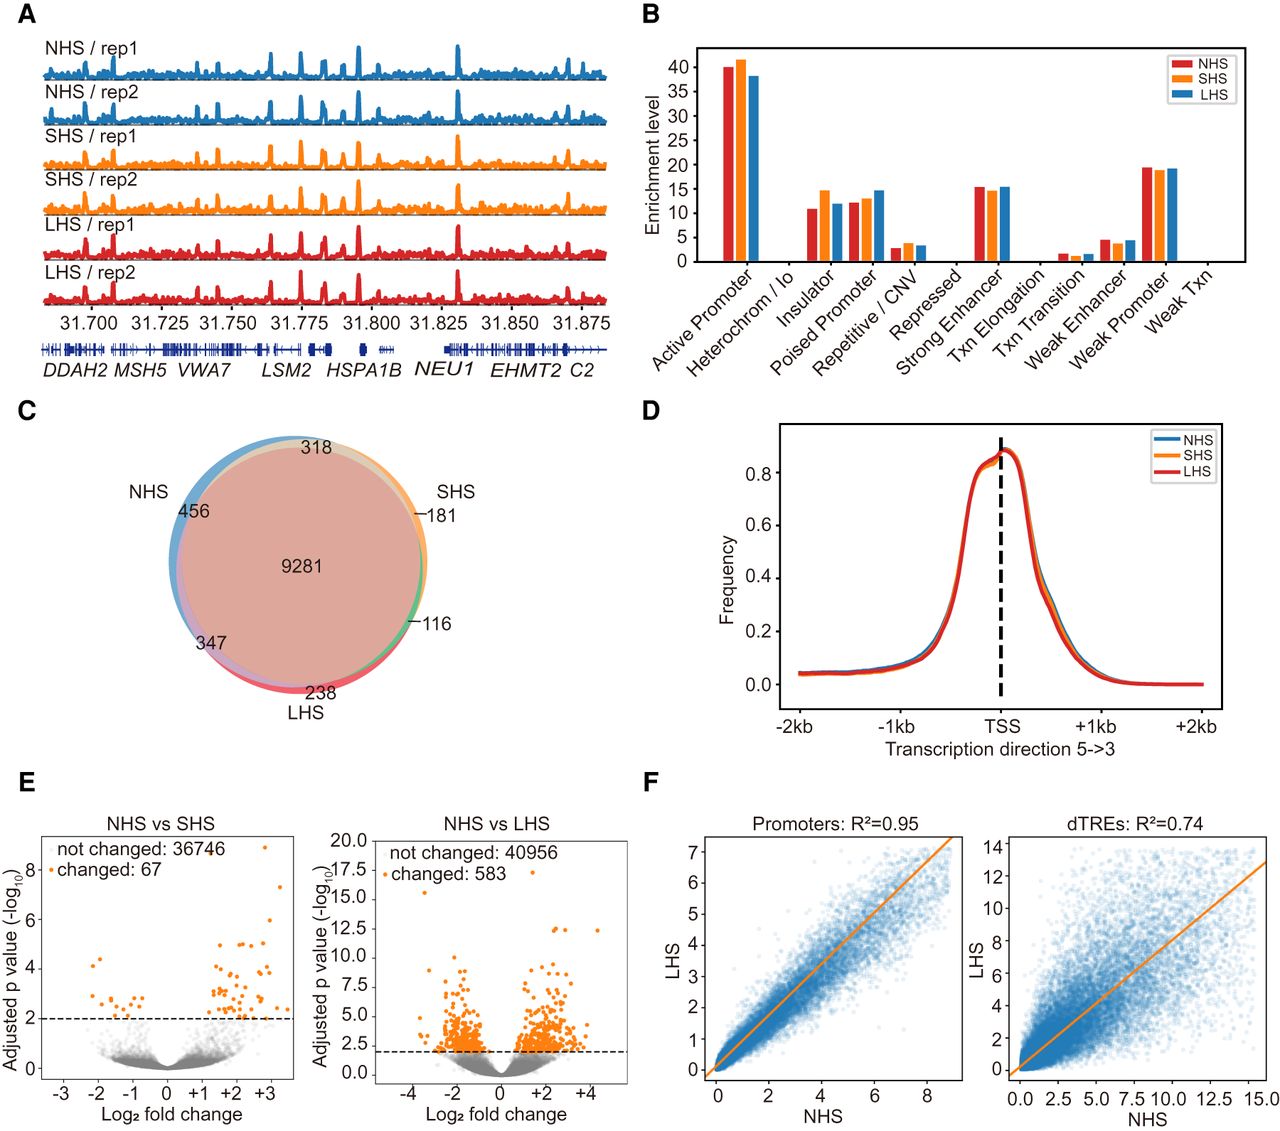
Local chromatin environments remains stable during the whole process of HS. (A) ATAC-seq signal profiles (observed/expected calculated by MACS2) of the biological replicates at the NHS, SHS, and LHS conditions. The 200-kb region centered at the TSS of HSPA1B gene is shown. Only a part of gene symbols is listed owing to the limited space. (B) Distribution of ATAC-seq peaks over genome elements in the three conditions. (C) Numbers and overlaps of accessible genes (TSSs covered by NFRs) in the three conditions. (D) Distributions of NFRs around TSSs of accessible genes. (E) Volcano plot showing the results of the differential accessibility analysis in NFRs before and after HS. Accessibility was measured by the coverage depth of short ATAC-seq fragments. (F) Comparisons of accessibility levels of promoters and dTREs before (NHS) and after LHS. The lines mark the regression fits.


