
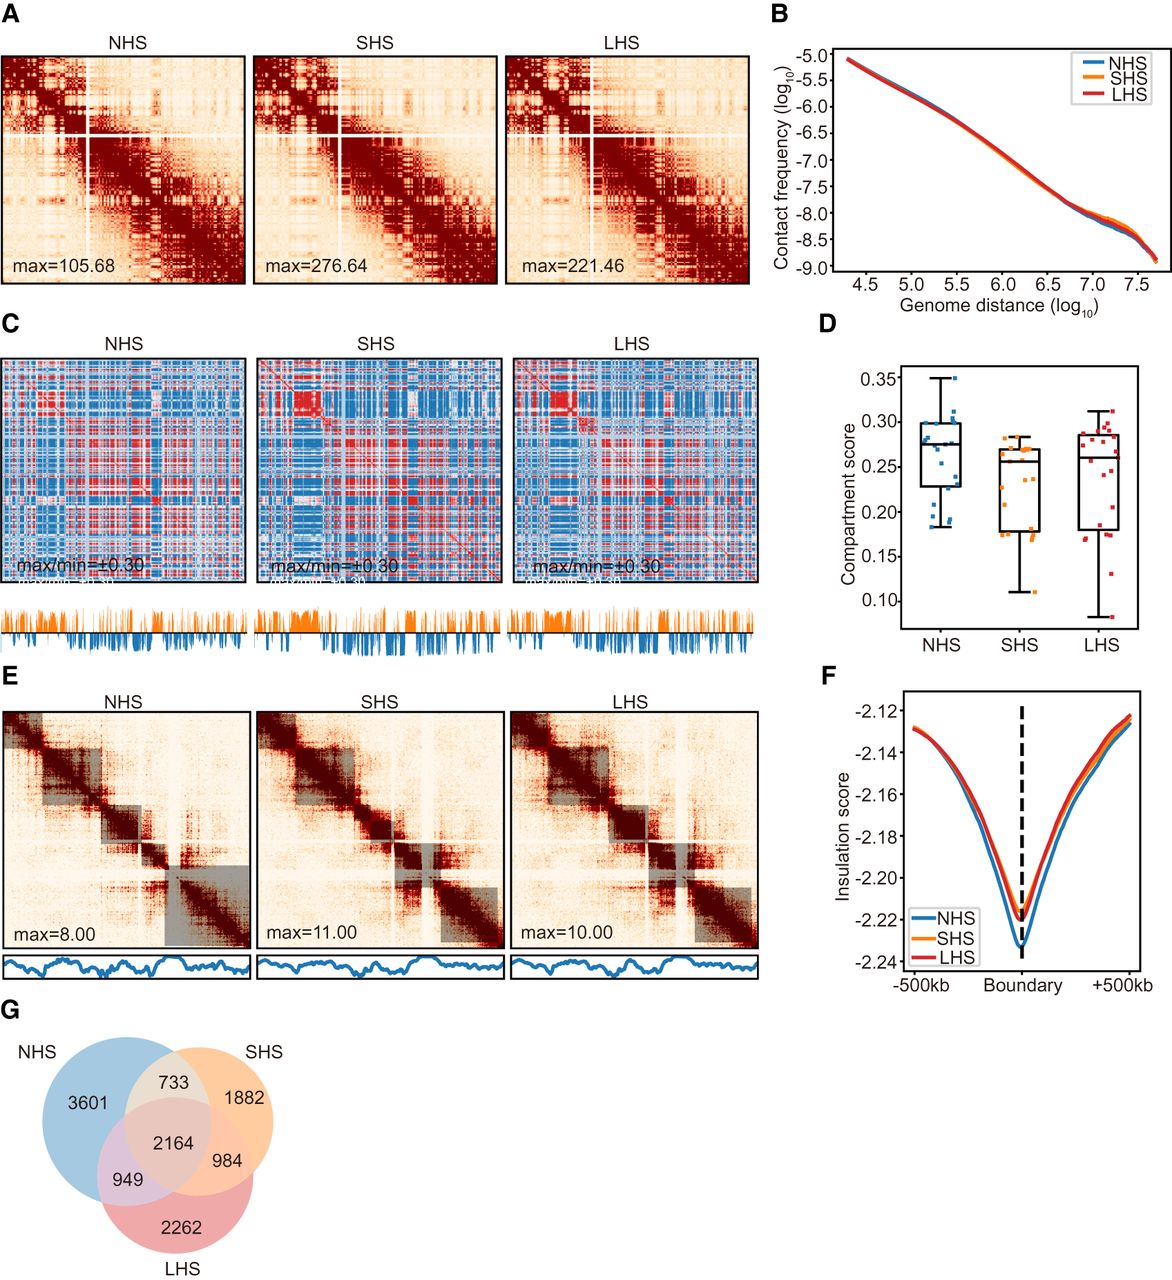
Chromatin conformation in G1/S cells remains largely intact after LHS. (A) An example showing the contact maps of G1/S-phase cells in the process of HS; Chr 6 is shown with 500-kb resolution as in Figure 1A. (B) The contact frequency decay curves at the three conditions in G1/S-phase cells. (C) Chromatin compartmentalization at the three conditions in G1/S-phase cells. Chr 6 is shown as an example as in Figure 1C. The autocorrelation matrices, together with the first eigenvector profiles, are shown. (D) The chromosome-wise compartment scores at each condition in the G1/S-phase cells. (E) TADs detected in the same region as that shown in Figure 1E with G1/S cells, together with the corresponding contact maps and the insulation score profiles, are also shown. (F) Genome-wide insulation score profiles of G1/S cells around TAD boundaries at the three conditions. (G) Numbers and proportions of overlap of chromatin loops at the three conditions for G1/S cells.


