
A full-proteome, interaction-specific characterization of mutational hotspots across human cancers
- Siwei Chen1,2,3,5,
- Yuan Liu1,2,
- Yingying Zhang1,2,3,
- Shayne D. Wierbowski1,2,
- Steven M. Lipkin4,
- Xiaomu Wei1,4 and
- Haiyuan Yu1,2
- 1Department of Computational Biology, Cornell University, Ithaca, New York 14853, USA;
- 2Weill Institute for Cell and Molecular Biology, Cornell University, Ithaca, New York 14853, USA;
- 3Department of Molecular Biology and Genetics, Cornell University, Ithaca, New York 14853, USA;
- 4Department of Medicine, Weill Cornell Medicine, New York, New York 10021, USA
Abstract
Rapid accumulation of cancer genomic data has led to the identification of an increasing number of mutational hotspots with uncharacterized significance. Here we present a biologically informed computational framework that characterizes the functional relevance of all 1107 published mutational hotspots identified in approximately 25,000 tumor samples across 41 cancer types in the context of a human 3D interactome network, in which the interface of each interaction is mapped at residue resolution. Hotspots reside in network hub proteins and are enriched on protein interaction interfaces, suggesting that alteration of specific protein–protein interactions is critical for the oncogenicity of many hotspot mutations. Our framework enables, for the first time, systematic identification of specific protein interactions affected by hotspot mutations at the full proteome scale. Furthermore, by constructing a hotspot-affected network that connects all hotspot-affected interactions throughout the whole-human interactome, we uncover genome-wide relationships among hotspots and implicate novel cancer proteins that do not harbor hotspot mutations themselves. Moreover, applying our network-based framework to specific cancer types identifies clinically significant hotspots that can be used for prognosis and therapy targets. Overall, we show that our framework bridges the gap between the statistical significance of mutational hotspots and their biological and clinical significance in human cancers.
Through DNA sequencing of tumor mutations, precision oncology has enabled the identification of cancer drivers, therapy targets, and prognostic mutations that can guide individualized therapies for many cancer patients. For example, what was once defined as melanoma is now delineated as BRAF-positive or BRAF-negative melanoma, a meaningful distinction with respect to therapy with BRAF and MAPK pathway inhibitors. Similarly, whether a tumor has deficient DNA mismatch repair defines whether the patient is eligible for immune checkpoint inhibitor monoclonal antibody therapy. Precision medicine now has become part of mainstream oncology, and in 2019, >80% of oncology drugs in development are personalized medicines (Personalized Medicine Coalition 2019). However, an important current limitation to precision medicine is the overwhelming number of total somatic mutations that accumulate during tumorigenesis and progression. A significant challenge is distinguishing bona fide driver mutations that promote tumor growth from passenger mutations that are neutral and have no mechanistic impact. To date, international efforts in cancer genomics have provided whole-exome sequencing for tens of thousands of human cancers (Forbes et al. 2008; The International Cancer Genome et al. 2010; The Cancer Genome Atlas Research et al. 2013). Subsequent computational analyses have identified cancer driver genes in which mutations occur more frequently than expected (Futreal et al. 2004; Ding et al. 2008; Chapman et al. 2011; Morin et al. 2011; Stransky et al. 2011; Wang et al. 2011; Lawrence et al. 2013). Yet not all mutations on driver genes are driver mutations. This is usually interpreted as the driver–passenger paradigm, in which the few recurrent mutations are viewed as drivers, whereas most mutations, especially rare ones, are passengers that do not contribute to oncogenesis (Stratton et al. 2009; Porta-Pardo et al. 2017). In this regard, statistical models were developed to detect mutational hotspots (highly recurrently mutated residues across tumor samples) as candidate drivers. Such candidate list was quickly populated by more than 1000 hotspots (Chang et al. 2016, 2018), but only a small number of them have well-defined functional consequences. It was recently reported that some hotspot mutations are in fact passengers that arose from the preference of APOBEC3A, a cytidine deaminase, for DNA stem-loops (Buisson et al. 2019). Thus, given the increasing number of cancer hotspots with uncertain significance, there is an urgent need to characterize their functional relevance toward translating the wealth of genomic data into biological and clinical insights.
Although it is now possible to systematically test certain mutations by experiments (Ipe et al. 2017), genome-wide prioritization of candidate driver mutations still involves bioinformatics tools that predict the impact of mutations on protein function at the individual protein level (Adzhubei et al. 2010; Pollard et al. 2010; Kircher et al. 2014). However, not all mutations can be simply interpreted as causing a gross loss of protein. Many cancer mutations exert their oncogenic effects through altering specific aspects of protein activity and give cancer cells a selective advantage. One promising route to decipher this complexity is the view that the cell is a network of interacting biomolecules in which proteins carry out diverse functions by interacting with other proteins. We have previously shown that one key feature in understanding the functional impact of mutations is whether they fall in the binding interfaces that mediate interactions with other proteins and, critically, which specific interactions they mediate (Wang et al. 2012; Chen et al. 2018). Although studies of known disease mutations have already reported a strong association with protein interaction interfaces (Wei et al. 2014; Sahni et al. 2015), application of this feature has been largely limited by low coverage of structural information on interacting proteins; cocrystal structures and homology models together cover merely ∼6% of all known human interactions (Meyer et al. 2018). Here we leverage our newly established, the first human full-proteome 3D interactome with residue-resolution interface predictions (Interactome INSIDER) (Meyer et al. 2018) to systematically identify protein–protein interactions that are affected by mutational hotspots, aiming to offer a biologically informed framework that characterizes the functional relevance of mutational hotspots and nominate new cancer proteins across human cancers, with interaction-specific resolution at the full proteome scale.
Results
Many hotspot mutations function through affecting specific protein–protein interactions
By mapping mutational hotspots to our 3D interactome network, we analyzed their impact not only at the individual protein level, as traditionally has been performed, but extended beyond and interrogated their network properties to evaluate their oncogenic potential by how they may affect protein interactions (Fig. 1A). A unique advantage of our approach lies in its capacity to dissect specific interactions each hotspot affects while leaving others unchanged. This is particularly advantageous for studying cancer hotspots because the vast majority (84%) of them are missense mutations (Methods; Fig. 1B; Chang et al. 2016, 2018), which are intrinsically more likely to induce interaction-specific perturbations (Zhong et al. 2009). We previously reported that inherited in-frame disease mutations are enriched on protein interaction interfaces and that alteration of specific protein interactions is critical in the pathogenesis of many disease genes (Wang et al. 2012). We and others have also shown, through high-throughput experiments, that disease missense mutations located on protein interaction interfaces are significantly more likely to affect corresponding interactions than those away from interfaces (Methods; Fig. 1C; Wei et al. 2014; Sahni et al. 2015). Consistently, analyzing our recent screen of population missense variants across more than 3000 protein interactions (Fragoza et al. 2019) resembled this trend (Methods; Fig. 1C). These results from independent studies suggest that interface information can be an effective predictor in determining the impact of mutations on protein–protein interactions. Moreover, on the interfaces, known disease mutations showed a much higher rate to affect protein interactions than population variants (8.1-fold) (Fig. 1C), which further underscores the importance of interface information in characterizing the functional relevance of mutations in human diseases.
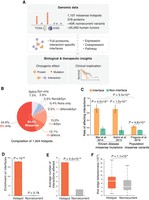
Proteome-wide structural analysis of mutational hotspots. (A) Data resource of mutational hotspots and workflow of our full-proteome interaction-specific characterization framework. (B) Composition of mutational hotspots collected in this study. (Mis) Missense, (Nons) nonsense, (Syn) synonymous, (Splice) splice site. (C) Fraction of missense mutations affecting protein interactions from published experiments. The error bars indicate standard error of the fraction. (D) Distribution of hotspots and nonrecurrent variants on proteins with regard to protein interaction interfaces. Enrichment was calculated as the ratio of the observed fraction of hotspots/variants that occur on interaction interfaces over the fraction of interface residues on corresponding proteins (expected fraction). (E) Average number of protein interactions affected by hotspots and nonrecurrent variants. (F) Average edge betweenness of interactions affected by hotspots and nonrecurrent variants.
From the same structural point of view, to explore where somatic hotspots reside with respect to protein interfaces, we mapped 1107 hotspots (Supplemental Table 1) detected from approximately 25,000 tumors onto the human interactome, in which the interface of each interaction is mapped at residue resolution using Interactome INSIDER (Methods; Meyer et al. 2018). We found that these hotspots are highly enriched on protein interfaces: Although interaction interfaces cover 11.0% of the proteins harboring these hotspots, 30.8% of the hotspots fall in interaction interfaces (2.8-fold, P = 5.0 × 10−62 by a two-tailed exact binomial test; Methods) (Fig. 1D). In comparison, when we examined the distribution of approximately 40,000 nonrecurrent somatic variants (presumed to be predominantly passengers) on the same sets of proteins that harbor hotspots, no enrichment was observed (11.0%, 1.0-fold, P = 0.78) (Supplemental Table 1). This sharp contrast indicates that many hotspot mutations exert their functional effects by affecting specific protein–protein interactions and that mutation locating on an interaction interface is an important feature that can be used to identify driver mutations.
Leveraging the partner-specific information in our 3D interactome network, we then investigated which and how many interactions are affected by each hotspot. Modeling the count of interactions per hotspot with a negative binomial model yielded a significantly higher number of interactions affected by hotspots than nonrecurrent variants on the same set of proteins (means: 7.0 vs. 1.3, 5.2-fold, P = 5.5 × 10⁻¹⁸; Methods) (Fig. 1E), suggesting that hotspot mutations preferentially affect “hub interfaces” that involve in a large number of interactions. We further examined the topological positions of these hotspot-affected interactions in the interactome network. Using edge betweenness, in which a higher betweenness value indicates more information follows through the corresponding interaction, we found that hotspot-affected interactions, on average, have a significantly higher betweenness than those affected by nonrecurrent variants (medians: 7.2 × 10⁻⁵ vs. 4.4 × 10⁻⁵, 1.6-fold, P = 1.1 × 10⁻⁹ by a two-tailed Mann–Whitney U test; Methods) (Fig. 1F). Similar distinctions were recapitulated when we compared hotspots with population variants (Supplemental Fig. 1). Overall, hotspot mutations tend to affect key proteins (high degree) and interactions (high betweenness) that are of great importance topologically for the whole-interactome network.
Hotspot-affected interactions help infer molecular mechanisms of oncogenic hotspots
To assess the oncogenic potential of the hotspots on protein interaction interfaces and the corresponding interactions they affect, we first examined how they link to previously identified cancer genes. Intersecting genes harboring interface hotspots with a list of cancer genes curated in Cancer Gene Census (CGC) (Sondka et al. 2018), we found ∼80% (80/96) of them are known cancer genes. This gave 7.4-fold increased odds compared with that of genes harboring noninterface hotspots (82/204, P = 1.2 × 10⁻¹² by a two-tailed Fisher's exact test) (Fig. 2A; Supplemental Table 2). We next examined the interaction partners—proteins that interact with the proteins harboring hotspots—affected by interface hotspots (“hotspot-affected partners”), as well the interaction pairs that involve both interacting proteins (“hotspot-affected pairs”). There was again significant enrichment for both hotspot-affected partners and pairs compared with the unaffected ones (partners: 190/1444 vs. 150/1795, OR = 1.7, P = 1.1 × 10⁻⁵; pairs: 285/2043 vs. 309/3736, OR = 1.8, P = 3.0 × 10⁻¹⁰) (Fig. 2B; Supplemental Table 2). Collectively, these results point to the association of hotspot-affected interactions—involving not only proteins harboring the hotspots but also their affected interaction partners—with cancer.
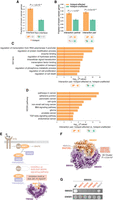
Oncogenic potential of interface hotspots and hotspot-affected interactions. (A) Association of genes harboring interface and noninterface hotspots with previously known cancer genes. (B) Association of hotspot-affected interaction partners and interaction pairs with known cancer genes. An interaction pair was counted when both the gene-carrying hotspot and its interaction partner are known cancer genes. (C,D) Gene set enrichment analysis of hotspot-affected interactions. For each Gene Ontology (GO; C) or KEGG pathway (D) gene set, an interaction pair was counted when both the gene-carrying hotspot and its interaction partner are in the gene set. The red vertical line indicates statistical significance threshold after Bonferroni correction. (E) Implication of hotspot-affected interaction RAF1 S257–[14-3-3] in the oncogenic RAS-RAF-MAPK pathway. A cocrystal structure of RAF1-YWHAZ (PDB ID: 4IHL) highlighting the RAF1 S257 interface hotspot is shown. (F) Cocrystal structure of SMAD4–SMAD3 trimer (PDB ID: 1U7F) highlighting four SMAD4 interface hotspots (red) and one nonrecurrent variant (gray). Number in parentheses indicates the recurrence of corresponding hotspot across tumor samples. (G) Effects of SMAD4 hotspot (red) and nonrecurrent (gray) mutations on SMAD4 interactions tested by a yeast two-hybrid (Y2H) assay.
We further performed gene set enrichment analysis, asking in what biological processes the pairs of proteins affected by hotspots are functioning together, using unaffected protein pairs as the counterpart (Methods). We found that hotspot-affected interactions are frequently involved in processes that have been tightly linked to cancer (e.g., regulation of transcription, intracellular signal transduction, cell proliferation/death) (Fig. 2C), and are enriched in curated sets of cancer-associated pathways (Fig. 2D). Consequently, alteration of these interactions may be critical for the oncogenicity of hotspot mutations on corresponding interfaces. For example, RAF1 is a serine/threonine kinase with an established role in activating the oncogenic RAS-RAF-MAPK pathway (Wellbrock et al. 2004), and its kinase activity can be inhibited by 14-3-3 proteins (Fig. 2E; Dumaz and Marais 2003). Our framework predicted the hotspot RAF1 S257L as an interface residue mediating RAF1's interaction with 14-3-3 proteins. We would then propose RAF1 S257 mutations disrupt RAF1-[14-3-3] interaction, deprive kinase inhibition of RAF1, and thereby potentiate RAS-RAF-MAPK signaling to fuel cancer development. Our postulate is supported by independent experiments that observed that mutant RAF1S257L lost 14-3-3 binding (Light et al. 2002) and was able to induce anchorage-independent cell growth (Imielinski et al. 2014). Therefore, RAF1 S257 mutations are likely to cause oncogenesis through a “gain of cellular function” via a “loss of molecular inhibition” mechanism. This example helps show how identification of specific protein interactions affected by a hotspot can generate mechanistic hypothesis about its oncogenicity.
Recurrence of multiple hotspots affecting the same interaction can lend strong evidence to the oncogenic potential of the interaction and shared molecular basis of the hotspots. For instance, we found the most highly recurrent SMAD4 hotspots R361, D537, G386, and D351 all fall in the trimer interface with SMAD3, and three of them are significantly clustered in 3D space (P = 2.0 × 10⁻⁴ using a bootstrapping method by mutation3D (Fig. 2F; Meyer et al. 2016). We experimentally tested the functional impact of these hotspot mutations, and the results showed that all mutations disrupted SMAD4–SMAD3 interaction (Methods; Fig. 2G). Importantly, these mutations still retained SMAD4's interaction with EWSR1, whose interfaces are unlikely to involve these residues by our interface predictions (Fig. 2G). Thus, the SMAD4 hotspot mutations are likely to function by disrupting specific interaction with SMAD3 rather than causing a loss of the whole protein. We additionally tested a nonrecurrent variant on the SMAD4–SMAD3 interface (H541Y) (Fig. 2F), and we found it disrupted neither of the tested interactions (Fig. 2G). This suggests that although passenger mutations may still randomly occur on the interfaces, they are much less likely to cause perturbations to protein interactions. Therefore, our framework that identifies interactions affected by mutational hotspots is an effective way to dissect functional consequences and molecular mechanisms of candidate driver mutations in cancer.
The proteome-scale hotspot-affected interactome network helps identify novel cancer proteins without hotspot mutations
Given the functional significance and oncogenic potential of hotspot-affected interactions, we constructed a “hotspot-affected interactome network” by connecting all 2083 interactions affected by hotspots at the whole-proteome scale (Fig. 3A; Supplemental Table 2). As a control, the remaining 3736 unaffected interactions of proteins harboring hotspots were built into another network, referred as the hotspot-unaffected network (Fig. 3A). We first examined how known cancer-associated proteins are distributed between these two networks. Overall, there was a 1.2-fold enrichment for cancer proteins in the hotspot-affected network versus the unaffected network (210/1471 vs. 307/2617, P = 0.02 by a two-tailed Z-test). With an increasing network degree (number of interactions associated with a protein), the enrichment became increasingly stronger (Fig. 3B; Supplemental Table 3), suggesting that cancer proteins tend to act as hubs in the hotspot-affected network.
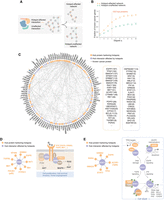
Identification of novel cancer proteins using our hotspot-affected network. (A) Schematic illustration of constructing hotspot-affected and hotspot-unaffected networks. (B) Association of proteins in the hotspot-affected and hotspot-unaffected networks with previously known cancer proteins. (C) A network view of hub proteins prioritized by our hotspot-affected network. Proteins that harbor hotspots are shown in orange, and proteins with no hotspots are shown in purple. Listed proteins are ranked first by whether the protein is a known cancer protein (indicated by asterisk) and then by their degree in the hotspot-affected network (shown in parentheses). (D,E) Implication of the top-ranked hub proteins GRB2 (D) and STAT1 (E) in oncogenesis.
We prioritized 123 hubs (degree ≥ 4) from the hotspot-affected network as candidate cancer proteins (Fig. 3C; Supplemental Table 3). Topping the list are well-known cancer proteins such as epidermal growth factor receptors (EGFR, ERBB2), tumor protein TP53, and the SMAD family of signal transduction proteins. An important feature of our network-based approach, rather than of single-protein level functional predictions, is its ability to discover proteins that do not harbor any hotspots themselves but are frequently targeted by hotspot-affected interactions. These proteins may go unrecognized by other methodologies owing to the lack of recurrent mutations, but we would interpret them as crucial nodes that connect many different hotspots and may serve as a convergence point for their oncogenic effects. Among such hubs, GRB2 ranked as the top novel candidate, which links to nine proteins harboring hotspots (“hotspot-interactors”) (Fig. 3D). Although not being cataloged as a cancer driver gene that contains casual mutations by the CGC (Sondka et al. 2018), GRB2 is well known to link receptor tyrosine kinases (RTKs) with intracellular cancer-associated pathways; up-regulated GRB2 levels have been frequently reported in cancer cell lines (Kapoor 2014). Correspondingly, we found four GRB2 hotspot-interactors are RTKs (EGFR, ERBB2, FGFR2, MET), and two are downstream effectors (PTPN11, PIK3R1) in ERK/AKT pathways (Fig. 3D). Consequently, GRB2 appears as the pivot for these proteins harboring hotspots to launch oncogenic signaling cascades. Although no hotspot mutations have been identified on GRB2, our network-based approach implicates GRB2 as a cancer-associated protein that empowers the oncogenicity of many hotspot mutations on its interacting proteins.
Besides acting as a convergence point, a hub could alternatively mediate diverse oncogenic activities when affected by different hotspots. Signal transducer and activator of transcription (STAT) 1, the second-ranked candidate in our network, represents one such instance. As a signal transducer, STAT1 can mediate TGFB signaling by directly interacting with TGFB receptors (Fig. 3E; Tian et al. 2018). As an activator of transcription, STAT1 regulates a number of genes, either in a form of homo/heterodimer best known in the response to interferons (IFNs) (Ho and Ivashkiv 2006) or by cooperating with other proteins such as TP53 and EGFR in TP53/EGF-induced apoptotic pathways (Fig. 3E; McDermott et al. 2005; Youlyouz-Marfak et al. 2008; Forys et al. 2014; Ali et al. 2018). Although serving as components of different pathways, these interactions all point to STAT1's function in promoting cell death (Fig. 3E; McDermott et al. 2005; Ho and Ivashkiv 2006; Youlyouz-Marfak et al. 2008; Forys et al. 2014). Therefore, our results support a tumor suppressor role for STAT1, and we implicate specific hotspot-affected interactions that may underlie its tumor-suppressive function. Although no STAT1 truncating mutations have been tested directly, STAT1 knockout mice have been shown to spontaneously develop mammary carcinomas (Chan et al. 2012). Together, we expect that as more mutations are uncovered and studied, more nodes and edges will be added to our hotspot-affected network, providing complementary evidence that strengthens previously identified associations and enhances the discovery of new ones.
Cancer-type-specific hotspots affect different interactions in different cancers
In Mendelian disorders, it has been shown that mutations on the same protein can cause distinct diseases through altering different protein interactions (Wang et al. 2012; Sahni et al. 2015). To explore the association of hotspots and hotspot-affected interactions with different cancers, we analyzed the subset of hotspots detected from individual cancer types (Chang et al. 2016). In total, 719 unique cancer-type-specific hotspots were identified, of which ∼30% occurred in more than one cancer type (“multicancer hotspots”) (Fig. 4A; Supplemental Table 4). We first examined how these hotspots distributed in the interactome network and found that multicancer hotspots, compared with single-cancer hotspots, tend to affect more central positions (degree medians: 35 vs. 22.5, fold-change [FC] = 1.6, P = 1.2 × 10⁻⁸ by a two-tailed Mann–Whitney U test) (Fig. 4B). We next determined multicancer interactions, as those affected by either one or more multicancer hotspots or multiple single-cancer hotspots of different cancers (Supplemental Table 4). In line with the centrality of multicancer hotspots, we found multicancer interactions also tend to occupy central positions within the interactome network, as indicated by their high edge betweenness compared with that of single-cancer interactions (medians: 7.5 × 10⁻⁵ vs. 5.9 × 10⁻⁵, FC = 1.3, P = 6.2 × 10⁻⁶) (Fig. 4C). These findings suggest that the multicancer roles of hotspots and hotspot-affected interactions may arise from their network centrality, which allows them to function through a wide range of downstream targets.
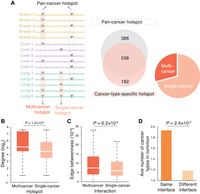
Association of cancer-type-specific hotspots with specific protein interactions. (A) Categorization of pan-cancer versus cancer-type-specific hotspots and multicancer versus single-cancer hotspots. (B) Degree distributions of proteins harboring multicancer and single-cancer hotspots. Degree values are transformed by log2 for presentation purposes. (C) Edge betweenness distributions of multicancer and single-cancer interactions. (D) Average number of cancer types shared between hotspots on the same interface and between hotspots on different interfaces.
We then asked whether hotspots targeting different interaction partners tend to be involved in different cancers. By comparing the number of cancer types shared by hotspots on the same protein, we found a significantly greater number of common cancer types shared by hotspots affecting the same interactions than those affecting different interactions (1.6-fold, P = 3.7 × 10⁻⁴ by a negative binomial model; Methods) (Fig. 4D; Supplemental Table 4). The result indicates that hotspots affecting different interactions, although on the same protein, are likely to be involved in different cancers. This reinforces our notion that alteration of specific protein interactions is critical for the oncogenicity of hotspot mutations. Therefore, linking specific interactions to hotspots of specific cancer types, that is, constructing a cancer-type-specific, hotspot-affected network, would further delineate functional hotspots and interactions and better understand their molecular mechanisms in specific cancers.
Cancer-type-specific hotspot-affected interactome networks prioritize hotspots for cancer prognosis
Many interactions may not happen across all tissues, and consequently, for a particular type of cancer, a hotspot-affected interaction is only meaningful if that interaction happens in the corresponding tissue. Thus, we incorporated tissue-specific gene coexpression data to prioritize hotspot-affected interactions that are likely functional in a particular cancer type. Specifically, for each cancer type, we surveyed the expression patterns of genes encoding hotspot-affected interacting proteins, using RNA-seq data from matched tumor-adjacent normal tissues (Methods). We constructed cancer-type-specific, hotspot-affected interactome networks by considering only hotspot-affected interactions in which both interacting partners are coexpressed in the corresponding tissue, and considered interface hotspots in these networks prioritized for the specific cancer types (Methods; Fig. 5A).
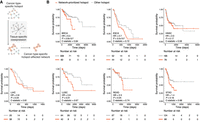
Construction of cancer-type-specific hotspot-affected networks and their prognostic values. (A) Schematic illustration of incorporating tissue-specific coexpression pattern to construct cancer-type-specific hotspot-affected networks. (B) Association of our network-prioritized hotspots with patients’ survival. Survival probabilities and curves were obtained using Kaplan–Meier estimates (red denotes patients harboring network-prioritized hotspot mutations; gray denotes patients harboring other hotspot mutations). Number at risk tables are shown under corresponding Kaplan–Meier plots, indicating the number of subjects at risk immediately before the time point. Hazard ratio (HR), P-value, and C-statistic were calculated using a Cox regression model. (BRCA) Breast invasive carcinoma, (ESCA) esophageal carcinoma, (HNSC) head and neck squamous cell carcinoma, (LIHC) liver hepatocellular carcinoma, (LUSC) lung squamous cell carcinoma, (READ) rectum adenocarcinoma, (STAD) stomach adenocarcinoma. Number of hotspots included in each Kaplan–Meier analysis (Nprioritized and Nother, respectively): BRCA = 18, 66; ESCA = 13, 33; HNSC = 10, 52; LIHC = 8, 11; LUSC = 17, 51; READ = 20, 43; STAD = 20, 59.
To evaluate the utility of our cancer-type-specific hotspot-affected interactome networks, we investigated whether the network-prioritized hotspots can be useful in real clinical practice, such as to help prognostic prediction and/or personalized treatment. In each of the seven cancer types that had sufficient network and expression data, we compared the progression-free survival between patients carrying hotspot mutations, grouping them by whether the hotspot is prioritized by our network or not (Supplemental Table 5). Across all cancer types, patients carrying network-prioritized hotspot mutations, on average, had a shorter survival time than patients carrying other hotspot mutations (based on Kaplan–Meier survival estimates; Methods) (Fig. 5B). To further assess the prognostic power of our network-prioritized hotspots, we fit the network-prioritized hotspot as a predictor for patient's survival time using a Cox regression model (Methods). In line with the Kaplan–Meier estimates, our regression analyses revealed significant negative associations between our network-prioritized hotspot and patient's survival time (hazard ratio [HR] > 1.0, P < 0.05 in 5/7 cancer types) (Fig. 5B). These results suggest that the prioritized hotspots might play a significant role in the development or recurrence of cancer in corresponding patients.
Network-prioritized hotspots and interactions provide clues toward personalized medicine
The prognostic value of our prioritized hotspots raises the possibility that they could provide useful information regarding targeted therapy for patients with particular hotspot mutations. To test this, we surveyed a list of known genetic biomarkers that are being used in current targeted therapy (106 SNV biomarkers compiled from My Cancer Genome [Swanton 2012], with either FDA approvals or clinical practice guidelines; Methods) (Supplemental Table 5). There was a strong enrichment of our network-prioritized hotspots to be known biomarkers (in both cancer-type-specific and pan-cancer settings) (Fig. 6A), including several well-known ones such as ERBB2 (also known as HER2) S310/V659/D769, which are predictive biomarkers for use of ERBB2 inhibitors (Greulich et al. 2012; Swanton 2012; Bose et al. 2013; Chumsri et al. 2015; Ou et al. 2017; Pahuja et al. 2018), PIK3CA C420/E542/E545/Q546 (sensitive to PI3K inhibitors) (Zhang et al. 2008; Swanton 2012; Jung et al. 2018), and ESR1 Y537/D538 (resistant to estrogen inhibitors) (Swanton 2012; Robinson et al. 2013; Toy et al. 2013). Examining these biomarkers within our hotspot-affected network, we found that their predicted drug response can be explained by alteration of specific protein interactions. For example, ERBB2 S310/V659/D769 mutations identified on its dimer interfaces (Fig. 6B) have been frequently implicated in stabilized ERBB2 dimerization that led to an overactivation of the receptors (Greulich et al. 2012; Bose et al. 2013; Chumsri et al. 2015; Ou et al. 2017; Pahuja et al. 2018); consequently, patients carrying these mutations are predicted to be sensitive to ERBB2 inhibitors. Similarly, patients with PIK3CA (also known as p110α) C420/E542/E545/Q546 mutations, which disrupt the inhibitory interaction between PIK3CA and PIK3R1 (also known as p85α), two regulatory subunits of PI3K (Fig. 6C; Miled et al. 2007; Burke et al. 2012), are predicted to respond to PI3K pathway inhibitors.
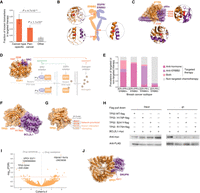
Clinical significance of network-prioritized hotspots in targeted therapy. (A) Association of our network-prioritized hotspots with known genetic biomarkers in targeted therapy. (B) Known biomarkers on the interface of ERBB2 dimers. Interfaces were determined by structural analysis of ERBB2(S310)-ERBB3 (homology model; PDB template: 3N85), ERBB2(V659)-EGFR (cocrystal structure; PDB ID: 2KS1), and ERBB2(D769)-ERBB3 (homology model; PDB template: 4RIX). (C) Known biomarkers on the interface between PIK3CA and PIK3R1 (cocrystal structure; PDB ID: 4OVU). (D) Known resistant biomarkers on the interface between ESR1 and SCR (cocrystal structure; PDB ID: 4MG8). The ESR1 interface mutations render resistant to antiestrogen treatment but are sensitive to SRC inhibitors, especially when coadministered with an ESR1 inhibitor. (E) Prevalence of targeted therapy in different breast cancer subtypes. (F) A cocrystal structure of TP53–BCL2L1 (PDB ID: 2MEJ) highlighting the TP53 H179 and S241 interface hotspots. (G) Cocrystal structure of TP53 (PDB ID: 2H1L) highlighting a 3D cluster formed by our network-prioritized hotspots (red) and known interaction-disrupting mutation residues (orange). (H) Coimmunoprecipitation validating the disruptive effects of our network-prioritized hotspot mutations TP53 H179P and S241Y, along with a previously reported oncogenic mutation R175H in 3D proximity, on the TP53–BCL2L1 interaction in HEK 293T cells. (I) Drug responses of cancer cell lines harboring network-prioritized hotspots. Known therapeutic biomarkers were excluded from the analysis toward identifying potentially novel targets. Each point denotes a specific hotspot-drug pair, for which the difference in drug response was evaluated by an analysis of variance (ANOVA) model. P-values were corrected by the Benjamini–Hochberg method (with red dashed line indicating a false-discovery rate [FDR] of 0.1). Effect sizes were quantified using a Cohen's d statistic. (J) Cocrystal structure of XPO1–SNUPN interaction (PDB ID: 5DIS) highlighting a prioritized interface hotspot XPO1 E571 that presented significant drug sensitivity.
The estrogen receptor (ER) hotspots ESR1 Y537/D538, on the other hand, represent another category in which the presence of these biomarkers predicts resistance to antiestrogen treatments (Swanton 2012; Robinson et al. 2013; Toy et al. 2013; Jeselsohn et al. 2015). The resistance has been largely attributed to a constitutive, estrogen ligand-independent binding between the ESR1 mutant and its transcriptional coactivators (Jeselsohn et al. 2015; Fanning et al. 2016); this is also echoed in our hotspot-affected network, in which ESR1 Y537/D538 are linked to steroid receptor coactivators (SRCs) (Fig. 6D). In this case, our data would suggest that instead of targeting the ligand estrogen, directly targeting the receptor ESR1 and/or its interacting SRCs may be a promising therapeutic strategy (Fig. 6D). Indeed, a recent study showed that pan-SRC inhibitors were able to suppress ESR1 mutant-driven transcriptional activation and blocked proliferation of breast cancer cells expressing ESR1 Y537/D538 mutations (Gates et al. 2018). Moreover, suppression of the tumor growth became stronger when SRC inhibitor was coadministered with a selective ER degrader, in a model generated from a patient with hormone-refractory breast cancer (Fig. 6D; Gates et al. 2018). Such synergistic effect of drugs targeting interacting protein pairs highlights the value of identifying specific protein interactions affected by hotspot mutations.
To further show that our network-prioritized hotspots can inform novel/better therapeutic strategies, we investigated the current prevalence of targeted therapy, in comparison to traditional nontargeted chemotherapy. Here we used breast cancer, which has well-recognized therapeutic biomarkers, ER/progesterone receptor (PR) and ERBB2, as a proof-of-principle. We collected clinical information of 509 breast cancer patients whose pharmaceutical therapy history and ERBB2/ER/PR status were available (The Cancer Genome Atlas Research et al. 2013). We found that, as expected, most (80.4%) patients with ER/PR-positive signatures received antihormone therapies, and in ER- and PR-negative but ERBB2-positive cases, most (65.2%) patients were administered with anti-ERBB2 drugs (Fig. 6E). In contrast, however, for patients in triple-negative status, only 12.2% had targeted therapy, and the vast majority underwent traditional nontargeted chemotherapy (Fig. 6E). We then asked whether our network-prioritized hotspots could provide clues to facilitate targeted therapy for these triple-negative patients.
Four triple-negative cases were found within our hotspot-affected network; all of them harbor TP53 hotspot mutations, and three fall on the interaction interface with BCL2L1 (two at H179 and one at S241) (Fig. 6F). The TP53–BCL2L1 interaction is known to promote TP53's apoptotic activity at the mitochondria, where TP53 directly binds to and antagonizes the antiapoptotic protein BCL2L1 (Mihara et al. 2003; Moll et al. 2006; Green and Kroemer 2009; Vaseva and Moll 2009). Although the effects of TP53 H179/S241 mutations on TP53–BCL2L1 have not been tested directly, several alterations in the TP53 surrounding regions have been shown to abrogate its BCL2L1 binding and apoptotic ability in multiple cancer cell lines (Mihara et al. 2003). In particular, the reported interaction-disrupting mutations at R175 and L194 reside in structural proximity with our network-prioritized hotspots H179 and S241 (P = 7.1 × 10⁻⁵ by mutation3D) (Fig. 6G; Meyer et al. 2016), suggesting similar functional effects of these mutations on TP53–BCL2L1 interaction. We validated our predictions by coimmunoprecipitation experiments in human cells, which showed that both mutations on our network-prioritized hotspots (H179P and S241Y) disrupt the interaction, to a similar extent as the known oncogenic mutation R175H (Methods; Fig. 6H). Therefore, it is plausible to speculate that TP53 H179/S241 mutations may contribute to oncogenesis in corresponding patients by disrupting the TP53–BCL2L1 interaction. In this regard, restoration of functional TP53–BCL2L1 interaction appears a rational treatment strategy. A number of TP53-reactivating small molecules have been discovered (for review, see Bykov et al. 2018); many of them were shown to rescue TP53's binding to DNA, whereas the same interface has a dual function in mediating TP53's binding to BCL2L1 (Mihara et al. 2003; Petros et al. 2004). Besides, it was found that exclusive delivery of wild-type TP53 to mitochondria (but not to the nucleus) could induce efficient apoptosis and significant tumor growth suppression in transgenic mice (Palacios and Moll 2006). Collectively, these findings lend evidence to the validity and feasibility of applying TP53-based targeted therapy to the triple-negative cases that harbor TP53–BCL2L1 interface hotspot mutations.
Lastly, we systematically explored the pharmacogenomic landscape of our network-prioritized hotspots. Leveraging drug response profiles of approximately 1000 human cancer cell lines screened with 265 anticancer compounds (Iorio et al. 2016), we identified 108 significant hotspot-drug associations (Methods; Supplemental Table 5). Leading associations were driven by well-known therapeutic biomarkers (e.g., BRAF V600, NRAS Q61), yet ∼50% of the associations were found in hotspots that are potentially novel targets (Fig. 6I). For example, the top association implicating novel drug-sensitivity was found between hotspot XPO1 E671 and an AKT inhibitor (GSK690693). The XPO1 gene encodes a nuclear transporter that exports molecules from the nucleus into the cytoplasm, and many of the cargos are significant players in oncogenesis such as AKT (Iorio et al. 2016). Our network approach identified that the hotspot XPO1 E671 resides on its interaction interface with SNUPN (Fig. 6J), which is known to form a nuclear pore complex with XPO1 and mediate the transport of cargo proteins (Monecke et al. 2009). Therefore, alteration of the XPO1–SNUPN interaction might be a plausible mechanism underlying the oncogenicity of hotspot XPO1 E671, and thus, ATK inhibitors could provide a therapeutic option for patients carrying XPO1 E671 hotspot mutations. Collectively, we show how our hotspot-affected interactome networks could generate mechanistic clues that aid in the design of targeted therapy and personalized medicine.
Although we acknowledge that the path from mechanism to medicine is intricate, we consider our framework a useful way for clinicians to obtain functional information, rather than pure statistical recurrence, of the hotspot mutations. Because high recurrence has been regarded as a hallmark of cancer-driving mutations, it is natural for clinicians and researchers to prioritize hotspots by their degree of recurrence. To interrogate the value of our network-based prioritization in providing new, independent information, we divided the hotspots into two groups by their statistical ranking—highly recurrent hotspots (upper 50%) and the relatively mild ones (lower 50%)—and repeated all analyses separately within each group. We found all results remained the same: Both upper- and lower-ranked hotspots are enriched on protein interfaces, and hotspots prioritized from both groups are closely associated with cancer (Supplemental Fig. 2). This clearly shows that our network-based framework offers orthogonal information independent of the hotspot recurrence. In fact, recurrence by itself is not informative enough to distinguish clinically relevant hotspots; highly recurrent hotspots were not predictive for patient's survival outcome (Supplemental Fig. 3). Together, we suggest that one key feature to understand the functional relevance of cancer hotspots is how they may alter specific protein–protein interactions. Our network-based approach presents a biologically informed framework that identifies hotspot-affected interactions at the full-proteome scale and yields mechanistic hypothesis that can be used to guide downstream functional studies and clinical interpretations.
Discussion
Cancer driver mutations are frequently nominated based on their recurrence rate in different cancers. However, because there are many additional factors that affect mutation rates (Buisson et al. 2019; Seton-Rogers 2019), not all hotspot mutations are cancer drivers. Here we showed that many cancer hotspot mutations function through affecting specific protein–protein interactions and that our full-proteome, interaction-specific 3D interactome network framework can effectively identify functional hotspots and hotspot-affected interactions. Because experimental examination of hotspots is limited in scale and current bioinformatics tools hardly interpret oncogenicity, our framework makes significant contributions in systematically prioritizing and mechanistically characterizing hotspots in human cancers. Our results revealed that hotspots and hotspot-affected interactions preferentially occupy central positions in the interactome network and frequently target previously known cancer proteins and pathways. Although we suggested that identifying specific interactions affected by a hotspot can already help understand its oncogenicity, instead of analyzing each hotspot individually as is commonly performed in cancer driver mutation prediction (Carter et al. 2009; Li et al. 2010; Mao et al. 2013; Shihab et al. 2013), we further connected the effects of all hotspots to construct a hotspot-affected interactome network at the full proteome scale. Such network has not been possible to construct in any previous studies because interactome-based approaches suffered from either low coverage (i.e., focusing on only interactions with cocrystal structures) (Engin et al. 2015, 2016; Porta-Pardo et al. 2015; Rodrigues et al. 2019) or low resolution (i.e., examining [sub-]network properties at the protein level, not the residue level) (Guda et al. 2009; Chen et al. 2016; Li et al. 2016; Zhang and Zhang 2017). We show utilities of our innovative hotspot-affected interactome network in uncovering novel relationships among different hotspots, generating hypotheses of how hotspot mutations function at the molecular level, and identifying novel oncogenic proteins that do not harbor hotspot mutations themselves. Therefore, although our analyses started with approximately 1000 published hotspots, our framework expanded the scope of existing data sets and can be readily applied as more cancer mutations are identified. Finally, by complementing the hotspot-affected interactome network with tissue-specific transcriptomes, we showed the clinical utilities of applying our framework in specific cancer types toward improving prognosis and targeted therapy.
We emphasize the virtue of connecting hotspot-affected interactions into a network as the topological properties are indicative of hotspot oncogenicity, which cannot be assessed when viewing these interactions as independent pairs. We note that the hub–oncogenicity association is only meaningful in the hotspot-affected network but not in the unaffected network because only interactions in the affected network are considered functionally relevant in the specific context of cancer. The affected hub GRB2 (degree = 9), for example, even though it has more interaction partners in the unaffected network (degree = 18), fewer of them are associated with cancer (11/18 = 61% in CGC, compared with that in the affected network, 8/9 = 89%). More generally, across the nearly 750 proteins shared by the two networks, there is a significantly higher rate for interaction partners in the affected network to be known cancer genes than those in the unaffected network (means: 87% vs. 58%, P < 10−20 using a Wilcoxon signed-rank test) (Supplemental Fig. 4). Moreover, when studying the unaffected network in the same fashion to prioritize hotspots, we found no clinical significance in these hotspots for cancer prognosis (Supplemental Fig. 5). These results reinforce the value of protein interaction interface and network information in interpreting the oncogenicity of cancer hotspots.
One unique strength of our framework resides in its full-proteome scale prediction of interfaces for interactions with no cocrystal structures or homology models available. Although we emphasize the scalability of our framework, we ensure the reliability of our findings by repeating all analyses using only protein interfaces resolved from cocrystal structures and homology models. All results agreed well with those calculated from full interface data, although with reduced statistical significance owing to limited sample size (Supplemental Fig. 6). These results not only confirm the validity of our findings in this study but also underscore the effectiveness of our full-proteome framework in characterizing mutational hotspots. Moreover, we recognize that the current human interactome may be subject to sampling bias from small-scale studies (Das and Yu 2012; Rolland et al. 2014) in which certain proteins (e.g., TP53) may have been studied intensively against a great number of interactors. Thus, we re-examined the network properties of hotspots and hotspot-affected interactions using only high-throughput-derived human interactions (Das and Yu 2012), and our results on network centralities remain unchanged (Supplemental Fig. 7). This further confirms the importance of using network properties to interpret the functional significance of hotspots in cancer.
Our analyses suggest that identifying specific interaction partners affected by hotspots provides important clues about their oncogenicity. Meanwhile, we recognize that some interaction partners mapped from the global interactome may not be functional under specific tumor context. To address this issue, we investigated the expression status of partner genes for each hotspot in tumors that carry that hotspot. Overall, ∼90% of the affected partners are expressed in at least 80% of the corresponding carriers, giving a moderate but significant higher rate than that of unaffected partners (Methods) (Supplemental Fig. 8A). Although expression data are limited in coverage across multiple sequencing projects, we reanalyzed the subset of hotspot-affected interactions in which the partner genes are expressed (Methods). We show that all results on hotspot-affected interactions hold steadily (Supplemental Fig. 8B–G), suggesting that our analyses on the full interaction data are unlikely prone to severe context-biased expression of partner genes. We expect that as more complete and unified expression profiles of tumors became available, integrating traditional gene expression analyses with our novel protein-interaction-level features will further promote the mechanistic understanding of oncogenic hotspots.
Although the widespread adoption of whole-exome sequencing and computational tools in cancer genomics has brought us to a nearly complete catalogue of cancer driver genes (Porta-Pardo et al. 2020), one of the most pressing questions remaining is which mutations on these genes are driver mutations, as personalized treatment hinges on its answer. Our framework, in light of its residue-resolution characterization of protein interfaces, then stands a superior approach to the prevalent gene-level statistical models. We showed that hotspots prioritized by our framework are enriched for known therapeutic SNV biomarkers, while excluding these known ones from our prioritized hotspots continued to show prognostic signals (Supplemental Fig. 9). Another remaining challenge in completing the identification of potentially targetable hotspots is the small sample size of rare cancer types. The number of hotspots detected in a cancer type is largely correlated with the number of tumors sequenced, with fluctuations in cancer types with high mutational load (Supplemental Fig. 10A). Nonetheless, the property of hotspots being enriched on protein interfaces is not dependent on sample size or mutational load (Supplemental Fig. 10A), nor the prognostic significance of network-prioritized hotspots is driven by hypermutations in certain cancer patients (Supplemental Fig. 10B; Methods). Besides, the network centrality of multicancer hotspots is not sensitive to their relative frequencies in different cancer types (Supplemental Fig. 10C–E). Therefore, our network approach presents a scalable and generalizable framework in characterizing hotspots across different cancers and can be readily applied to new hotspots as additional tumor genomic data become available. We anticipate that with a growing network view of the cancer hotspots, more nodes (functional sites) and edges (protein–protein interactions) will be discovered for targeted therapy. The latter, targeting protein–protein interactions, has been a particularly attractive goal in preclinical studies (Lu et al. 2020). Recent research has made substantial progress in identifying oncogenic and potentially targetable protein interactions (Cheng et al. 2021; Zhou et al. 2021), yet the drug design of the medicinal protein–protein interaction has been largely limited by the lack of high-resolution protein interface structures (Lu et al. 2020). As more resources are suggested to put into the structural studies of the implicated protein interactions, we expect more of our interface predictions to be validated and/or improved to further narrow the gap between network medicine and precision medicine.
Taken together, our innovative network-based framework provides an effective way to identify candidate driver hotspots and to dissect the molecular mechanisms underlying their oncogenicity. Our findings would help researchers and clinicians nominate hotspots that can serve as biomarkers for cancer prognosis in individual patients, personalized treatment, and potentially the development of new therapeutics.
Methods
Compilation of cancer hotspots
We compiled published cancer hotspots from two previous studies (Chang et al. 2016, 2018). A cancer hotspot was defined as an amino-acid position on a protein that is frequently mutated (by substitutions) more than expected, which was determined by assessing several mutational processes such as nucleotide context mutability and gene-specific mutation rates (Chang et al. 2016). In total, we compiled 1324 unique mutational hotspots, the vast majority (1112/1324 = 84.0%) of which are composed of a single-amino-acid substitution, that is, missense mutation (Fig. 1B). One thousand one hundred seven missense hotspots that could be mapped to a canonical UniProt sequence were considered for downstream analyses (Supplemental Table 1).
Fraction of missense mutations affecting protein interactions
To show the value of interface information in assessing the effect of missense mutations on protein interactions, we analyzed experimental data from previous interactome perturbation studies for both known disease mutations (Wei et al. 2014; Sahni et al. 2015) and population variants (Fragoza et al. 2019). The data were directly downloaded from the corresponding publications, and it comprises (1) 70 mutation-interaction pairs from Wei et al. (2014), 18 with mutation on the corresponding interface and 52 noninterface; (2) 32 pairs from Sahni et al. (2015), 17 on the interface and 15 noninterface; (3) 3368 pairs from Fragoza et al. (2019), 233 on the interface and 3135 noninterface. Based on their corresponding experimental results, we calculated the rate of missense mutations affecting protein interactions in each independent study, with regard to its interface status: (1) interface,13/18 = 72.2%, and noninterface, 9/52 = 17.3%; (2) interface, 12/17 = 70.6%, and noninterface, 2/15 = 13.3%; (3) interface, 55/233 = 23.6%, and noninterface, 424/3135 = 13.5%. We also compared the rates between interface-known disease mutations and population variants by combining the data from 1 and 2: 25/35 = 71.4% in disease versus 23.6% in population. We evaluated the differential rates of “interface versus noninterface” and “disease versus population” using a two-tailed Fisher's exact test.
Construction of the full-proteome 3D human interactome network
A comprehensive set of 59,073 experimentally resolved binary human protein–protein interactions (curated by HINT [Das and Yu 2012] from eight widely used interaction databases: BioGRID [Chatr-Aryamontri et al. 2015], MINT [Stelzl et al. 2005], iRefWeb [Turner et al. 2010], DIP [Salwinski et al. 2004], IntAct [Hermjakob et al. 2004], HPRD [Keshava Prasad et al. 2009], MIPS [Mewes et al. 2011], and PDB [Berman et al. 2000]) was compiled to generate a high-quality human protein interactome network. For each interaction within the network, we determined the interface residues that mediate the specific interaction using Interactome INSIDER (Meyer et al. 2018), a unified machine-learning framework that predicts partner-specific interfaces at the full-proteome scale.
Enrichment of hotspots and nonrecurrent variants on protein interfaces
For each hotspot or nonrecurrent variant, with each of its interaction partners, we considered it to be on the interface for this specific interaction if it has a probability score of high or very high in Interactome INSIDER prediction. If the locations of hotspots are not influenced by the interface architecture of the protein, then their relative length should determine the frequency of hotspots on interfaces. The fraction of hotspots expected by chance on interfaces was calculated by adding the total sequence length of interface residues in all proteins harboring hotspots and dividing it by the length of all proteins combined; let the probability of falling in an interaction interface be p. Let the number of observed hotspots falling in the interfaces be S, and let N be the total number of hotspots. An exact binomial test was then computed from p, S, and N. CIs were based on the 95% CI for an exact binomial and then transformed to the risk ratio (enrichment) using the expectation in the denominator and the lower/upper bound in the numerator.
Modeling the number of interactions as a function of hotspot status
Some hotspots can affect M = 1, 2, …, I interactions, whereas others do not affect any interactions, M = 0. To account for the dispersion in M and to determine whether M is stochastically greater for hotspot than nonrecurrent variant, we modeled M as a negative binomial distribution and fit it to hotspot status (“1” for hotspot and “0” for nonrecurrent variant).
Computing edge betweenness
We computed edge betweenness for protein interaction pairs (edges) in the interactome network using algorithm from Ulrik Brandes
(Brandes 2001, 2008) (built in Python module NetworkX): Betweenness of an edge e is the sum of the fraction of all-pairs shortest paths that pass through e:
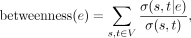 where V is the set of nodes, σ(s, t) is the number of shortest (s, t)-paths, and σ(s, t|e) is the number of those paths passing through edge e.
Gene set enrichment analysis
Enrichment of 2043 hotspot-affected interaction pairs over 3736 hotspot-unaffected interaction pairs was tested for 15,917 Gene Ontology (GO) and 186 KEGG pathway gene sets (obtained from MSigDB) (Subramanian et al. 2005). For each gene set, the fractions of hotspot-affected and hotspot-unaffected pairs overlapping with the gene set were compared using a Fisher's exact test. An interaction pair was counted when both the gene-carrying hotspot and its interaction partner are present in the gene set. Statistical significance threshold was corrected by Bonferroni.
Experimental examination of SMAD4 hotspot mutations using yeast two-hybrid assay
To perform yeast two-hybrid (Y2H), pDEST-AD and pDEST-DB plasmid vectors corresponding to the GAL4-activating domain (AD) and DNA-binding (DB) domain, respectively, were used. Full-length Clone-seq-identified mutant clones were transferred into Y2H-amenable pDEST-DB and pDEST-AD vectors by Gateway LR reactions and then transformed into MATα Y8930 and MATα Y8800, respectively. All DB-ORF MATα transformants, including wild-type ORFs, were then mated against corresponding wild-type and mutant AD-ORF MATα transformants in a pairwise orientation on YEPD agar plates. After mating, yeast was replica-plated onto selective SC–Leu–Trp–His+1 mM of 3-amino-1,2,4-triazole (3AT) as well as SC–Leu–Trp–Ade plates. Interactions were scored after 3 d of incubation and 5 d of incubation for SC–Leu–Trp+3AT and SC–Leu–Trp–Ade plates, respectively. To screen out autoactivating DB-ORFs, all DB-ORF MATα transformants were also mated pairwise against empty pDEST-AD MATα transformants and scored for growth on SC–Leu–Trp+3AT and SC–Leu–Trp–Ade plates. DB-ORFs that trigger reporter activity under this setup were removed from further experiments.
Comparing the number of common cancer types shared between hotspots
To test whether hotspots affecting same/different interactions tend to be associated with same/different cancer types, we performed pairwise comparison between cancer types linked to hotspots on the same protein. We examined 26 proteins that have at least two interface hotspots. On each protein, for each pair of hotspots, we asked (1) whether they are on the same interface—“1” for on the same interface if the two hotspots affect the same set of interactions and “0” for on different interfaces if the two hotspots affect exclusively different interactions and (2) how many common cancer types these two hotspots share. Then the number of shared cancer types between each pair of hotspots (y) was modeled against whether they are on the same interface (x) using a negative binomial model.
Tissue-specific coexpression analysis
RNA-seq data of tumor-adjacent normal tissues were obtained from the Genomic Data Commons (GDC) data portal. Ten cancer types (bowel, breast, esophagus, head and neck, kidney, liver, lung, prostate, stomach, and thyroid) with at least 40 normal tissue samples were considered for coexpression analysis. For each cancer type, we calculated coexpression coefficients of genes encoding hotspot-affected interaction pairs across corresponding normal tissue samples. Tissue-specific coexpression networks were constructed using gene pairs with an absolute Pearson correlation coefficient > 0.5.
Survival analysis
We compared the progression-free survival between patients carrying our network-prioritized hotspots (those that are on the interfaces of a cancer-type-specific, hotspot-affected interactome network) and patients carrying other hotspots. Survival curves were generated using Kaplan–Meier estimation. The statistical association between network-prioritized hotspot and patient survival outcome was evaluated using a Cox regression model, controlling for clinical covariates including patient age, gender, tumor stage, and subtype. In the discussion of cancer-type-specific mutational load, we further included mutational load (the number of nonsynonymous mutations in corresponding patients) as a covariate. Patient clinical data were obtained from the TCGA Pan-Cancer Clinical Data Resource (TCGA-CDR) (Liu et al. 2018), and cancer types that have at least five prioritized hotspots and 50 patients with available clinical information were considered for survival analysis. The progression-free interval was used as the clinical outcome endpoint following the usage recommendations by the TCGA-CDR. As a new tumor event (NTE) has not yet been clearly specified by cancer type, a more inclusive definition considering all NTEs is currently being adopted in the calculation of PFI: breast invasive carcinoma (BRCA; n = 60 for network-prioritized, n = 398 for other), esophageal carcinoma (ESCA; n = 44, 52), head and neck squamous cell carcinoma (HNSC; n = 76, 186), liver hepatocellular carcinoma (LIHC; n = 38, 25);, lung squamous cell carcinoma (LUSC; n = 42, 64), rectum adenocarcinoma (READ; n = 47, 67), and stomach adenocarcinoma (STAD; n = 88, 124).
Collection of genetic biomarkers used in targeted therapy
We searched for single-nucleotide variation (SNV) sites that are used as genetic biomarkers in cancer targeted therapy using My Cancer Genome (Swanton 2012), a unified genomics and clinical trial portal (https://www.mycancergenome.org/). My Cancer Genome provides information on the clinical impact of molecular biomarkers, derived from FDA labels, NCCN or other guidelines, clinical trials, peer-reviewed literatures, and others. In total, we collected a list of 106 SNV biomarkers, the clinical use of which is either approved by FDA or under at least one clinical practice guidelines.
Cell culture, coimmunoprecipitation, and western blotting
HEK 293T cells were maintained in complete DMEM medium supplemented with 10% FBS. Cells were seeded onto six-well dishes and incubated until 70%–80% confluency. Cells were then transfected with a mixed solution of 1 µg bait construct, 1 µg prey construct, 10 µL of 1 mg mL−1 PEI (Polysciences 23966), and 150 µL Opti-MEM (Gibco 31985-062). After 24 h of incubation, cells were gently washed three times in 1 × PBS and then resuspended in 200 µL cell lysis buffer (10 mM Tris-Cl at pH 8.0, 137 mM NaCl, 1% Triton X-100, 10% glycerol, 2 mM EDTA, and 1 × EDTA-free complete protease inhibitor tablet [Roche]) and incubated for 30 min on ice. Extracts were cleared by centrifugation for 10 min at 16,000g at 4 °C. For coimmunoprecipitation, 100 µL cell lysate per sample was incubated with 5 μL EZ view red anti-FLAG M2 affinity gel (Sigma-Aldrich F2426) for 2 h at 4°C under gentle rotation. After incubation, bound proteins were washed three times in cell lysis buffer and then eluted in 50 μL elution buffer (10 mM Tris-Cl at pH 8.0, 1% SDS) for 10 min at 65°C. Cell lysates and coimmunoprecipitated samples were then treated in 6 × SDS protein loading buffer (10% SDS, 1 M Tris-Cl at pH 6.8, 50% glycerol, 10% β-mercaptoethanol, 0.03% bromophenol blue) and subjected to SDS–PAGE. Proteins were then transferred from gels onto PVDF (Amersham) membranes. Anti-FLAG (Sigma-Aldrich F1804) and anti-MYC (9E10; Invitrogen MA1-980) at 1:5000 and 1:3000 were used for immunoblotting analysis.
Drug response analysis of network-prioritized hotspots
Pharmacogenomic data were downloaded from Iorio et al. (2016). Drug sensitivity profiles comprise the natural log half-maximal inhibitory concentration (IC50) values of 265 drugs tested across 990 molecularly annotated human cancer cell lines. We adopted an analysis of variance (ANOVA) model from Cheng et al. (2021) to evaluate the difference in the drug response of cell lines harboring specific hotspot mutations. Specifically, for each drug, a drug-response vector of n IC50 values from n cell lines was modeled as a linear combination of the mutational status of a particular hotspot, the tissue of origin of the cell lines, screening medium, and microsatellite instability. P-values were corrected by the Benjamini–Hochberg method (Adzhubei et al. 2010); a hotspot-drug association was considered significant if it has an FDR ≤ 0.1. Effect sizes were quantified using a Cohen's d statistic, which is the difference between two means divided by the pooled standard deviation.
Expression analysis of interaction partner genes in tumors
To systematically examine the expression of interaction partners in specific tumors, we used RNA-seq data from approximately 11,000 tumors uniformly processed by TCGA (The Cancer Genome Atlas Research et al. 2013; https://portal.gdc.cancer.gov/). For each interaction partner gene associated with a particular hotspot, we considered it to be expressed if it has an FPKM (fragments per kilobase of exon model per million reads mapped) value ≥1.0 across ≥80% of the tumors carrying that hotspot. The vast majority (1990/2342 = 85.0%) of the partner genes were found expressed in corresponding tumors (Supplemental Fig. 8A), suggesting little context-dependent expression bias. Although we recapitulated our results using the subset of expressed interactions (Supplemental Fig. 8B–G), we present the full-interactome data analyses considering the limited coverage (<50%) of unified gene expression data across tumors from multiple projects used in this study.
Software availability
All scripts for analyses in the manuscripts are available as Supplemental Code.
Competing interest statement
The authors declare no competing interests.
Acknowledgments
We thank the members of the Yu laboratory for constructive discussions. This work was supported by National Institute of General Medical Sciences grants (R01 GM104424, R01 GM124559, R01 GM125639), a National Cancer Institute grant (R01 CA167824), a Eunice Kennedy Shriver National Institute of Child Health and Human Development grant (R01 HD082568), a National Human Genome Research Institute grant (UM1 HG009393), a National Science Foundation grant (DBI-1661380), and a Simons Foundation Autism Research Initiative grant (SF367561) to H.Y.
Author contributions: S.C., X.W., and H.Y. conceived the study. H.Y. oversaw all aspects of the study. S.C. designed and performed all computational analyses with input from Y.Z. and H.Y. Y.L. performed laboratory experiments. S.C. wrote the manuscript with input from S.D.W., S.M.L., and H.Y. All authors edited and approved of the final manuscript.
Footnotes
-
[Supplemental material is available for this article.]
-
Article published online before print. Article, supplemental material, and publication date are at https://www.genome.org/cgi/doi/10.1101/gr.275437.121.
- Received February 24, 2021.
- Accepted November 22, 2021.
This article is distributed exclusively by Cold Spring Harbor Laboratory Press for the first six months after the full-issue publication date (see https://genome.cshlp.org/site/misc/terms.xhtml). After six months, it is available under a Creative Commons License (Attribution-NonCommercial 4.0 International), as described at http://creativecommons.org/licenses/by-nc/4.0/.


