
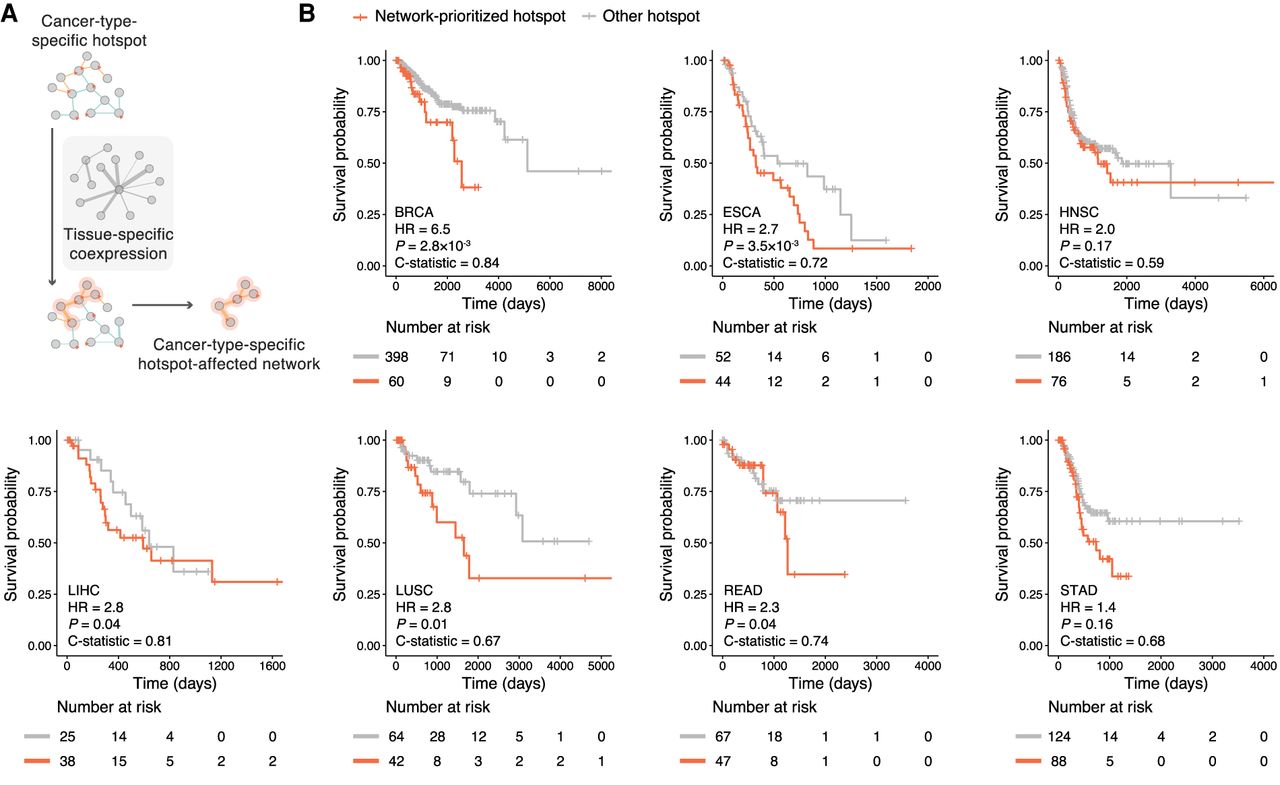
Construction of cancer-type-specific hotspot-affected networks and their prognostic values. (A) Schematic illustration of incorporating tissue-specific coexpression pattern to construct cancer-type-specific hotspot-affected networks. (B) Association of our network-prioritized hotspots with patients’ survival. Survival probabilities and curves were obtained using Kaplan–Meier estimates (red denotes patients harboring network-prioritized hotspot mutations; gray denotes patients harboring other hotspot mutations). Number at risk tables are shown under corresponding Kaplan–Meier plots, indicating the number of subjects at risk immediately before the time point. Hazard ratio (HR), P-value, and C-statistic were calculated using a Cox regression model. (BRCA) Breast invasive carcinoma, (ESCA) esophageal carcinoma, (HNSC) head and neck squamous cell carcinoma, (LIHC) liver hepatocellular carcinoma, (LUSC) lung squamous cell carcinoma, (READ) rectum adenocarcinoma, (STAD) stomach adenocarcinoma. Number of hotspots included in each Kaplan–Meier analysis (Nprioritized and Nother, respectively): BRCA = 18, 66; ESCA = 13, 33; HNSC = 10, 52; LIHC = 8, 11; LUSC = 17, 51; READ = 20, 43; STAD = 20, 59.


