
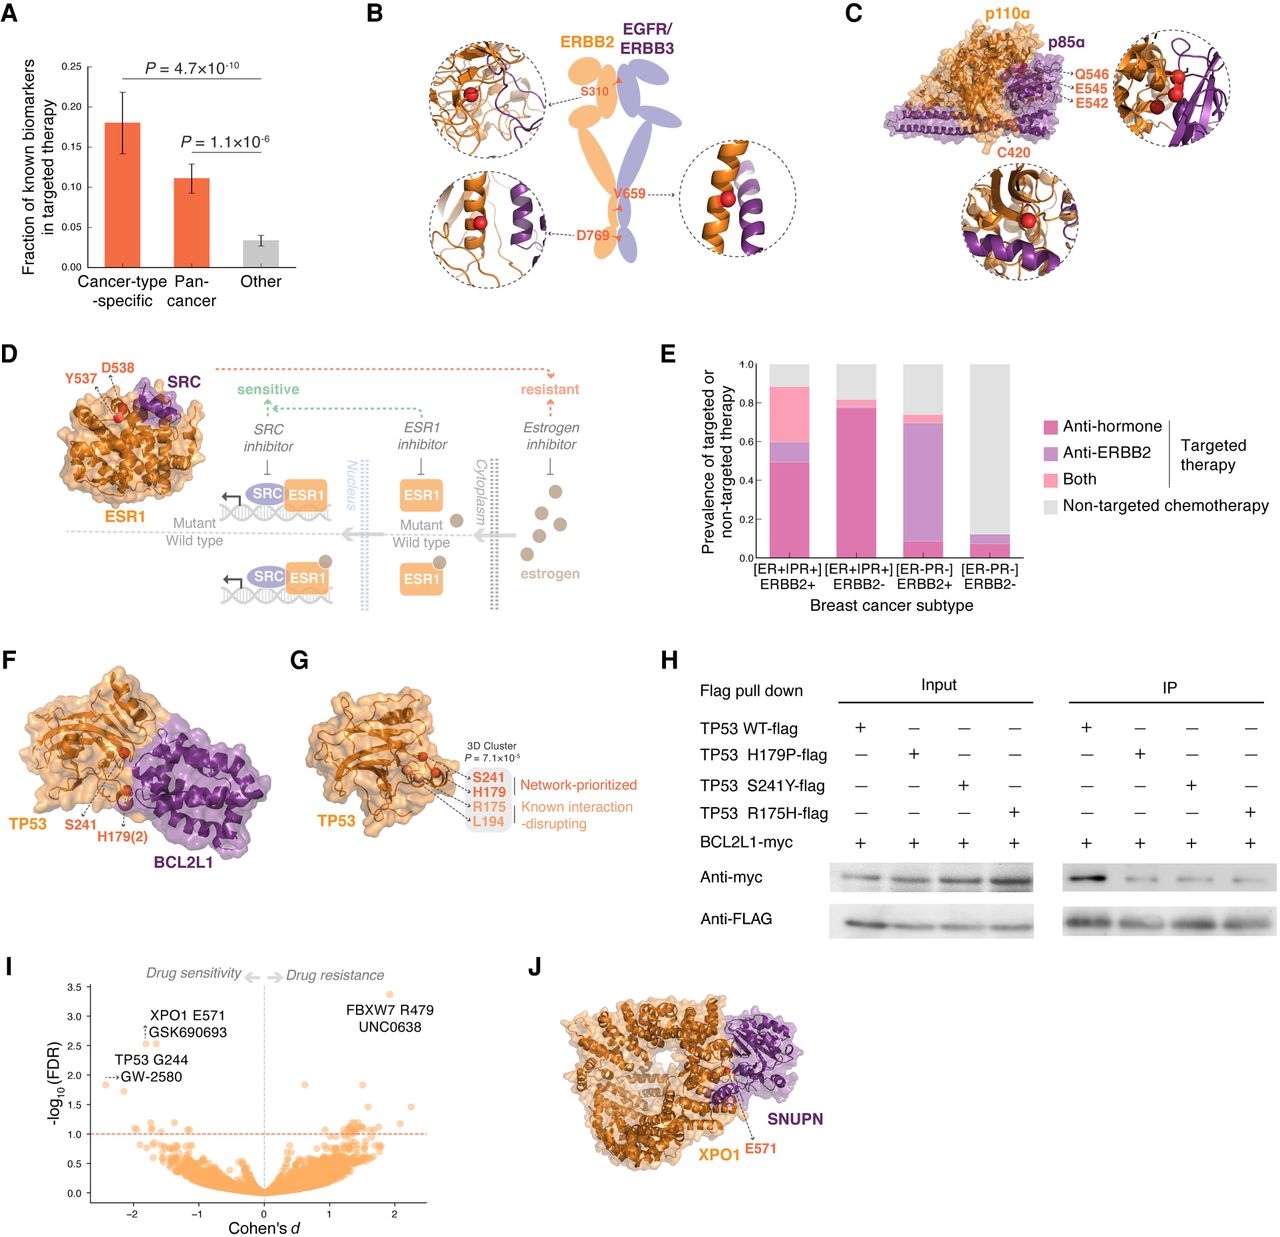
Clinical significance of network-prioritized hotspots in targeted therapy. (A) Association of our network-prioritized hotspots with known genetic biomarkers in targeted therapy. (B) Known biomarkers on the interface of ERBB2 dimers. Interfaces were determined by structural analysis of ERBB2(S310)-ERBB3 (homology model; PDB template: 3N85), ERBB2(V659)-EGFR (cocrystal structure; PDB ID: 2KS1), and ERBB2(D769)-ERBB3 (homology model; PDB template: 4RIX). (C) Known biomarkers on the interface between PIK3CA and PIK3R1 (cocrystal structure; PDB ID: 4OVU). (D) Known resistant biomarkers on the interface between ESR1 and SCR (cocrystal structure; PDB ID: 4MG8). The ESR1 interface mutations render resistant to antiestrogen treatment but are sensitive to SRC inhibitors, especially when coadministered with an ESR1 inhibitor. (E) Prevalence of targeted therapy in different breast cancer subtypes. (F) A cocrystal structure of TP53–BCL2L1 (PDB ID: 2MEJ) highlighting the TP53 H179 and S241 interface hotspots. (G) Cocrystal structure of TP53 (PDB ID: 2H1L) highlighting a 3D cluster formed by our network-prioritized hotspots (red) and known interaction-disrupting mutation residues (orange). (H) Coimmunoprecipitation validating the disruptive effects of our network-prioritized hotspot mutations TP53 H179P and S241Y, along with a previously reported oncogenic mutation R175H in 3D proximity, on the TP53–BCL2L1 interaction in HEK 293T cells. (I) Drug responses of cancer cell lines harboring network-prioritized hotspots. Known therapeutic biomarkers were excluded from the analysis toward identifying potentially novel targets. Each point denotes a specific hotspot-drug pair, for which the difference in drug response was evaluated by an analysis of variance (ANOVA) model. P-values were corrected by the Benjamini–Hochberg method (with red dashed line indicating a false-discovery rate [FDR] of 0.1). Effect sizes were quantified using a Cohen's d statistic. (J) Cocrystal structure of XPO1–SNUPN interaction (PDB ID: 5DIS) highlighting a prioritized interface hotspot XPO1 E571 that presented significant drug sensitivity.


