
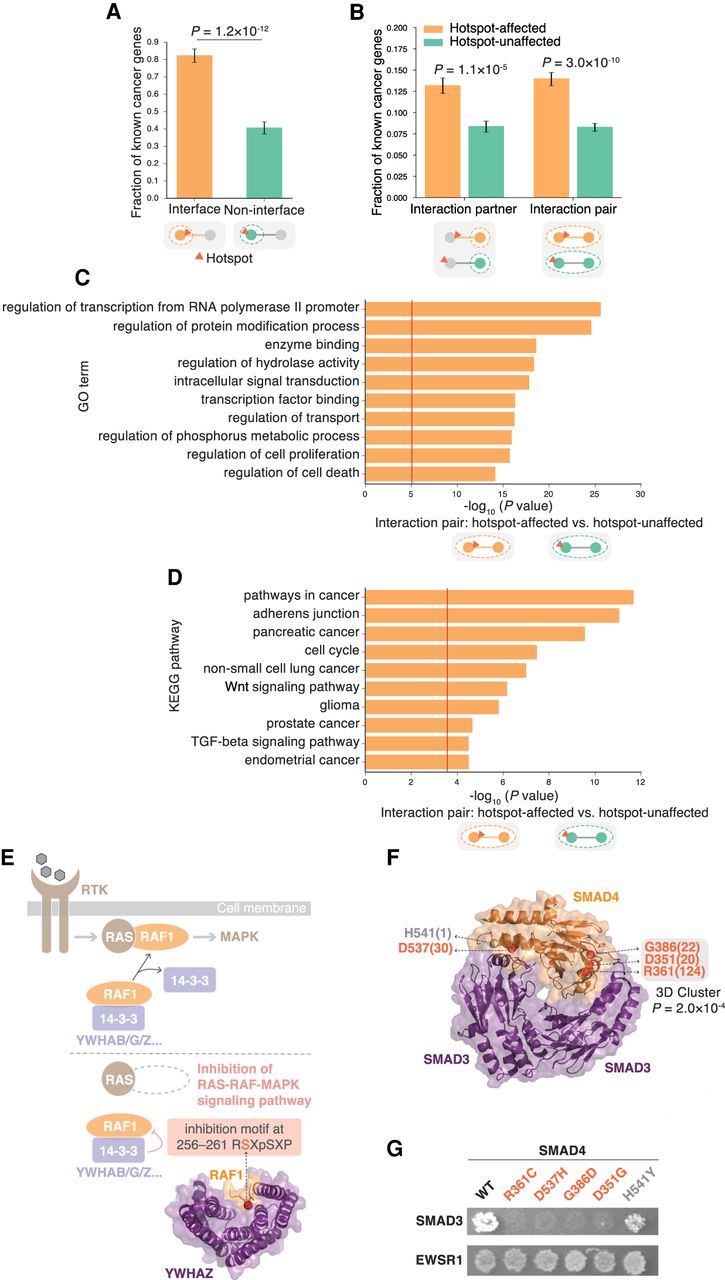
Oncogenic potential of interface hotspots and hotspot-affected interactions. (A) Association of genes harboring interface and noninterface hotspots with previously known cancer genes. (B) Association of hotspot-affected interaction partners and interaction pairs with known cancer genes. An interaction pair was counted when both the gene-carrying hotspot and its interaction partner are known cancer genes. (C,D) Gene set enrichment analysis of hotspot-affected interactions. For each Gene Ontology (GO; C) or KEGG pathway (D) gene set, an interaction pair was counted when both the gene-carrying hotspot and its interaction partner are in the gene set. The red vertical line indicates statistical significance threshold after Bonferroni correction. (E) Implication of hotspot-affected interaction RAF1 S257–[14-3-3] in the oncogenic RAS-RAF-MAPK pathway. A cocrystal structure of RAF1-YWHAZ (PDB ID: 4IHL) highlighting the RAF1 S257 interface hotspot is shown. (F) Cocrystal structure of SMAD4–SMAD3 trimer (PDB ID: 1U7F) highlighting four SMAD4 interface hotspots (red) and one nonrecurrent variant (gray). Number in parentheses indicates the recurrence of corresponding hotspot across tumor samples. (G) Effects of SMAD4 hotspot (red) and nonrecurrent (gray) mutations on SMAD4 interactions tested by a yeast two-hybrid (Y2H) assay.


